


How Preset Uses dbt and Fivetran to Visualize Recurly Revenue


We recently added a blog post about the modern data stack in an effort to educate about its history, key components, and some example technologies.
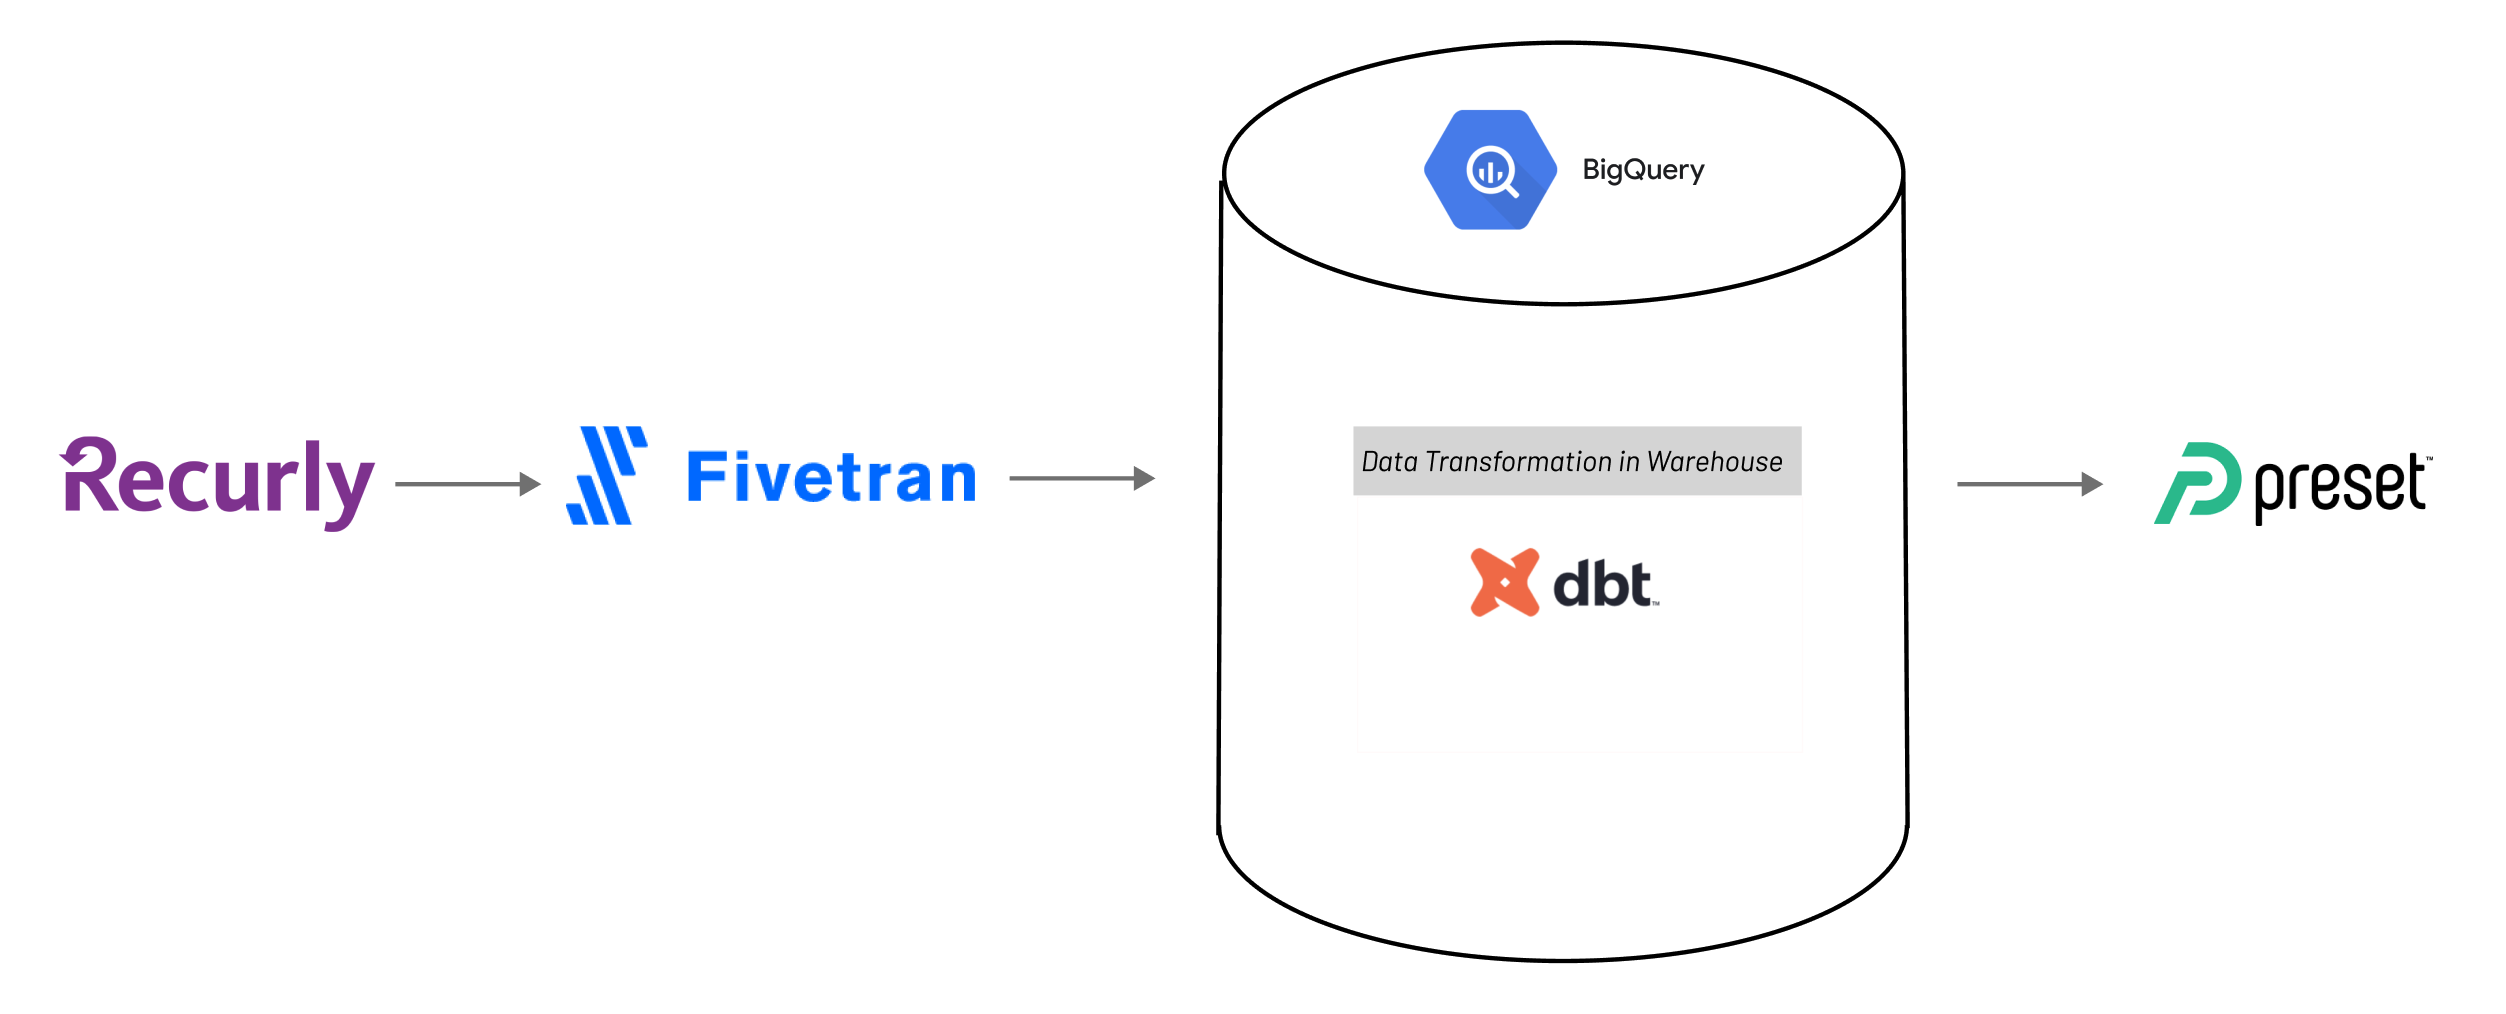
In this post we'll share a use case using some of these tools: specifically how we at Preset are currently using Fivetran and dbt centered around a BigQuery warehouse to visualize our self-service revenue analytics from Recurly.
We’ll dive into the source data ingested via Fivetran, how we’re transforming that data into datasets to be used for visualization, and some of the specific metrics we’re presenting to track Preset’s revenue goals.
Fivetran with Recurly
Recurly is a subscription and billing platform used by brands to grow their recurring revenue from acquisition to retention to scale. It provides enterprise-class subscription billing management for thousands of businesses worldwide, and allows them to dive deeper into their Recurly payment data to better understand business financials.
Fivetran, the leading data extraction and loader tool, provides a native connector to connect to Recurly and load that data into our BigQuery cloud data warehouse. Fivetran provides an ERD of what is loaded on a connector basis. The core of Preset’s Self-Service Revenue dashboard is created off three primary data sources that we’ll see below.
From Fivetran’s ERD, we can see that the Recurly model includes many different revenue source tables such as gift cards, coupons, line item history, and more. At Preset we care primarily about plan, subscription, and account histories: that is the data that provides us the ability to track our key self-service revenue metrics. Using dbt, a data transformation tool, Preset creates datasets for the specific tables and data we care about to internally track our revenue analytics. The goal in sharing our dbt SQL transformation templates is to provide one approach to revenue tracking. Depending on how your business generates revenue, the other data models may be of interest!
General Data Flow
Datasets for Dataset-Centric Visualization
Here at Preset, we generally like to take a dataset-centric approach. At a high level this means that we produce and expose highly denormalized datasets for consumption. To learn more about this approach to visualization check out the blog, The Case for Dataset-Centric Visualization, by Max Beauchemin!
The first metrics we’ll be looking are created off of our derived dataset account_subscription_history. Below we’ll walk through how we derive this crucial dataset.
All of the values in the charts have been modified for security purposes, but we have attempted to preserve the general trends and shapes — the logic in how we ultimately arrive to our final metrics dashboard is as close to the reality as we can share!
First Layer Datasets
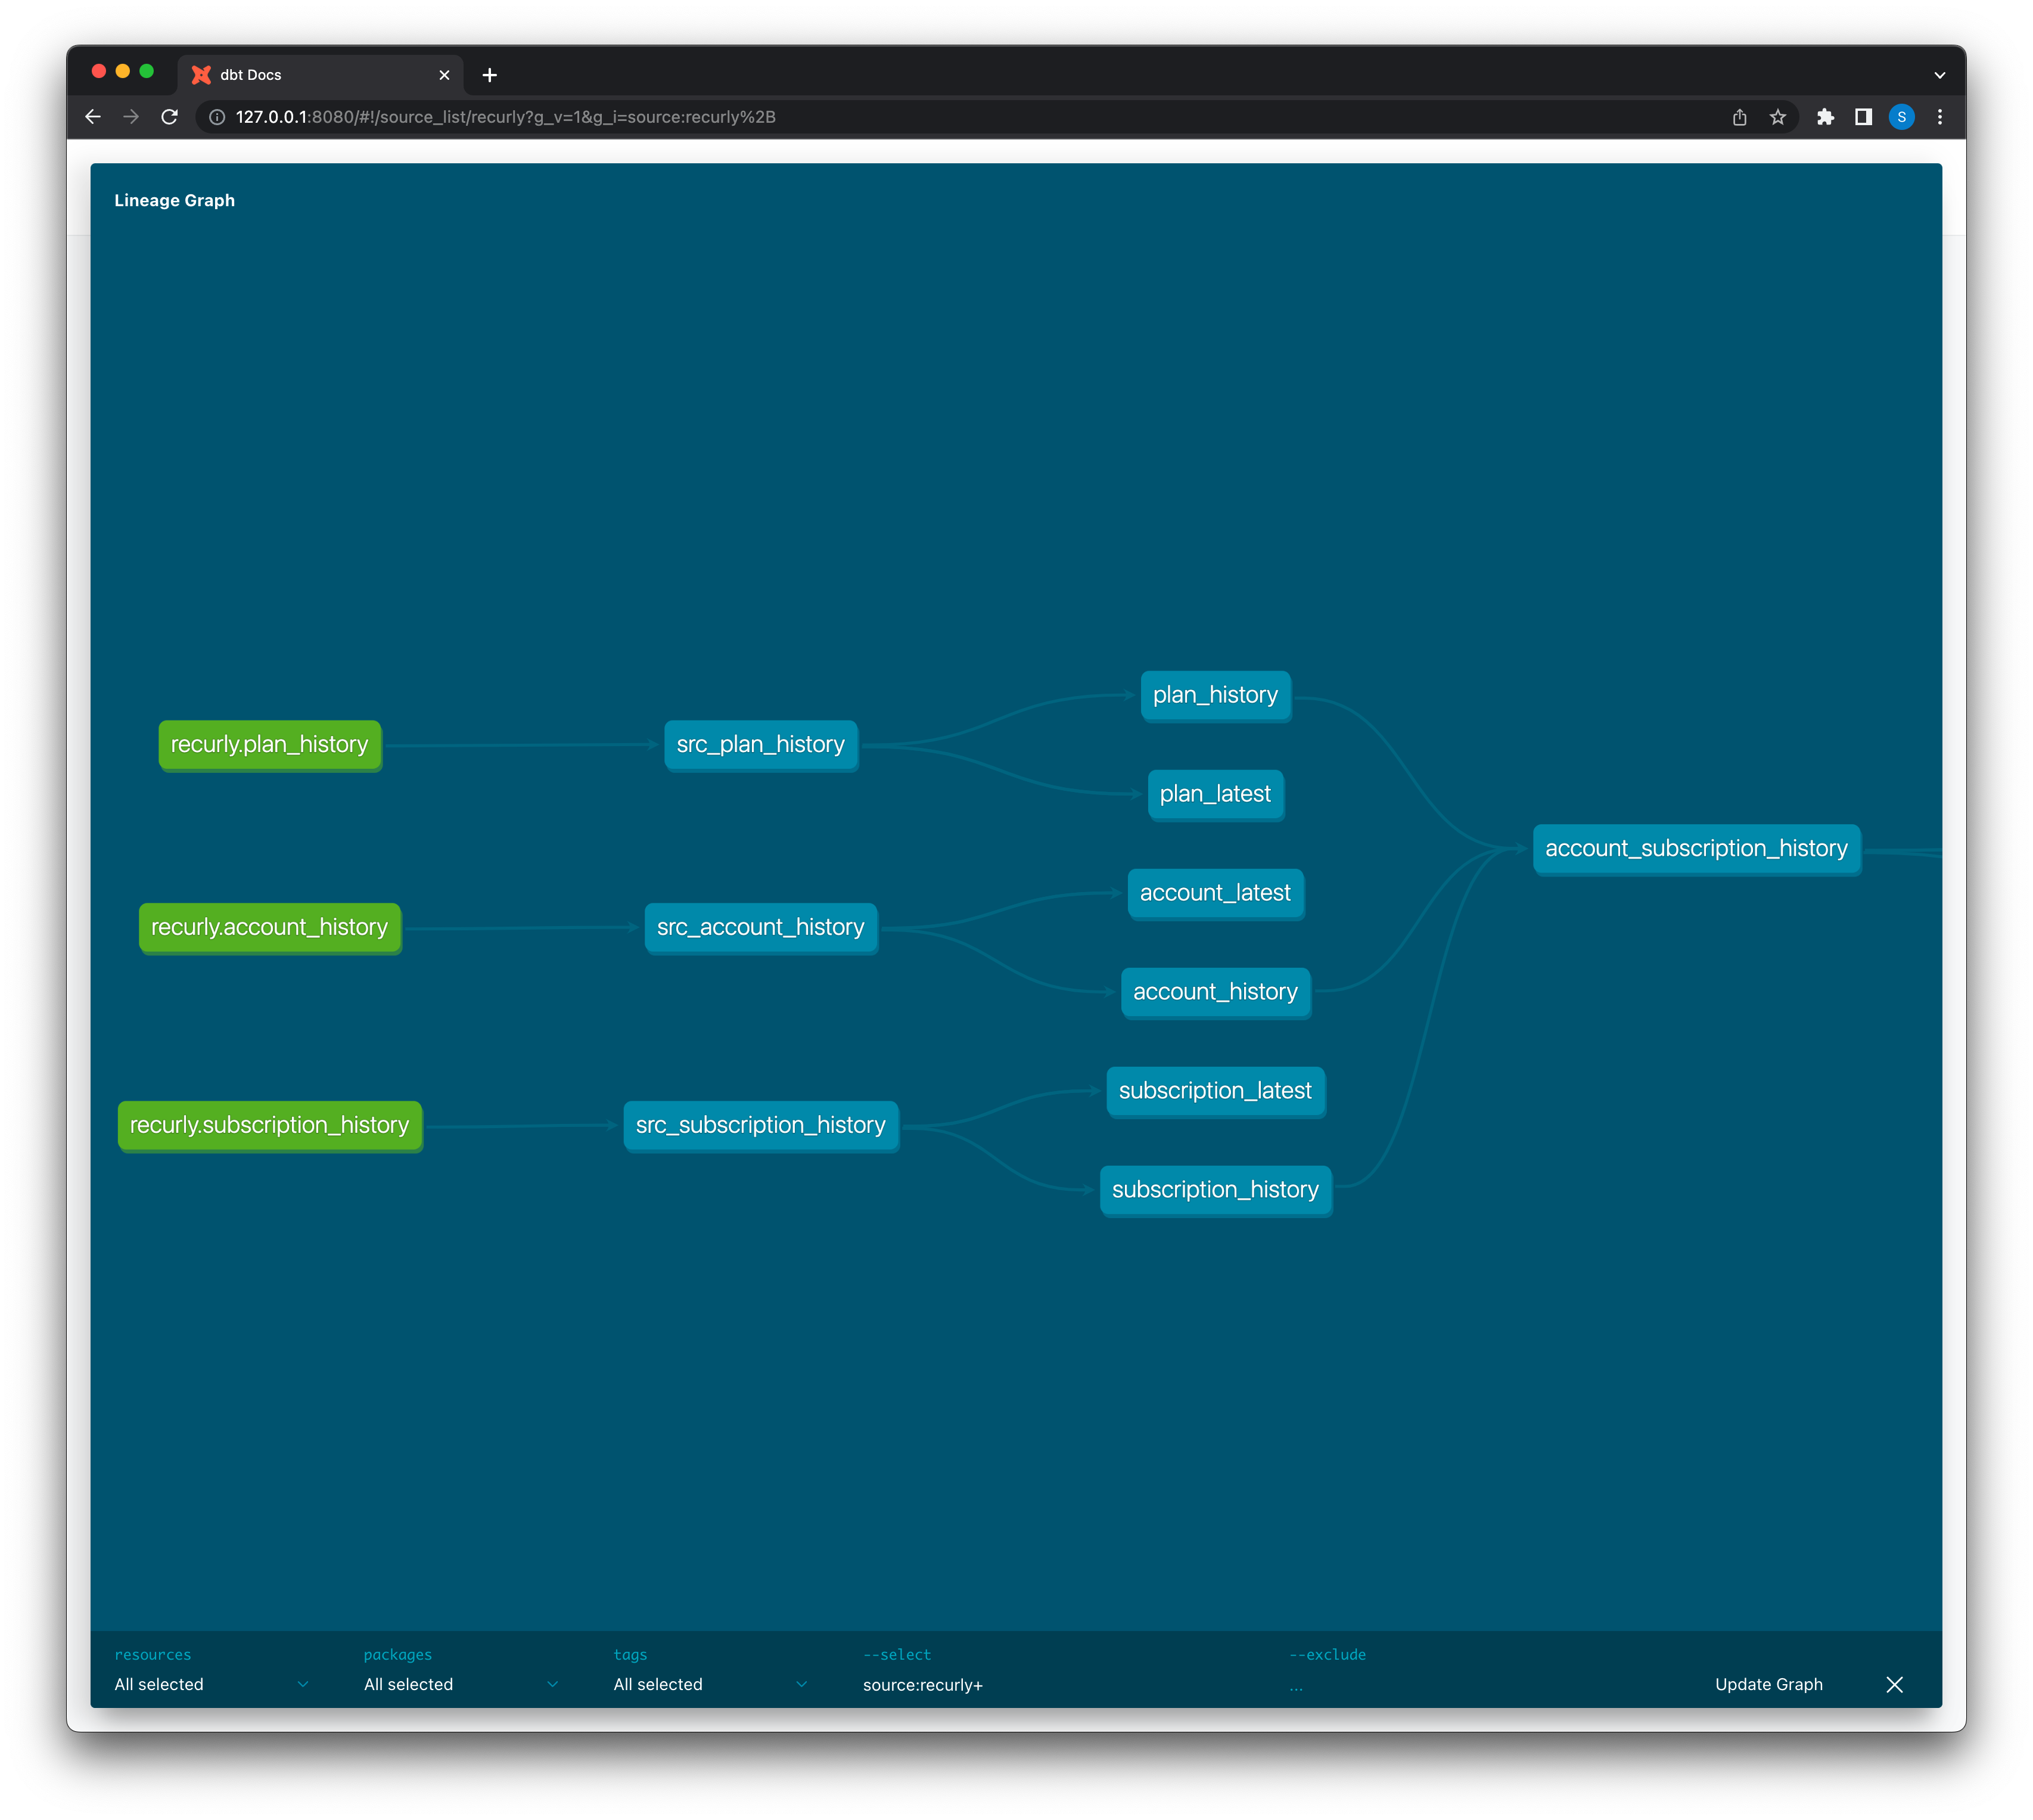
In the lineage graph above we can see the three raw tables (green nodes) that we load from Recurly, into our BigQuery warehouse, all through Fivetran with no transformations.
All of the blue nodes in the lineage graph above are datasets that are derived i.e. created via modular SQL using dbt.
Using dbt, we write SQL to select and create narrower tables from the raw untransformed data within the same warehouse.
The primary purpose of this first layer is renaming fields to make entity names clearer and add effective dates. The updated_at field is being renamed to effective_from and an effective_to field is created with the help of various SQL functions.
In the section regarding the second layer, we’ll see how this seemingly benign change to track effective dates helps us visualize our self-service revenue over time!
Dataset SQL
-
src_plan_historySELECT A.id AS plan_id, A.updated_at AS plan_updated_at, A.accounting_code, A.auto_renew AS plan_auto_renew, A.code AS plan_code, A.created_at AS plan_created_at, A.deleted_at AS deleted_at, A.description AS plan_description, A.hosted_pages_bypass_confirmation, A.hosted_pages_cancel_url, A.hosted_pages_display_quantity, A.hosted_pages_success_url, A.interval_length, A.interval_unit, A.name AS plan_name, A.setup_fee_accounting_code, A.state AS plan_state, A.tax_code AS plan_tax_code, A.tax_exempt AS plan_tax_exempt, A.total_billing_cycles AS plan_total_billing_cycles, A.trial_length AS plan_trial_length, A.trial_unit AS plan_trial_unit, CAST(A.updated_at AS DATETIME) AS effective_from, LEAD(CAST(A.updated_at AS DATETIME)) OVER (PARTITION BY A.id ORDER BY A.updated_at) AS effective_to, FROM {{ source('recurly', 'plan_history') }} AS A -
src_account_history/* Account state definitions: Active: Account has an active, expired, or canceled subscription but has not been removed from the Preset system Inactive: Account has either an expired or canceled subscription and has been removed from the Preset system */ SELECT A.id AS account_id, A.updated_at AS account_updated_at, A.account_city, A.account_country, A.account_first_name, A.account_last_name, A.account_phone, A.account_postal_code, A.account_region, A.account_street_1, A.account_street_2, A.bill_to, A.cc_emails, A.code AS account_code, A.company, A.created_at AS account_created_at, A.deleted_at AS account_deleted_at, A.email, A.exemption_certificate, A.first_name, A.hosted_login_token, A.last_name, A.preferred_locale, A.state AS account_state, A.tax_exempt, A.username, A.vat_number, CAST(A.updated_at AS DATETIME) AS effective_from, LEAD(CAST(A.updated_at AS DATETIME)) OVER (PARTITION BY A.id ORDER BY A.updated_at) AS effective_to, FROM {{ source('recurly', 'account_history') }} AS A -
src_subscription_history/* Subscription states defined: Future: Subscriptions have a start date in the future. The most common use case for a future subscription is a B2B contract where the subscription is agreed to start on a specific date. The customer is not invoiced until the start date. Active: Subscriptions are both regular paying subscriptions and subscriptions currently in a trial. Canceled: Subscriptions will automatically expire at the term renewal date. A subscription could be in a canceled state because the customer chose to cancel their auto-renewing subscription or the subscription is set to expire at the end of their current term. Expired: Subscriptions are churned subscriptions that cannot be reactivated. A subscription can be expired due to involuntary churn by the dunning cycle or voluntary churn by canceling. */ SELECT A.id AS subscription_id, A.updated_at AS subscription_updated_at, A.account_id, A.activated_at, A.add_ons_total, A.auto_renew, A.bank_account_authorized_at, A.canceled_at, A.collection_method, A.created_at AS subscription_created_at, A.currency, A.current_period_ends_at, A.current_period_started_at, A.current_term_ends_at, A.current_term_started_at, A.customer_notes, A.expiration_reason, A.expires_at, A.net_terms, A.object, A.paused_at, A.plan_id, A.po_number, A.quantity, A.remaining_billing_cycles, A.remaining_pause_cycles, A.renewal_billing_cycles, A.shipping_address_id, A.started_with_gift, A.state AS subscription_state, A.subtotal, A.terms_and_conditions, A.total_billing_cycles, A.trial_ends_at, A.trial_started_at, A.unit_amount, A.uuid AS subsription_uuid, CAST(A.updated_at AS DATETIME) AS effective_from, LEAD(CAST(A.updated_at AS DATETIME)) OVER (PARTITION BY A.id ORDER BY A.updated_at) AS effective_to, FROM {{ source('recurly', 'subscription_history') }} AS A
Second Layer Datasets
We can see that the datasets in the second layer of blue nodes are all derived from these src_* datasets. The primary purpose of this second layer is to materialize daily snapshots (materialize config in our dbt SQL models below) of our plan, account, and subscription history datasets.
This is a lot of data duplication on a day-to-day basis, but there’s a good reason for it! The historical datasets are super small, and materializing daily snapshots of the entire history to today enables us to perform accurate time-series analysis to get a trusted and clear picture of how self-service revenue is evolving over time.
For example, something as simple as number of customers over time would be difficult in the first layer datasets, but become much easier to calculate using daily materialized snapshots.
In the lineage graph you’ll notice *_history and *_latest datasets — we do not currently use or materialize the latest datasets so we won’t go into them.
Dataset SQL
-
plan_history/* plan_history */ {{ config(materialized="table") }} WITH date_spine AS ( SELECT dt, FROM {{ ref('date_spine') }} ) SELECT T.dt, A.* FROM date_spine T JOIN{{ ref('src_plan_history') }} AS A ON T.dt > A.effective_from AND T.dt < COALESCE(A.effective_to, '3000-01-01') -
account_history/* account_history */ {{ config(materialized="table") }} WITH date_spine AS ( SELECT dt, FROM {{ ref('date_spine') }} ) SELECT T.dt, A.* FROM date_spine T JOIN{{ ref('src_account_history') }} AS A ON T.dt > A.effective_from AND T.dt < COALESCE(A.effective_to, '3000-01-01') -
subscription_history/* subscription_history */ {{ config(materialized="table") }} WITH date_spine AS ( SELECT dt, FROM {{ ref('date_spine') }} ) SELECT T.dt, A.* FROM date_spine T JOIN{{ ref('src_subscription_history') }} AS A ON T.dt > A.effective_from AND T.dt < COALESCE(A.effective_to, '3000-01-01')
Effective Dates, Date Spines, and SQL Generators
In the models above, we can now see how we’re using our effective_from and effective_to fields. We’re joining on date-time values on a specified range to date_spine using the effective date fields.
So…what is date_spine? First, let’s talk about SQL Generators.
SQL Generators
dbt comes with numerous pre-built macros to simplify writing modular SQL. A particular subset of macros known as SQL Generators are included in the dbt-utils package.
These macros generate SQL (either a complete query, or a part of a query). They often implement patterns that should be easy in SQL, but for some reason are much harder than they need to be.
date_spine returns the sql required to build a date spine.
Date Spine
A date spine table is useful for any use case that requires rows of dates where no dates exists in the original data.
For example in an employee turnover use case, you might have data that looks like this:
| employee_id | start_date | end_date |
|---|---|---|
| 1 | Jan 1, 2020 | Mar 31, 2022 |
| 2 | Jun 1 2018 | NULL |
| 3 | May 6, 2010 | May 31, 2022 |
To show how many employees were at the company on any given day you need a different data structure, one that has every possible date and everyone who was at the company on those dates.
To solve this you need a master date/calendar table, and this can be done using the date_spine macro!
The dbt date_spine macro will include the start_date (if it is aligned to the datepart), but it will not include the end_date.
Usage
The general code to call the date_spine macro:
{{ dbt_utils.date_spine(
    datepart="day",
    start_date="cast('2019-01-01' as date)",
    end_date="cast('2020-01-01' as date)"
   )
}}
At Preset, we generate the date spine we need as:
{{
    config(materialized='table')
}}

SELECT DATE(date_day) AS dt,
FROM (
    {{ dbt_utils.date_spine(
        datepart="day",
        start_date=var("start_date"),
        end_date=var("end_dt")
	    )
    }}
)
WHERE DATE(date_day) < DATE('{{ run_started_at.strftime("%Y-%m-%d") }}')
Now we can run queries to show the past for any arbitrary number of days into the past!
Third Layer Dataset
Finally, using the three *_history tables, we can derive our account_subscription_history table like:
{{ config(materialized="table") }}
/*
	A case when statement to calculate monthly recurring revenue given
	the values of specifc account subscription history values from the
	second layer datasets. Having the query string allows us to refer to
	the values obtained by this query by using `mrr_expr` in our model.
*/
{% set mrr_expr = """
CASE
    WHEN z.email IS NOT NULL THEN Z.amount / 12
    WHEN DATE(expires_at) <= A.dt THEN NULL
    WHEN plan_code = 'professional-ga-launch-annual' THEN subtotal / 12
    ELSE subtotal
END
""" %}

WITH raw_qry AS (
    SELECT
        DATE(A.dt) AS dt,
				/*
					If the account has no email and expiry date is in the past,
					the account has expired.
				*/
        CASE WHEN Z.email IS NULL AND DATE(expires_at) <= A.dt THEN TRUE ELSE FALSE END AS is_expired,
				/*
					All trials must have an email.
					Determine whether the trial is active or expired.
				*/
        CASE
            WHEN Z.status IS NOT NULL THEN Z.status
            WHEN DATE(expires_at) <= A.dt THEN 'expired'
            WHEN (trial_ends_at IS NULL AND COALESCE(subtotal, 0) > 0) OR DATE(trial_ends_at) <= A.dt THEN 'paying'
            ELSE 'trial'
        END AS trial_status,
        subtotal AS raw_amount,
        CASE WHEN COALESCE(DATE(expires_at), DATE('2050-01-01')) < DATE(trial_ends_at) THEN DATE(expires_at) ELSE DATE(trial_ends_at) END  AS trial_ended_at,
        {{ mrr_expr }} AS mrr,
        /* standard if no upgrade status available i.e trial to paid */
        COALESCE(Z.upgrade_status, 'standard') AS upgrade_status,
    FROM {{ ref('account_history') }} AS A
    JOIN {{ ref('subscription_history') }} AS B ON A.account_id = B.account_id AND A.dt = B.dt
),
rr_qry AS (
    SELECT
        *,
        COALESCE(CASE WHEN trial_status = 'paying' THEN mrr END, 0) AS mrr_paying,
        COALESCE(CASE WHEN trial_status = 'trial' THEN mrr END, 0) AS mrr_trial,
    FROM raw_qry
),
SELECT
    *,
    CASE WHEN LOWER(plan_name) LIKE '%monthly%' THEN mrr_paying / 22 ELSE mrr_paying / 20 END AS sold_seats,
    CASE WHEN is_expired THEN 1 ELSE 0 END as lost_deals,
    CASE WHEN NOT is_expired AND trial_status = 'paying' THEN 1 ELSE 0 END as won_deals,
FROM rr_qry A
to visualize the metrics we’ll get to in the next section!
The query above has been modified to only show MRR (monthly recurring revenue) calculations — ARR (annual recurring revenue) can be calculated by including mrr_expr * 12 AS ARR as an additional line where mrr_expr AS mrr is. For the sake of complexity this code has been simplified, but we’ll still see both MRR and ARR charts in the next section!
Visualizing our Self-Service Revenue Metrics
In this section we’ll see some of the visualizations and metrics we use at Preset to keep tabs on our self-service revenue growth over time. Specific numbers have been hidden, but all of these charts were created through configuration in the no-code chart builder interface. The queries provided were generated by Superset based only on the user configured charts. You can learn more about chart creation in the Preset docs!
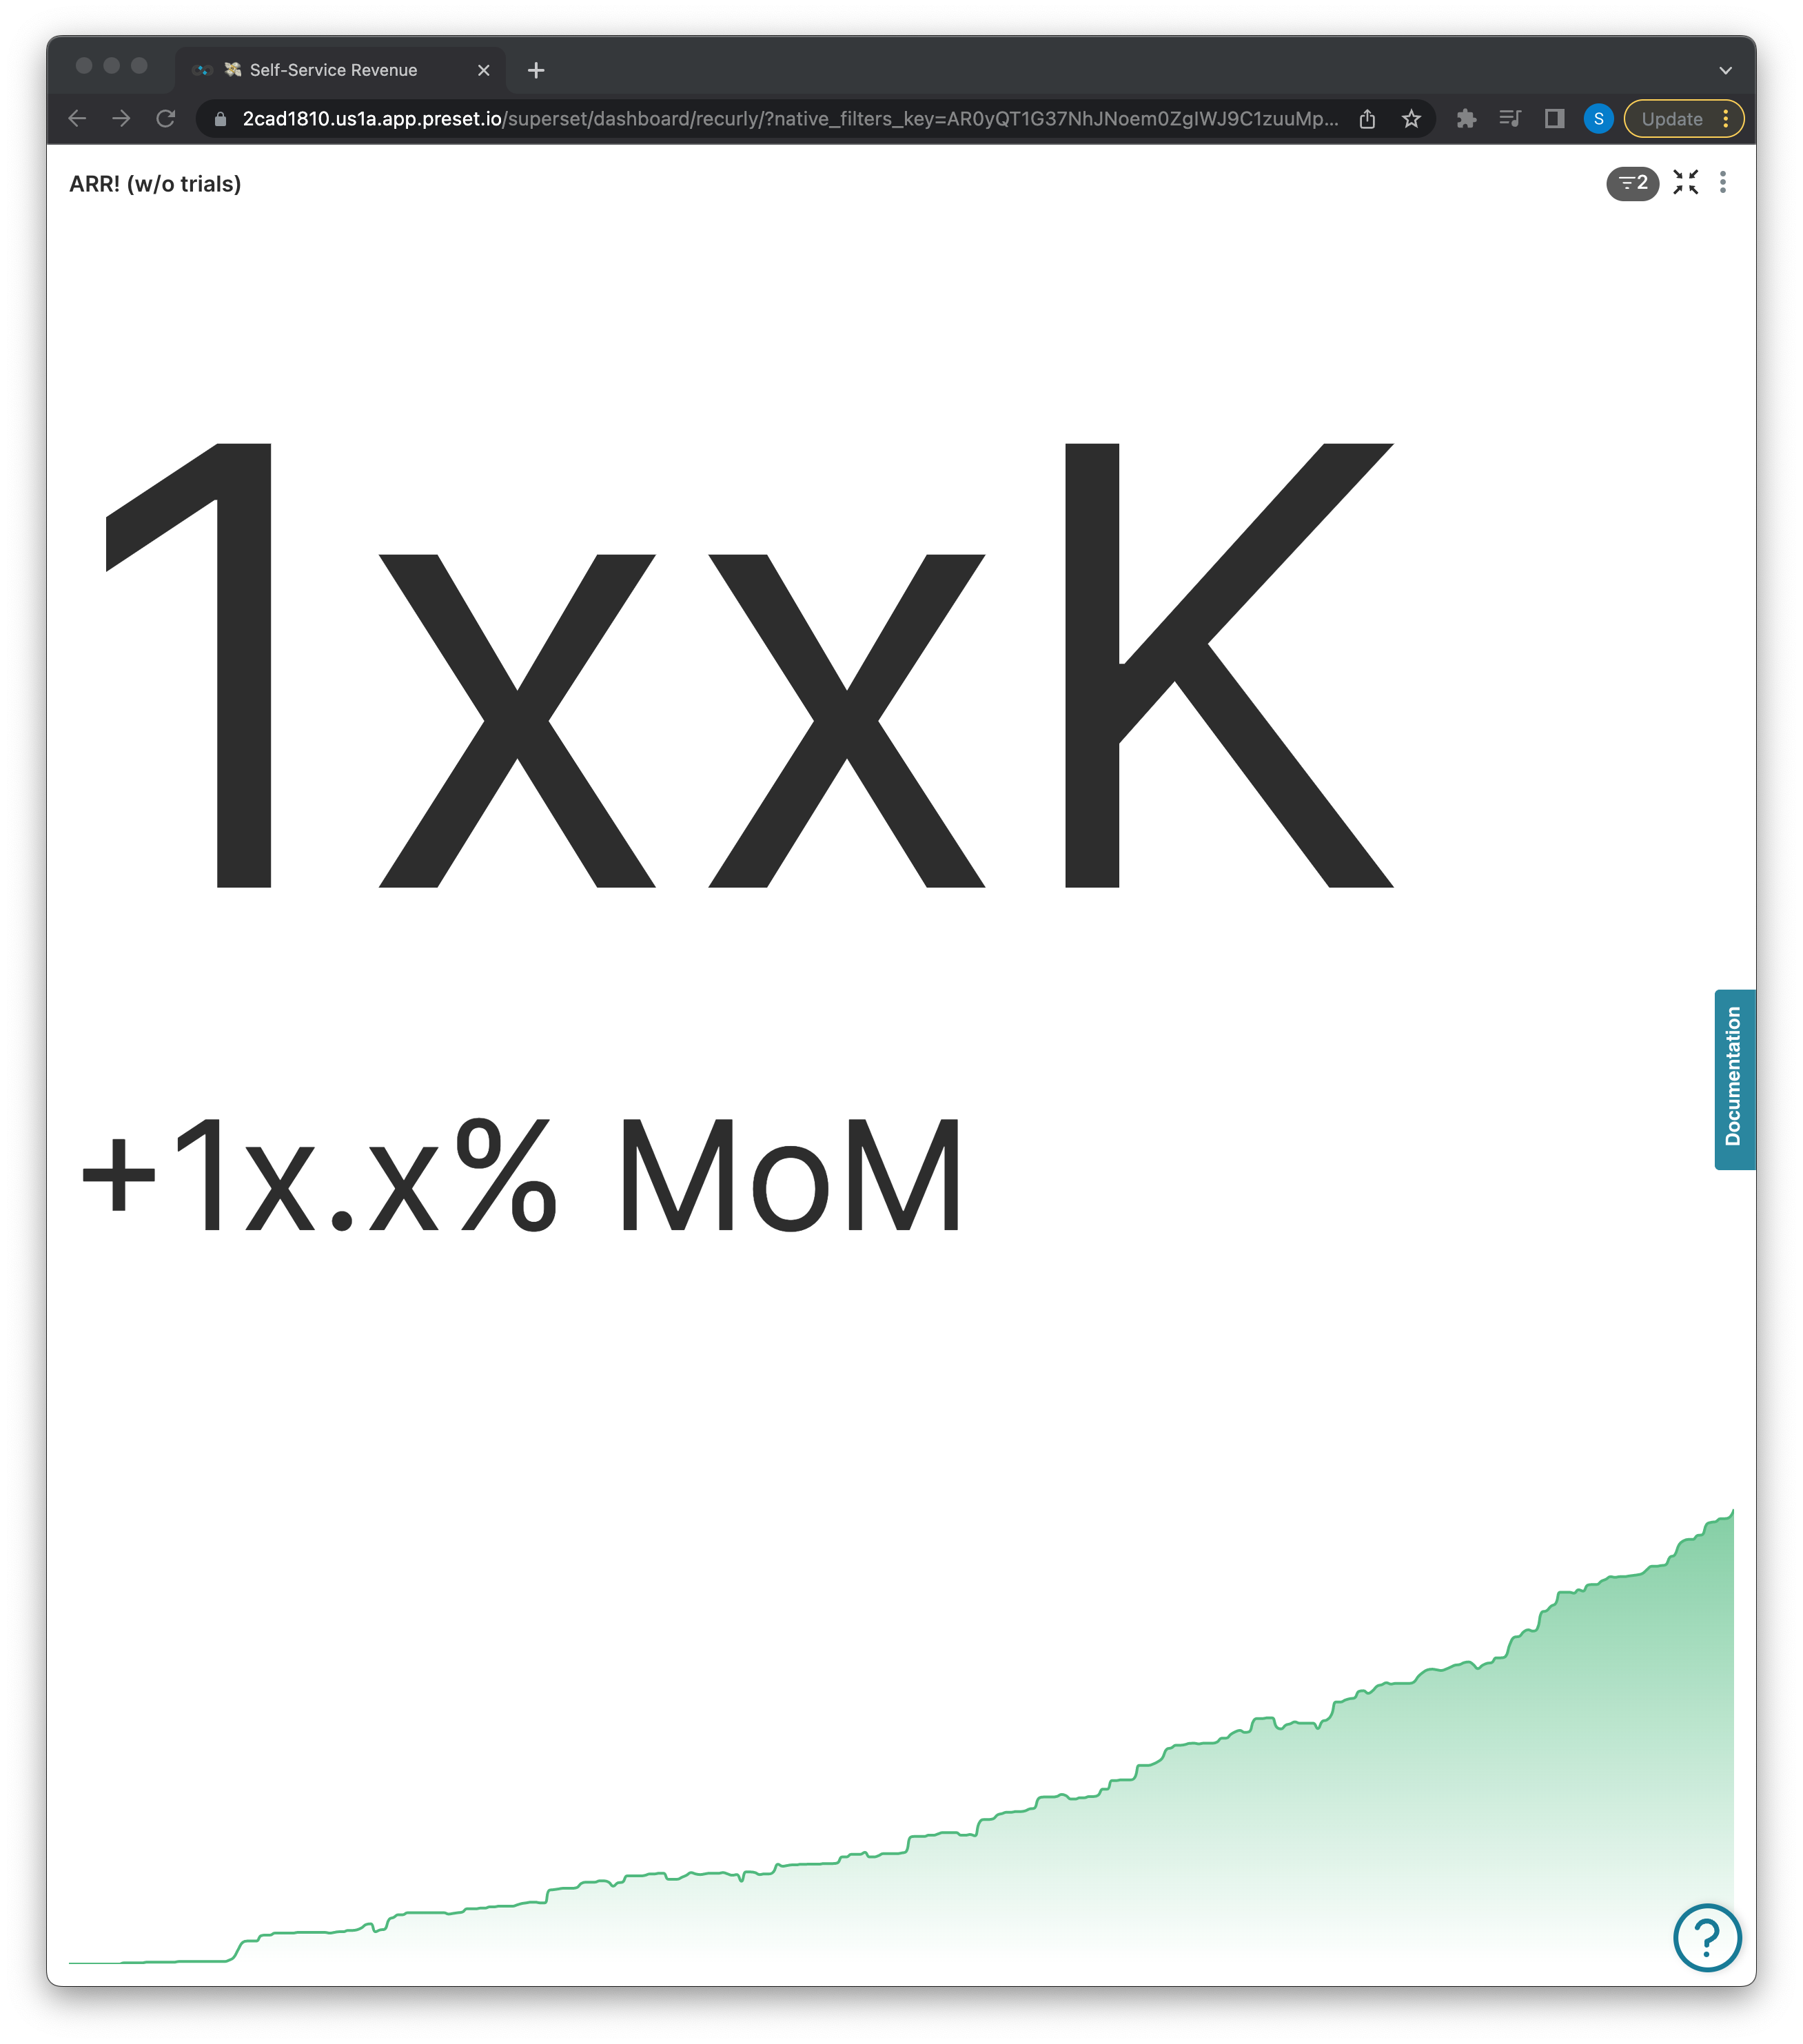
ARR without Trials
Annual Recurring Revenue, or ARR, is subscription metric that shows the money that comes in every year for the life of a subscription. More specifically, ARR is the value of the recurring revenue of a business's term subscriptions normalized for a single calendar year. Here we see our ARR not including trial accounts.
SELECT DATE_TRUNC(`dt`,DAY)AS `__timestamp`,
SUM(arr_paying)AS `arr_paying`
FROM `core_recurly`.`account_subscription_history`
WHERE `upgrade_status`IN ('standard')
AND `is_preset`IN ('FALSE')
GROUPBY `__timestamp`
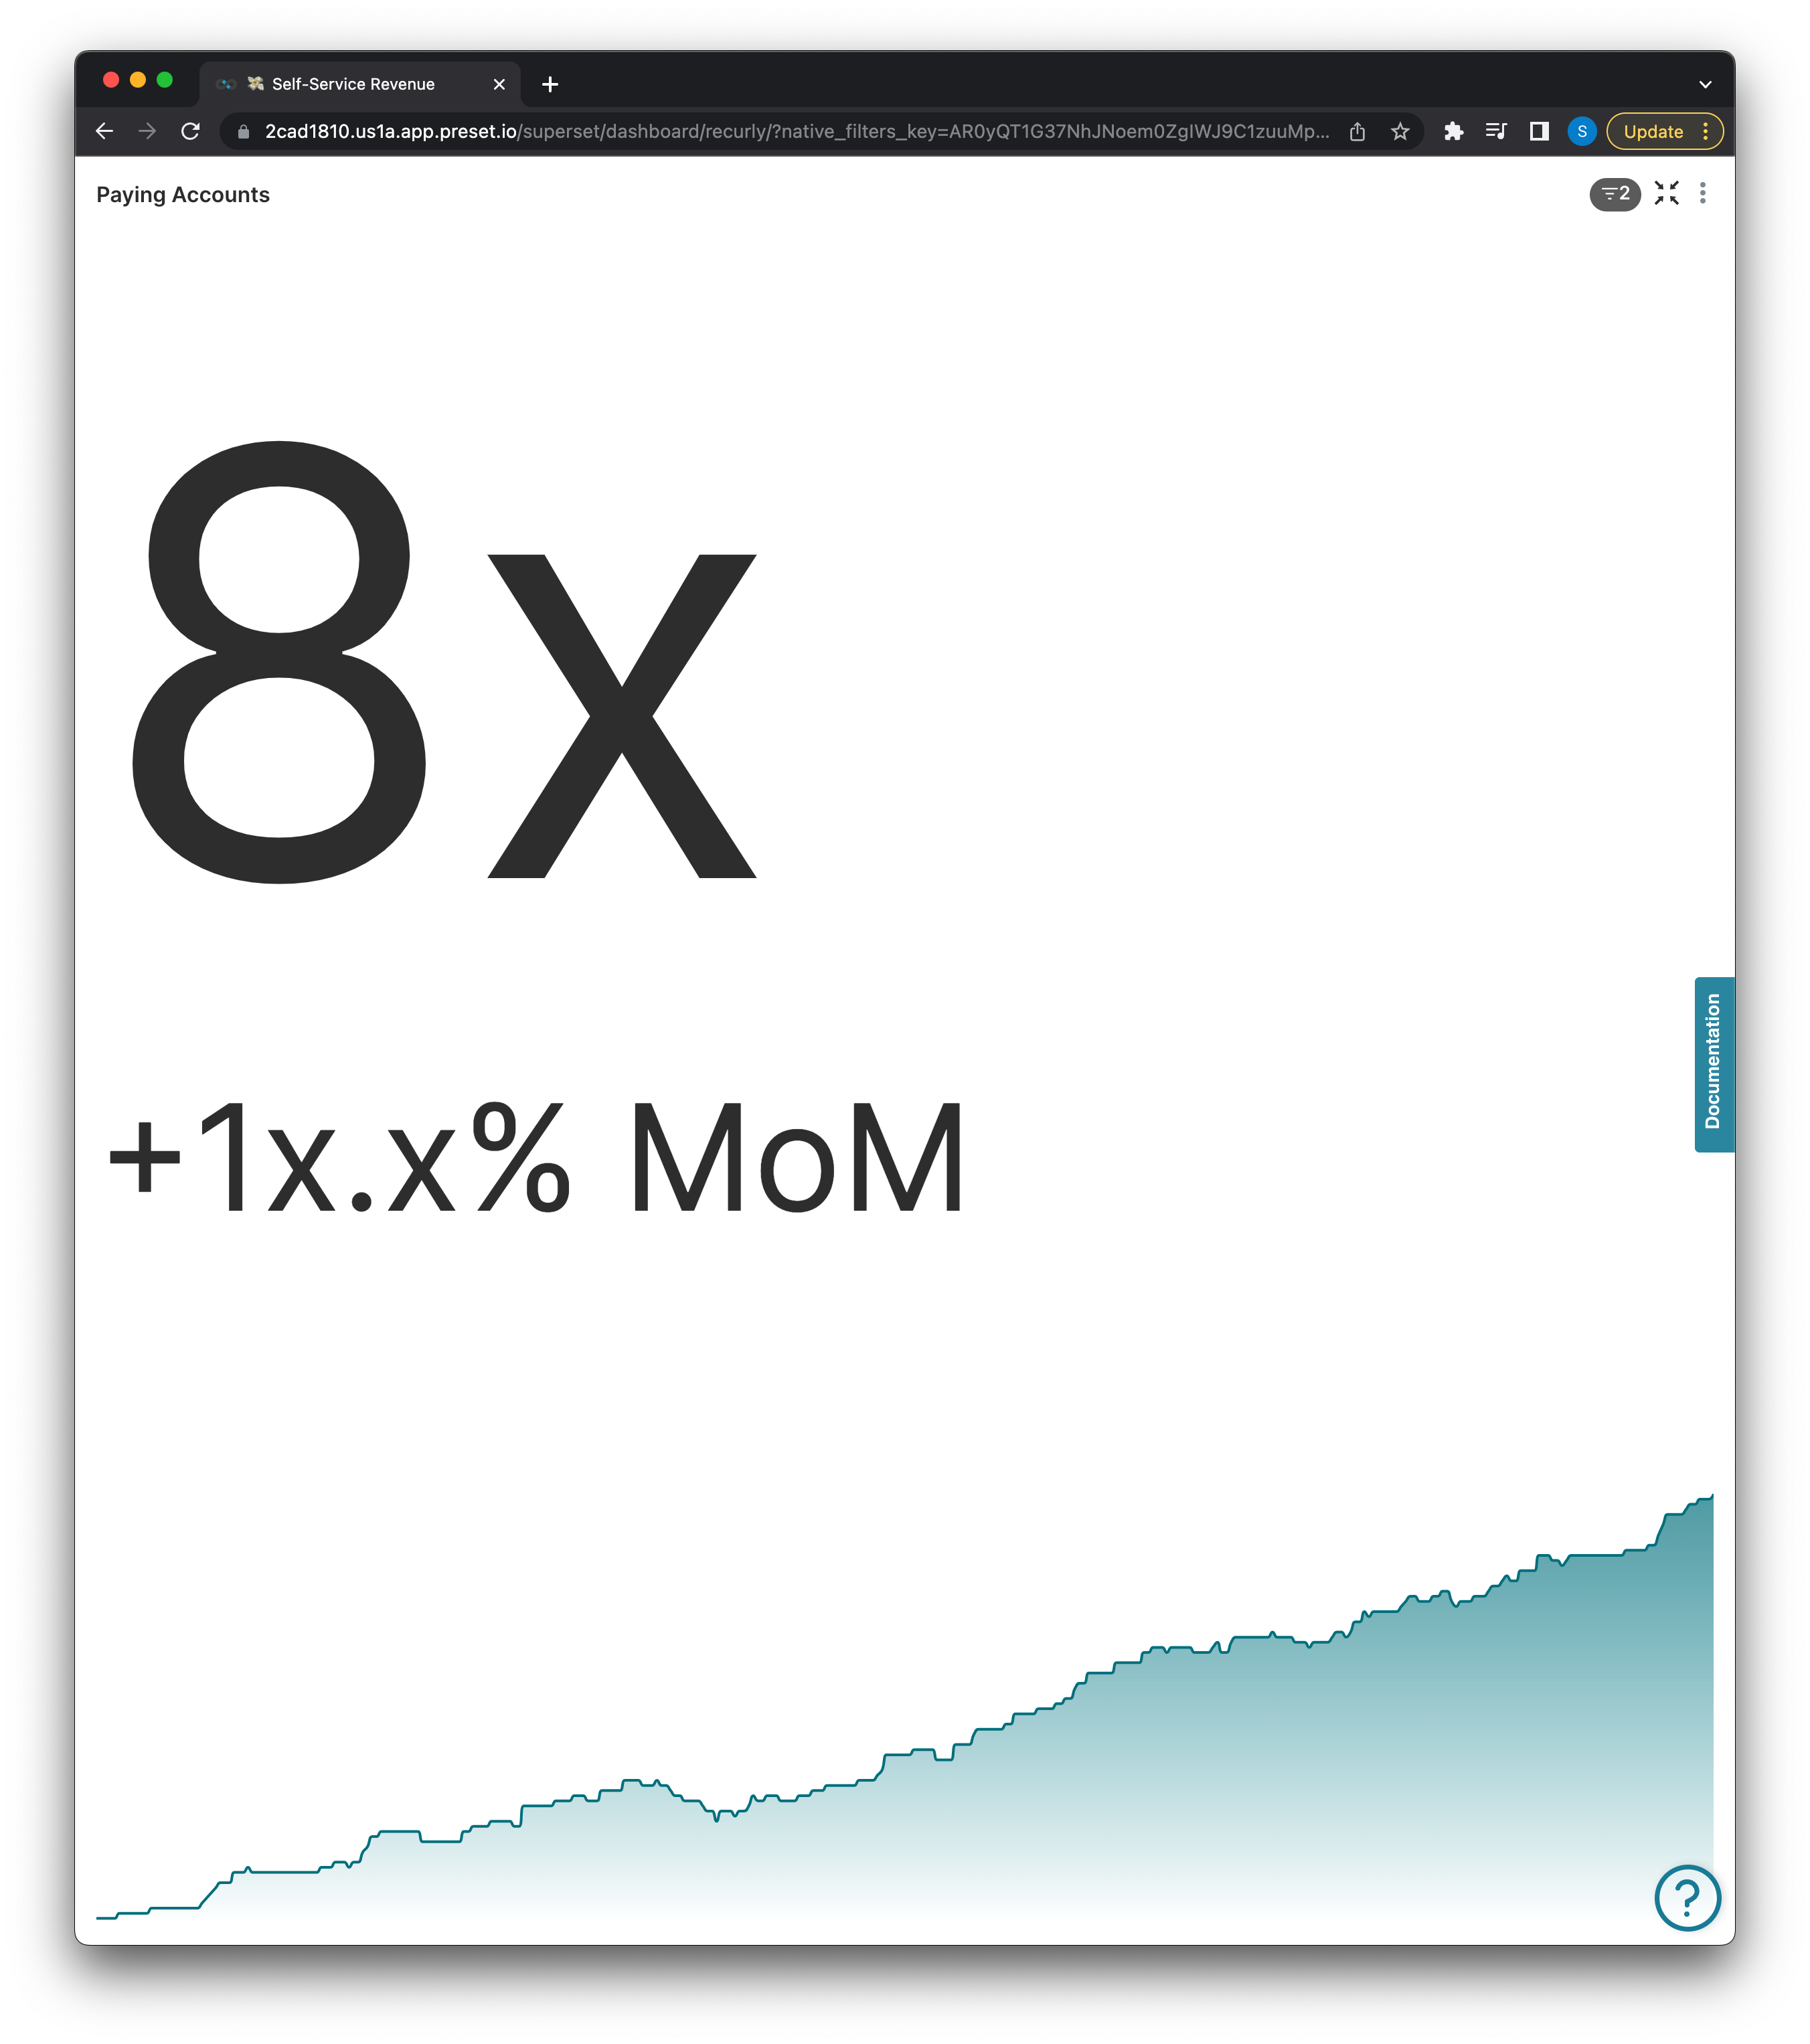
LIMIT 5000Paying Accounts
The number of total accounts currently paying for Preset services with the month over month increase below.
SELECT DATE_TRUNC(`dt`,DAY)AS `__timestamp`,
COUNT(*)AS `count`
FROM `core_recurly`.`account_subscription_history`
WHERE `dt` >= CAST('2021-08-15'ASDATE)
AND `upgrade_status`IN ('standard')
AND `is_preset`IN ('FALSE')
AND `is_expired`IN (false)
AND `trial_status`IN ('paying')
GROUPBY `__timestamp`
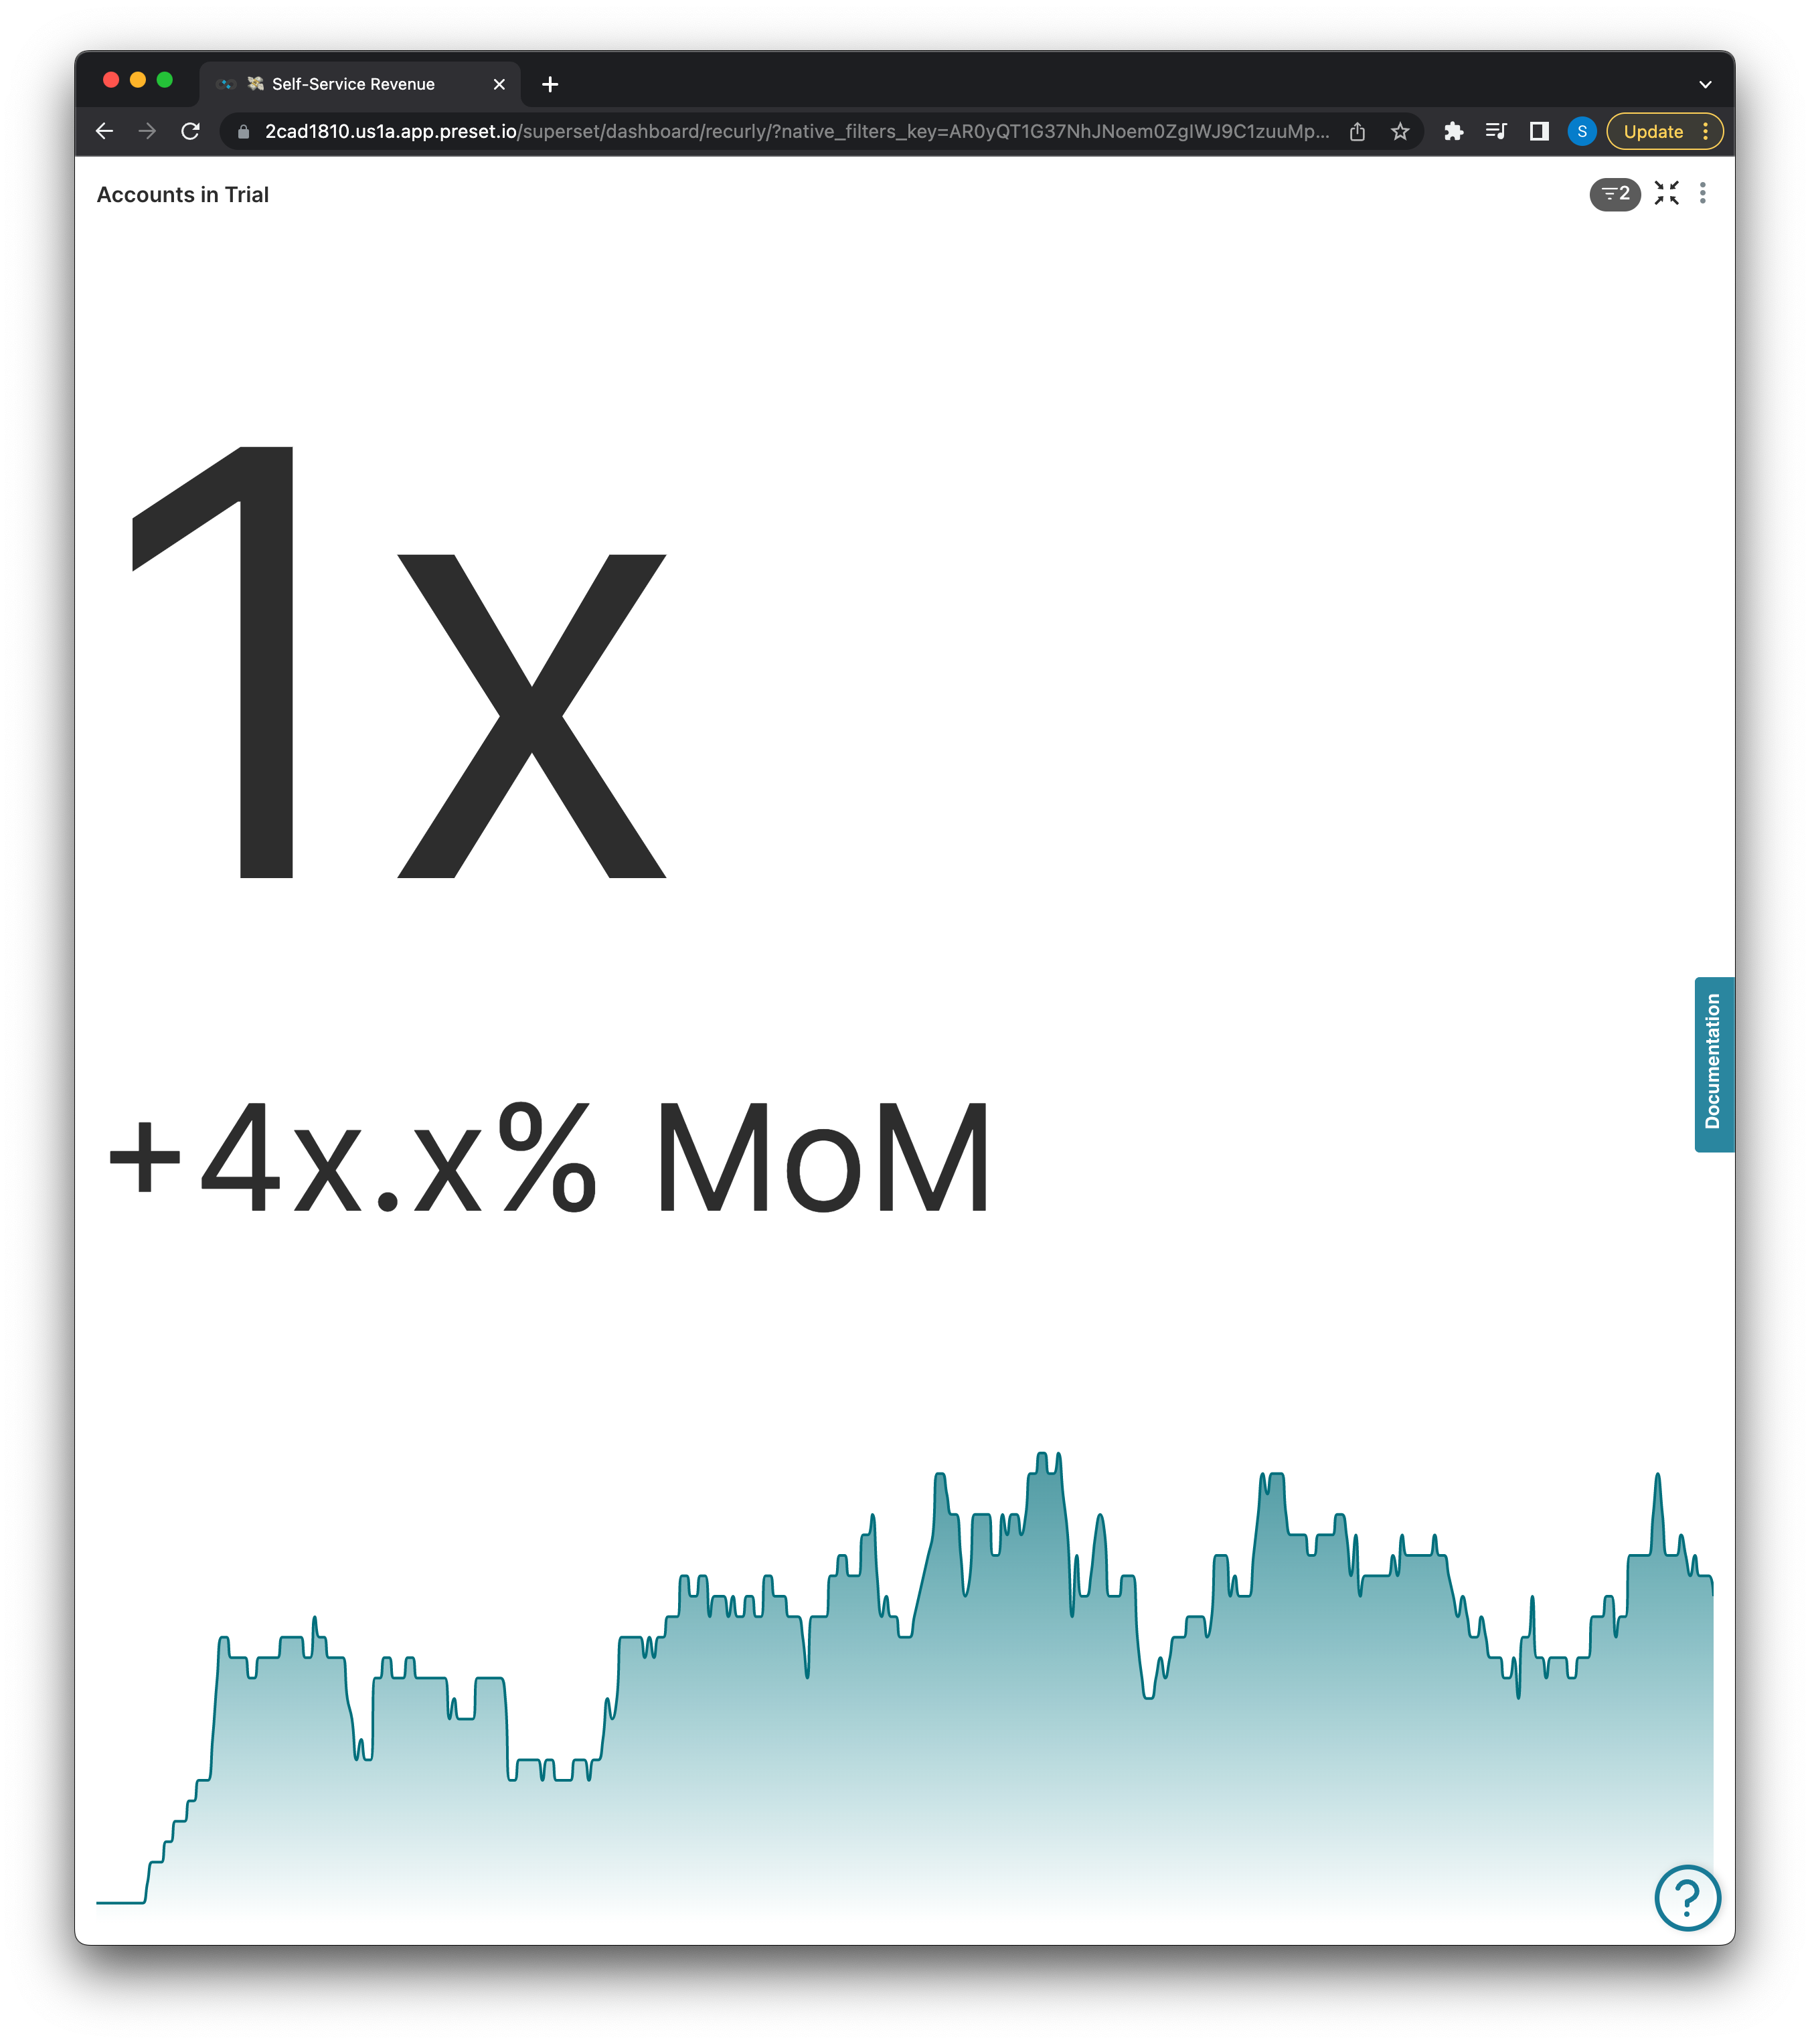
LIMIT 5000Accounts in Trial
Total number of accounts in a trial status with the month over month increase below.
SELECT DATE_TRUNC(`dt`, DAY) AS `__timestamp`,
       COUNT(*) AS `count`
FROM `core_recurly`.`account_subscription_history`
WHERE `upgrade_status` IN ('standard')
  AND `is_preset` IN ('FALSE')
  AND `is_expired` IN (false)
  AND `trial_status` IN ('trial')
GROUP BY `__timestamp`
LIMIT 5000
ARR By Upgrade Status
ARR comparison of our standard vs. upgraded accounts.
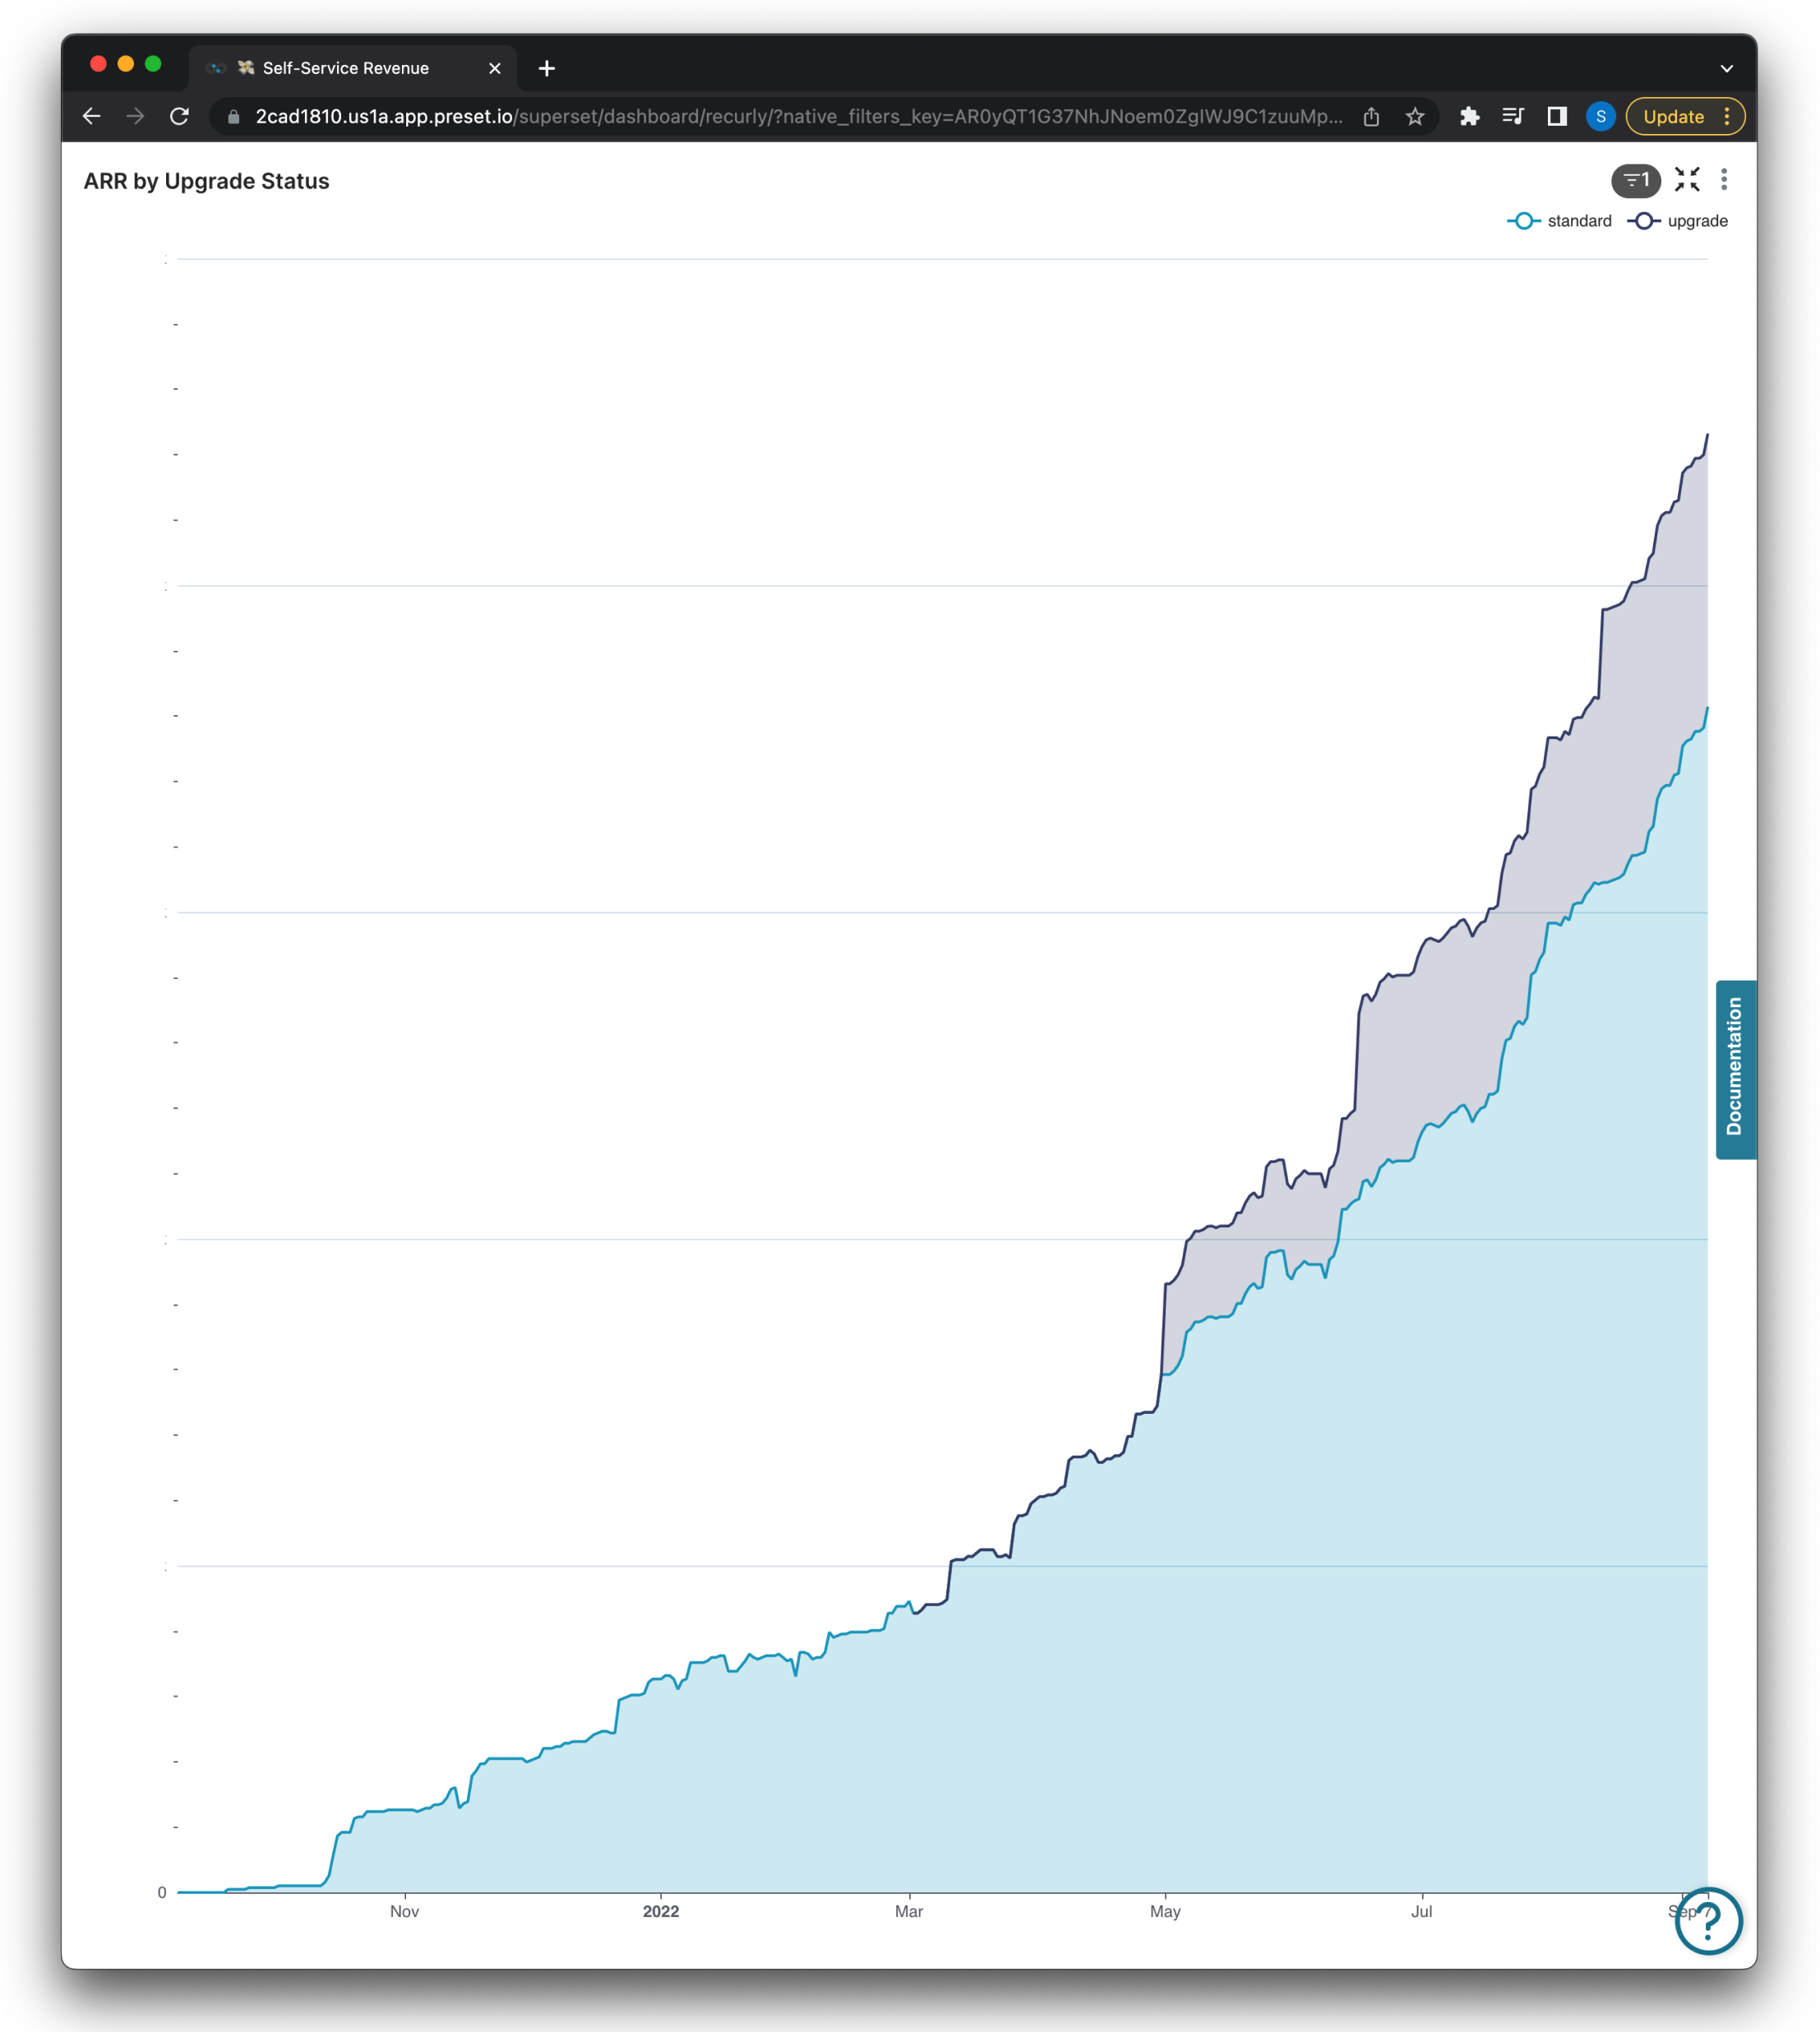
Y-Axis dollar amounts have been hidden above
SELECT DATE_TRUNC(`dt`, DAY) AS `dt`,
       `upgrade_status` AS `upgrade_status`,
       SUM(arr_paying) AS `arr_paying`
FROM `core_recurly`.`account_subscription_history`
WHERE `is_preset` IN ('FALSE')
GROUP BY `dt`,
         `upgrade_status`
ORDER BY arr_paying DESC
LIMIT 10000
ARR + 28D and ARR + 84D variations
Both of these metrics look at current ARR with the X days ago variation added to it, the only changes in the query will be the columns used to obtain the metrics.
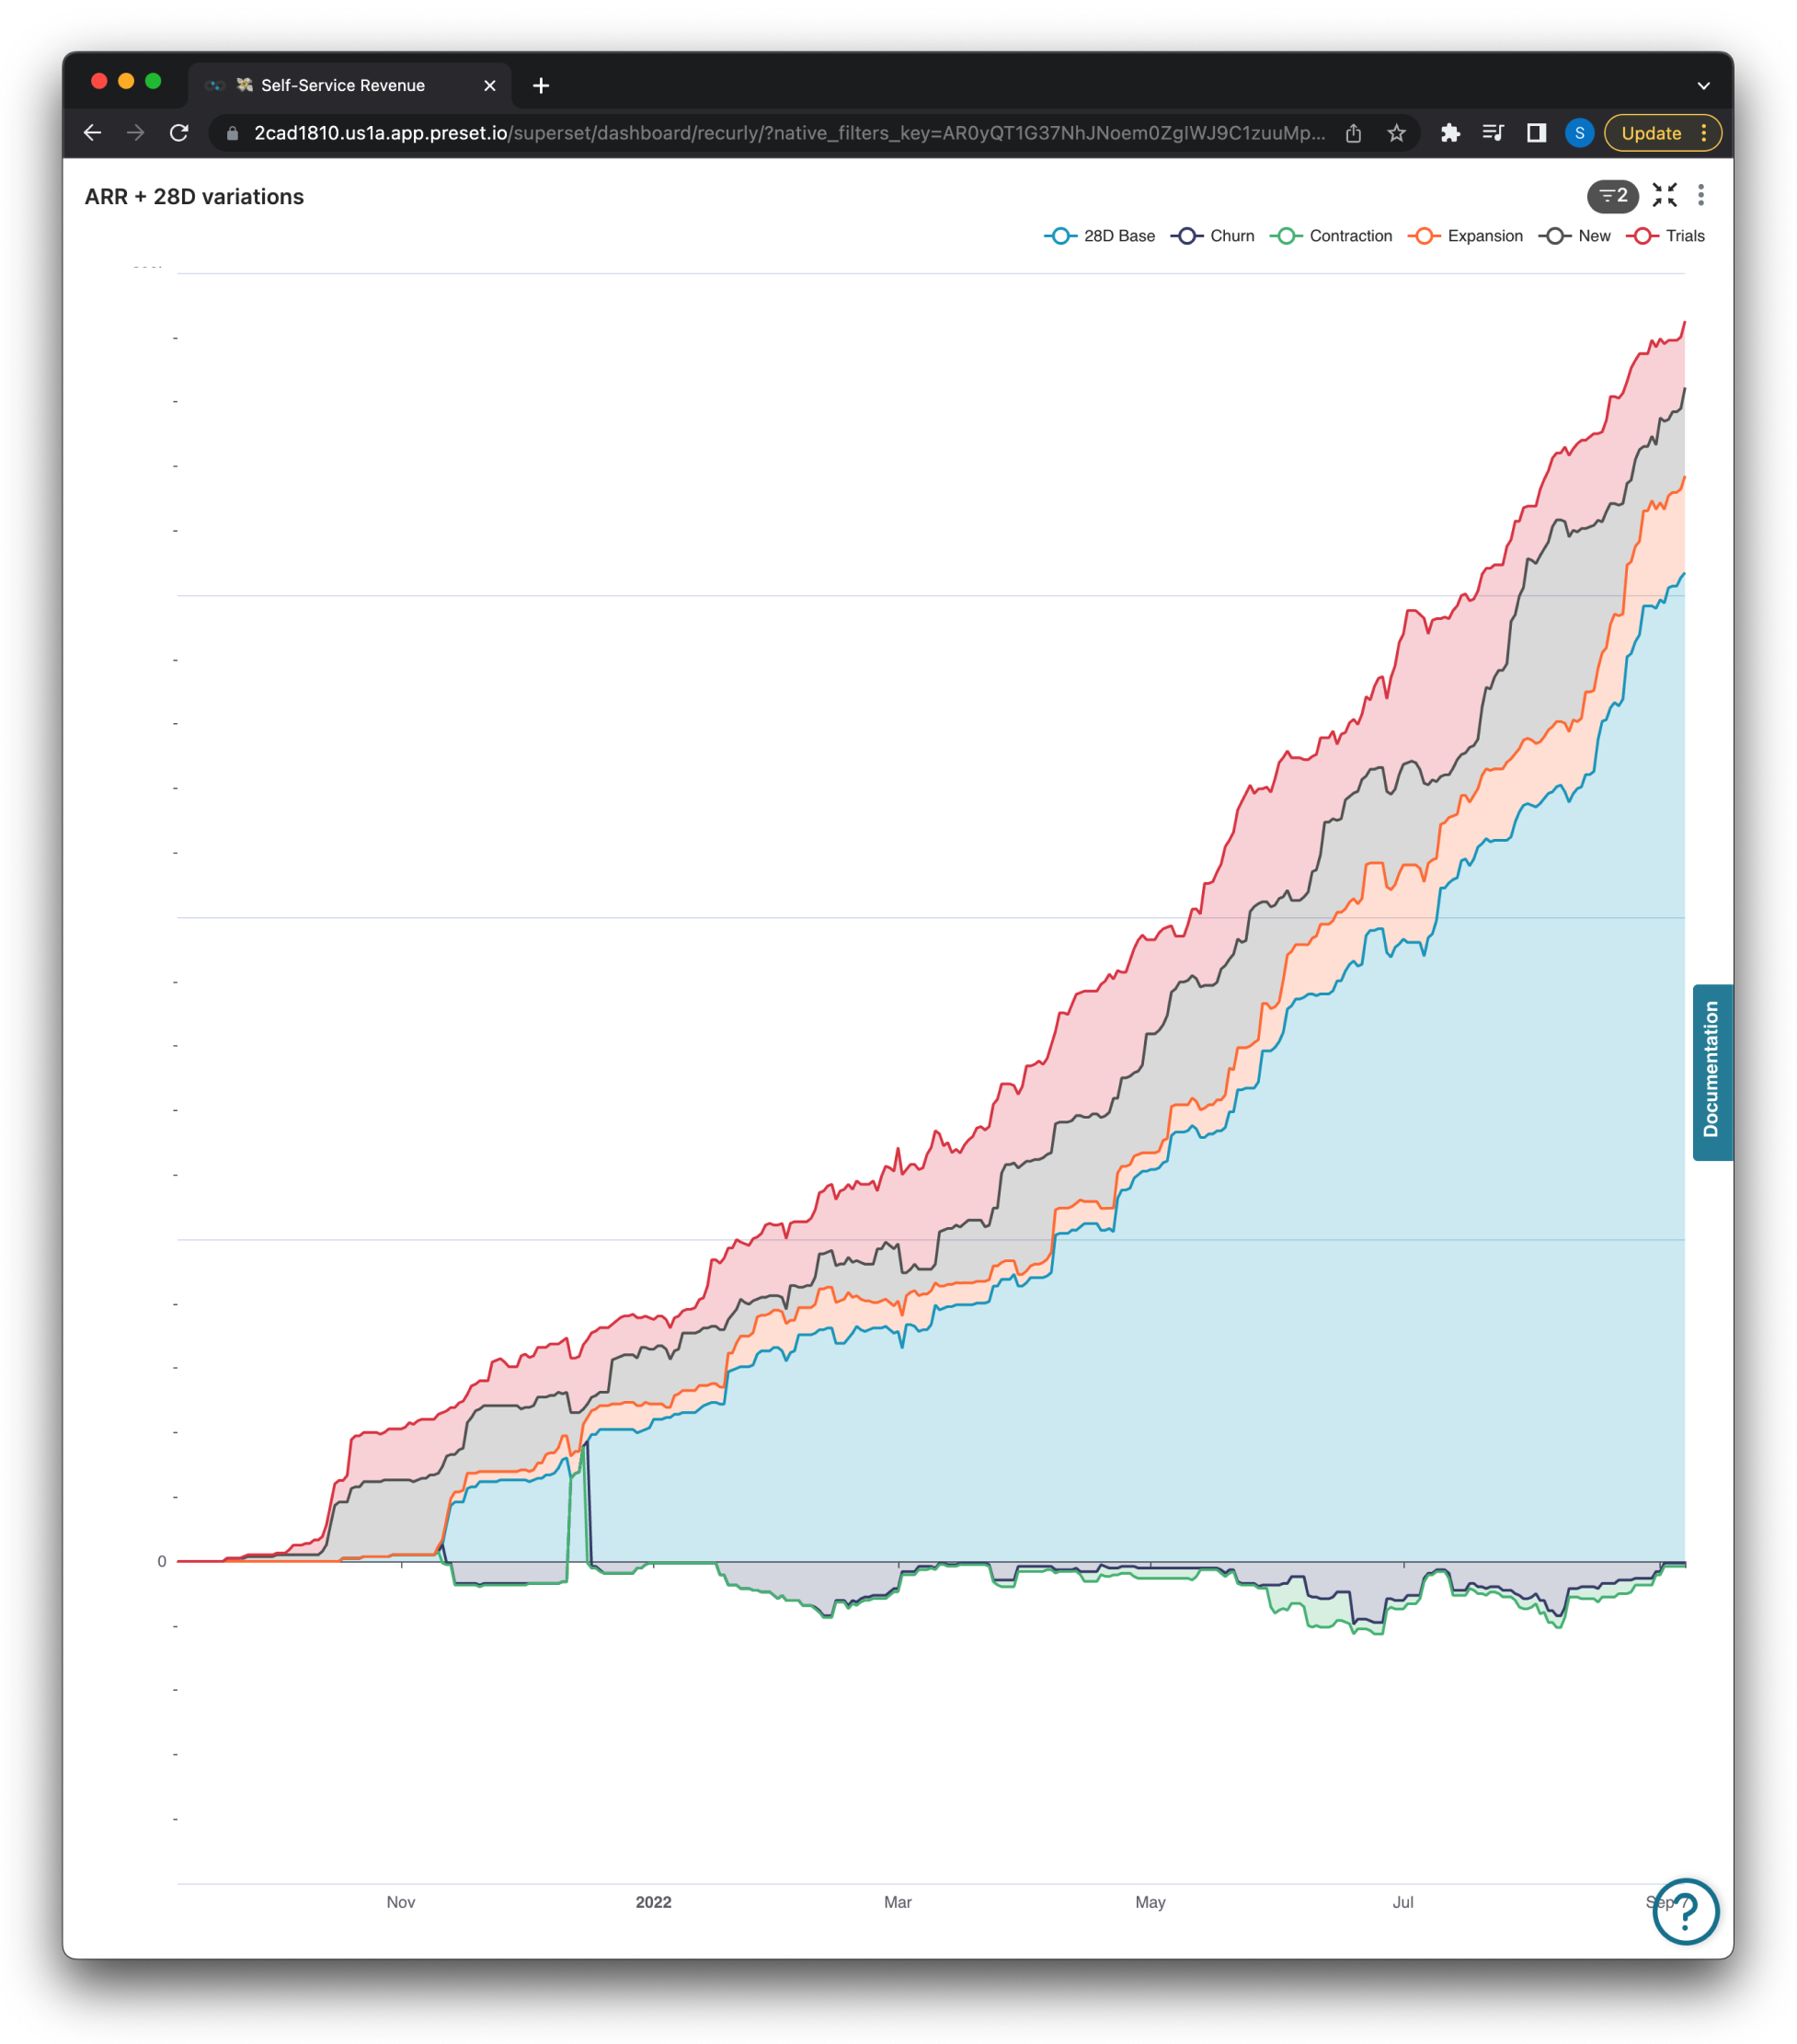
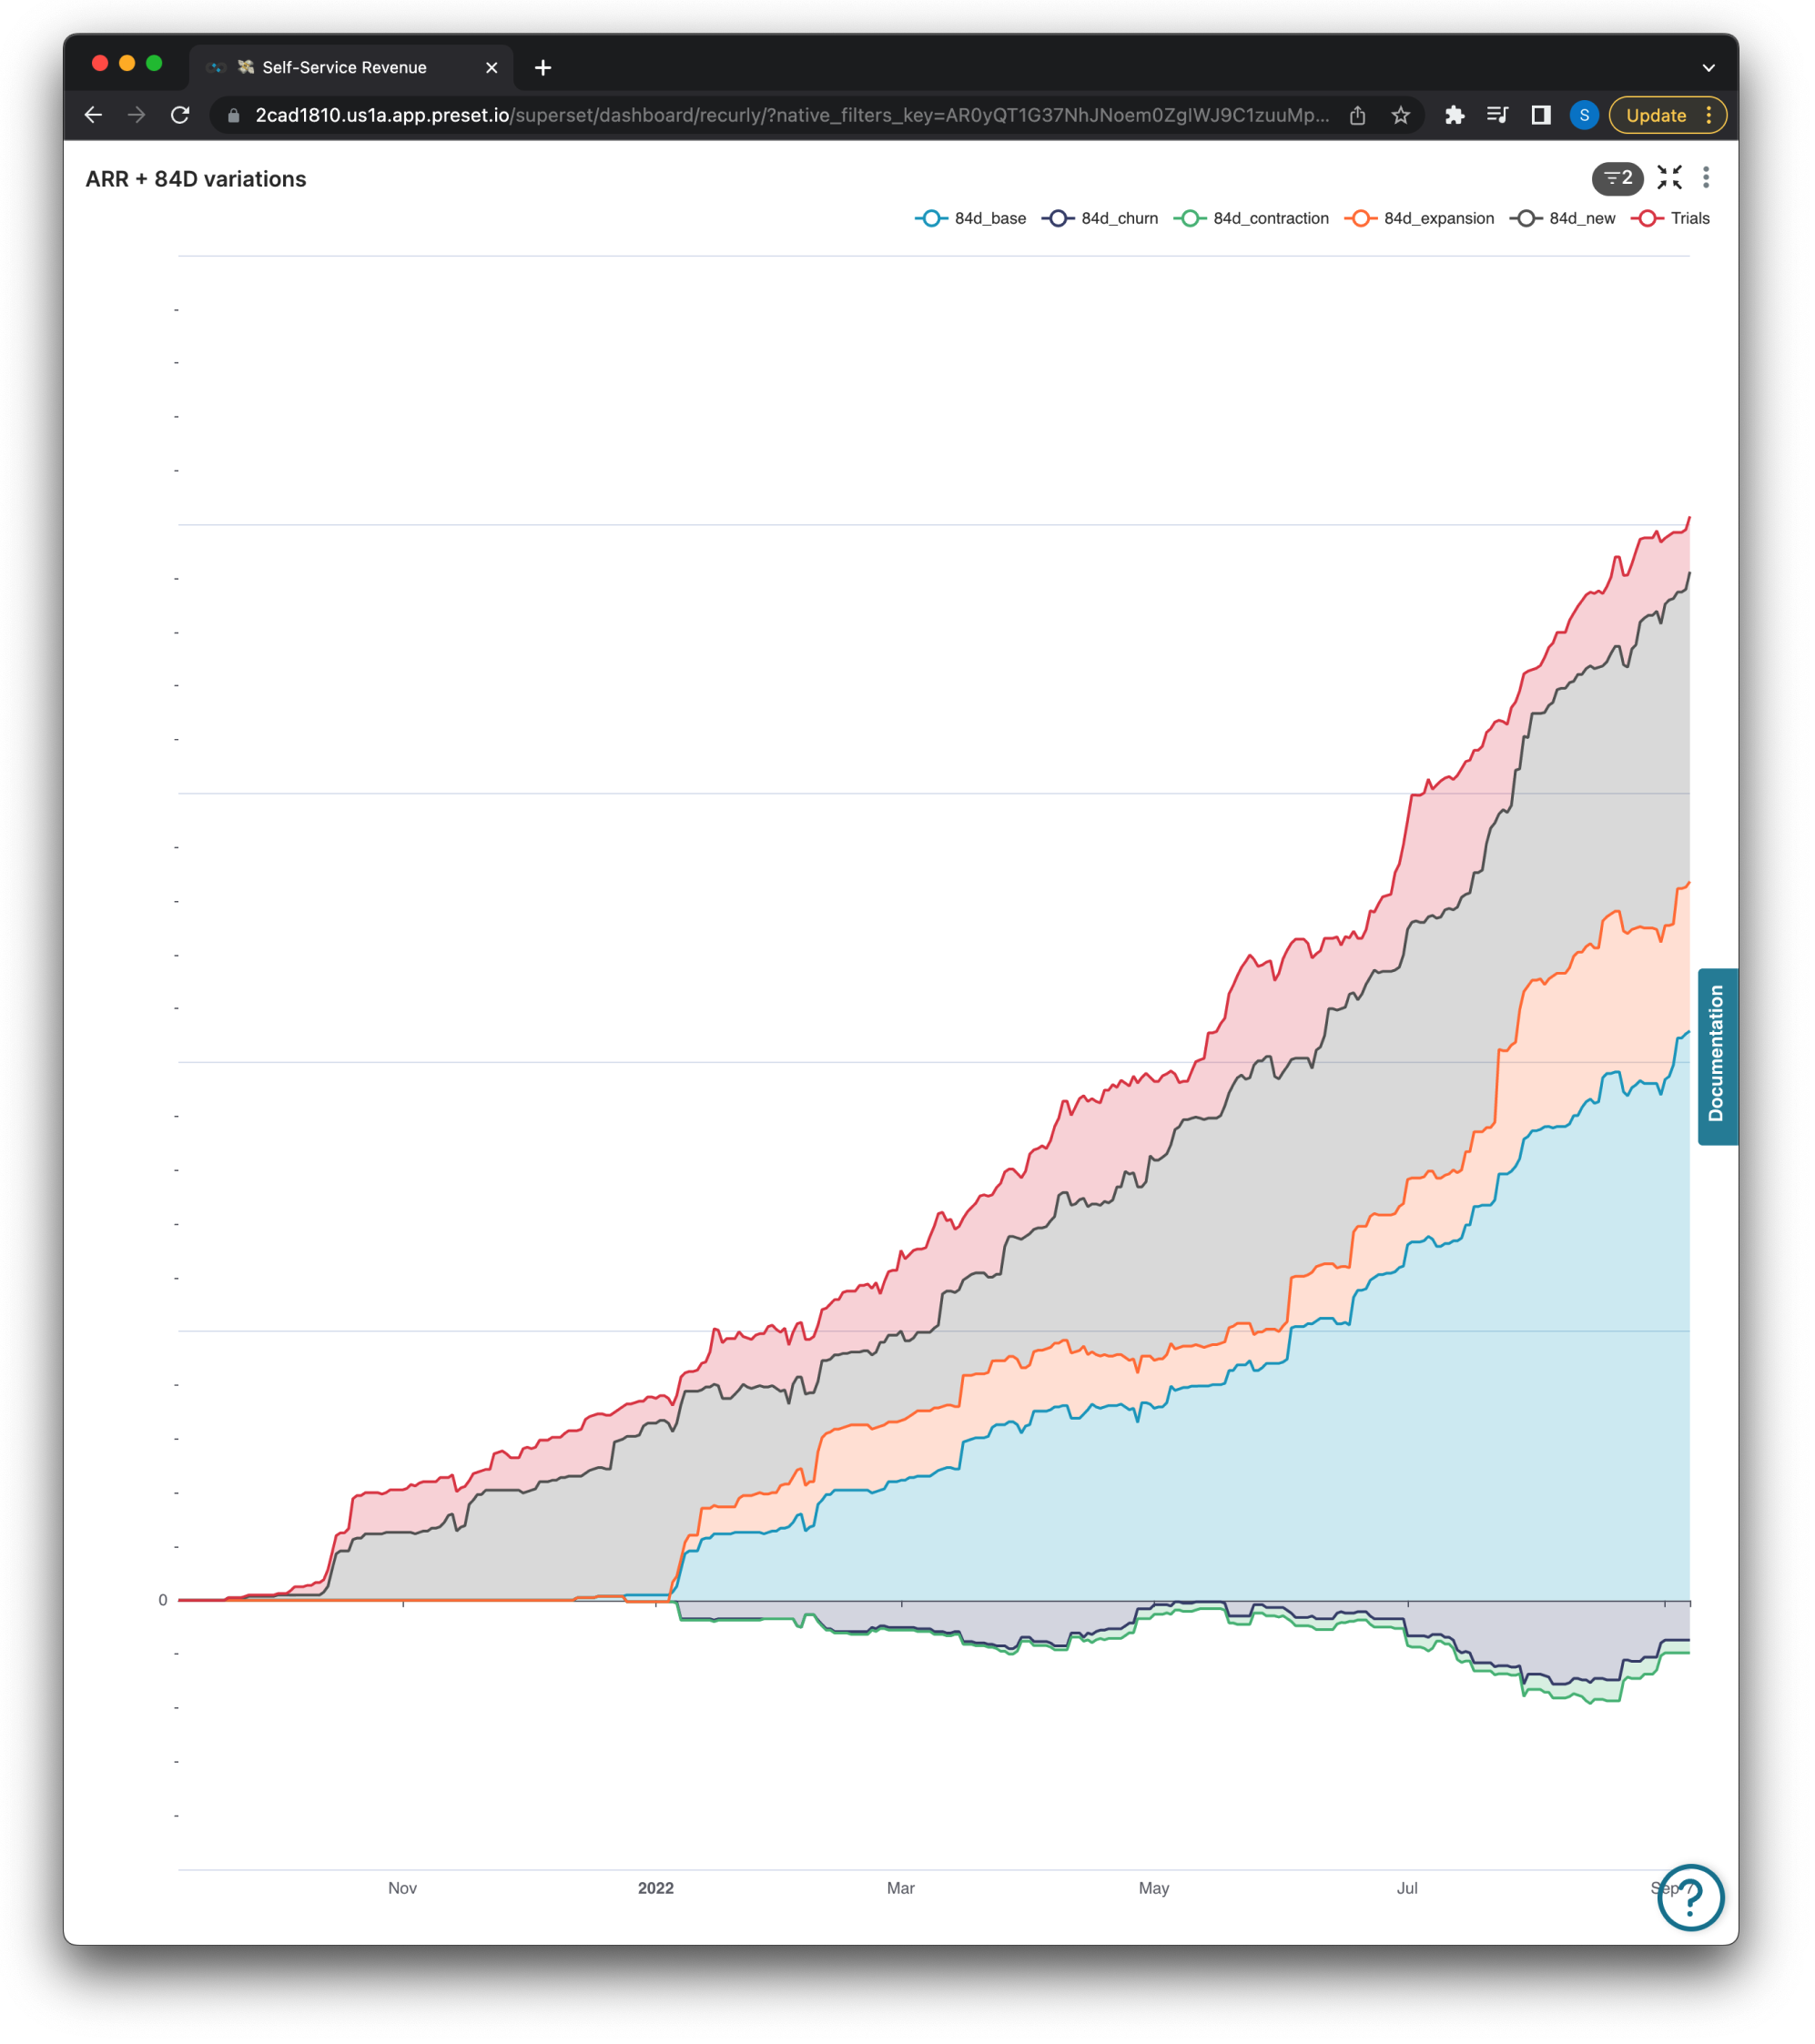
Y-Axis dollar amounts have been hidden above
/* ARR + 28D */
SELECT DATE_TRUNC(`dt`, DAY) AS `dt`,
SUM(arr_trial) AS `trial`,
SUM(arr_28d_contraction) AS `contraction`,
SUM(arr_28d_churn) AS `churn`,
SUM(arr_28d_ago) AS `base`,
SUM(arr_28d_expansion) AS `expansion`,
SUM(arr_28d_new) AS `new_28d`
FROM `core_recurly`.`account_subscription_history`
WHERE `upgrade_status` IN ('standard')
AND `is_preset` IN ('FALSE')
GROUP BY `dt`
ORDER BY trial DESC
LIMIT 10000
/* ARR + 84D */
SELECT DATE_TRUNC(`dt`, DAY) AS `dt`,
SUM(arr_trial) AS `trial`,
SUM(arr_84d_ago) AS `_84d_base_7a66e`,
SUM(arr_84d_churn) AS `_84d_churn_8c2a9`,
SUM(arr_84d_contraction) AS `_84d_contraction_e8b53`,
SUM(arr_84d_expansion) AS `_84d_expansion_fe759`,
SUM(arr_84d_new) AS `_84d_new_c169a`
FROM `core_recurly`.`account_subscription_history`
WHERE `upgrade_status` IN ('standard')
AND `is_preset` IN ('FALSE')
GROUP BY `dt`
ORDER BY trial DESC
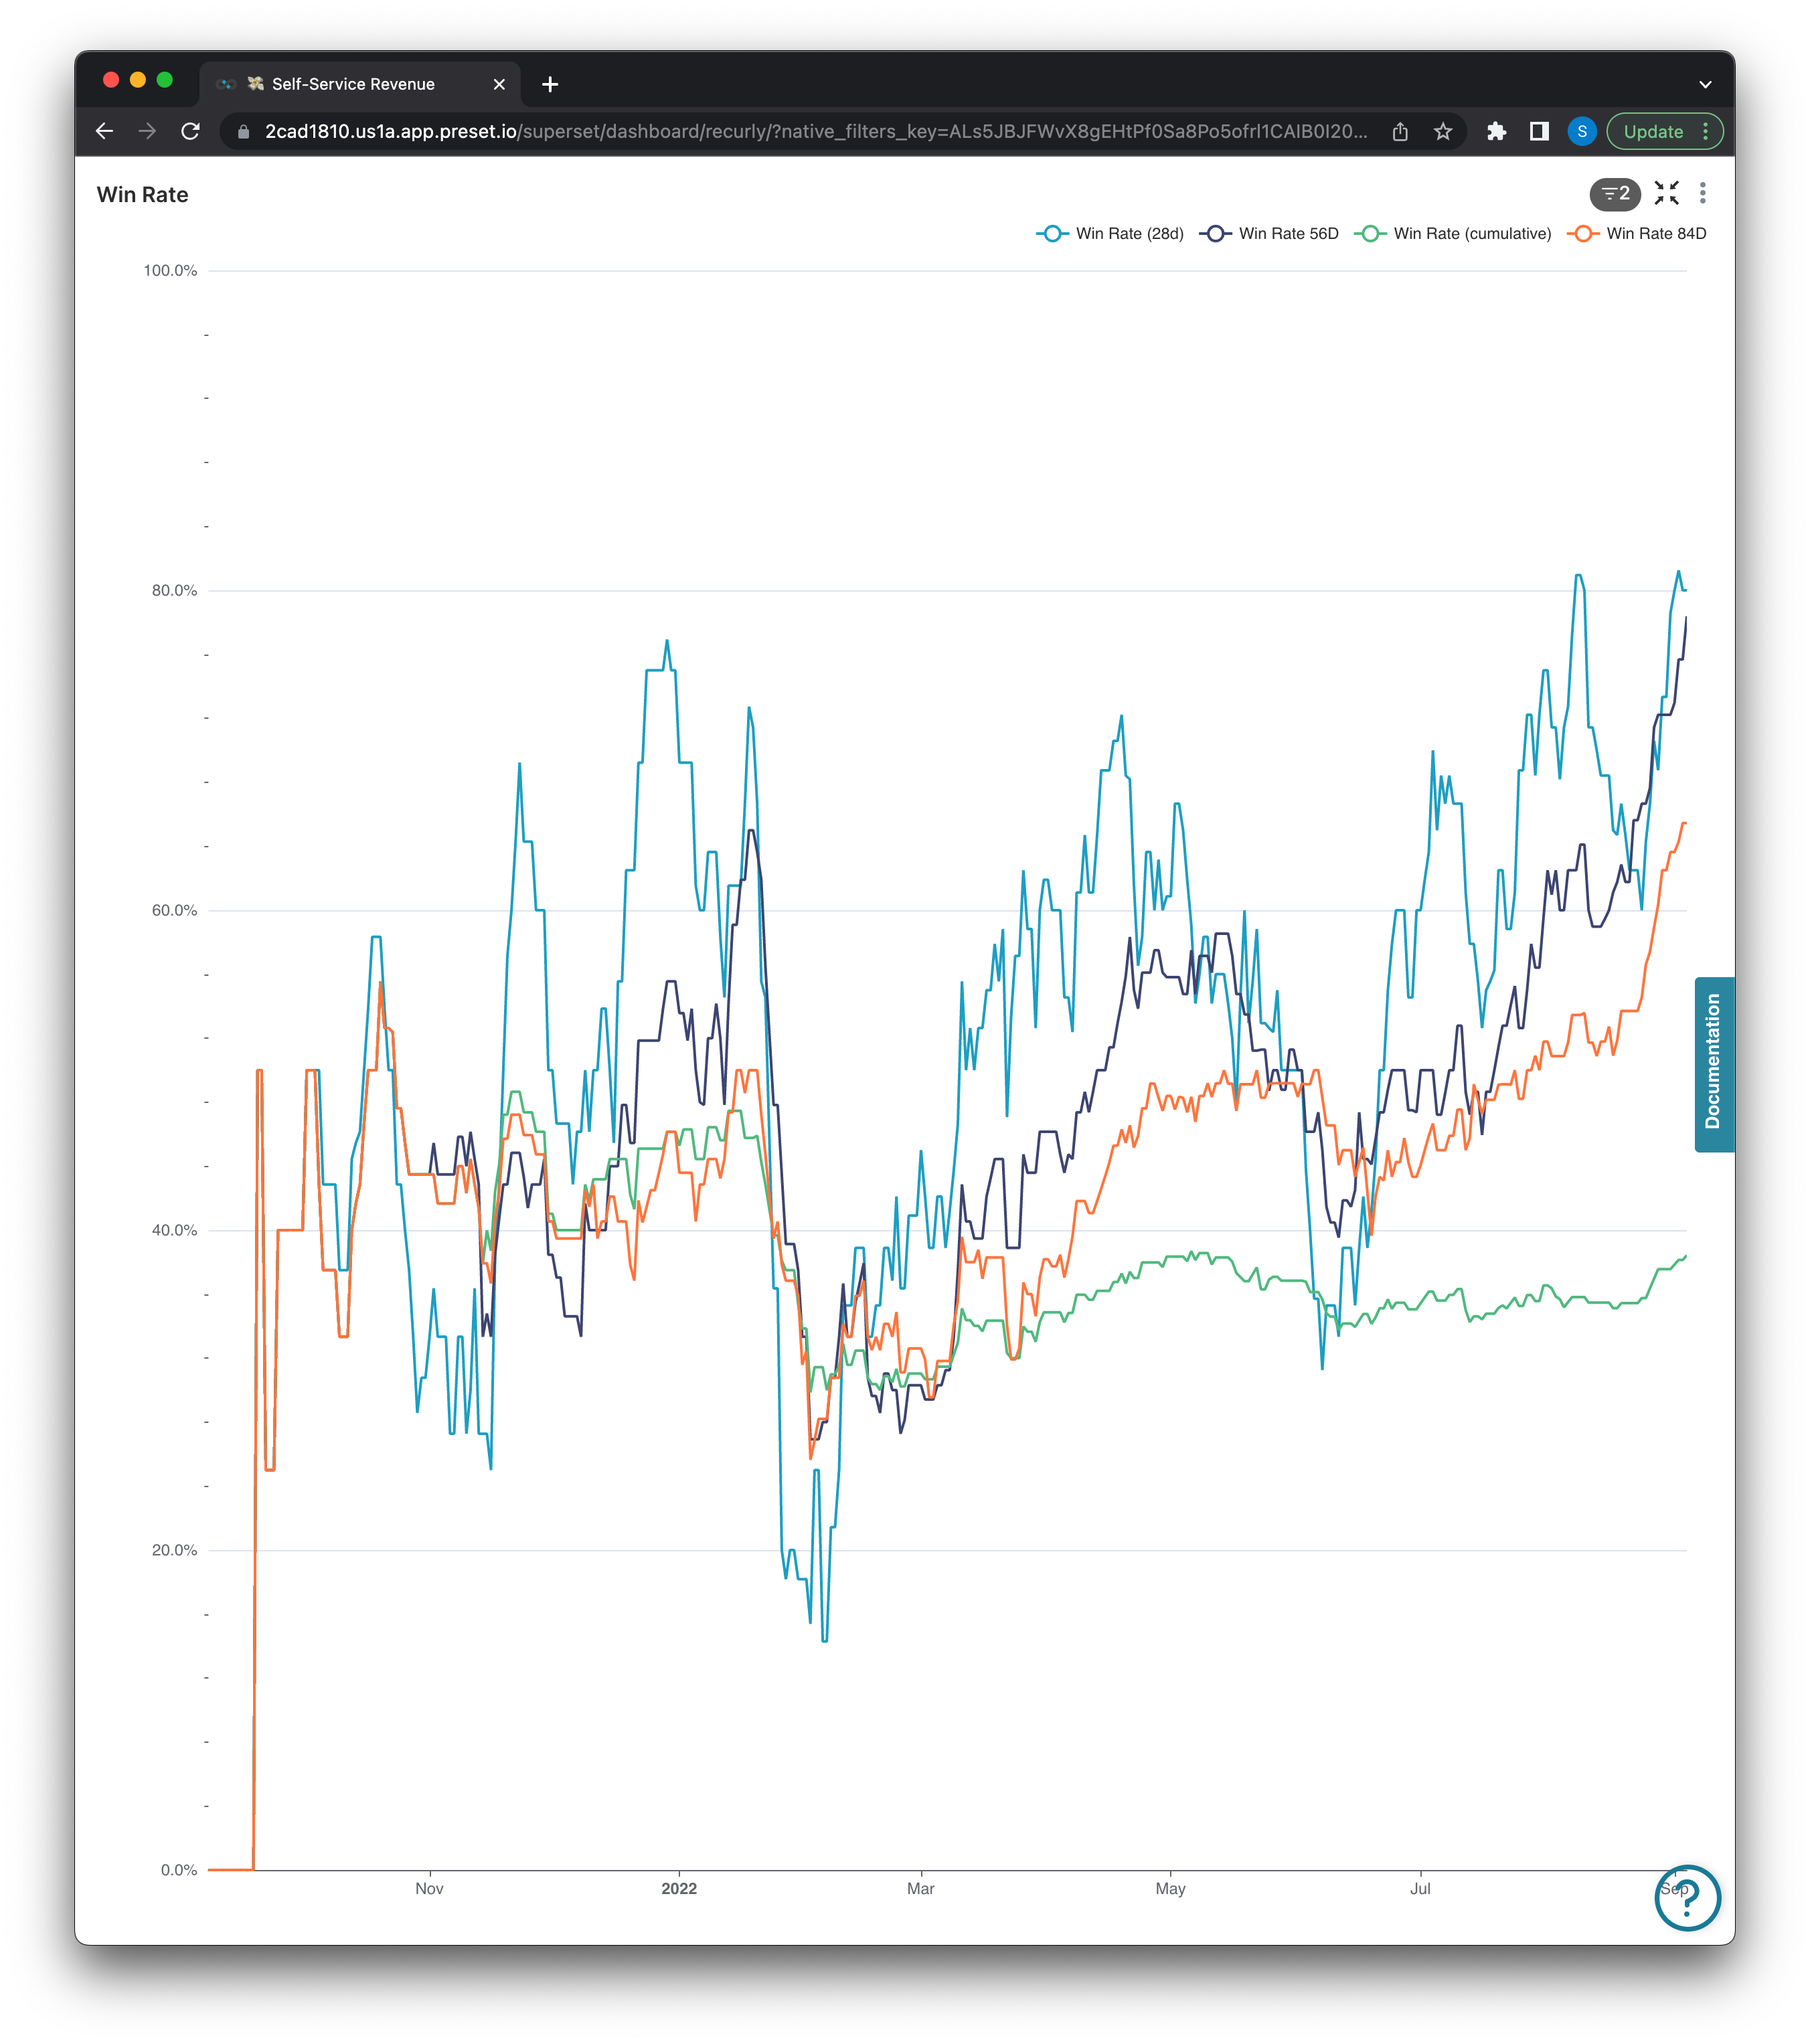
LIMIT 10000Win Rate
Win rate by count is the ratio of deals won to the number of total closed opportunities. Here we’re visualizing Preset’s win rate on different X day ago variations as well as the total cumulative win rate for comparison.
SELECT DATE_TRUNC(`dt`, DAY) AS `dt`,
CASE
WHEN (SUM(lost_deals)+SUM(won_deals)) > 0 THEN SUM(won_deals) / (SUM(lost_deals)+SUM(won_deals))
END AS `win_rate`,
CASE
WHEN (SUM(lost_28d_deals)+SUM(won_28d_deals)) > 0 THEN SUM(won_28d_deals) / (SUM(lost_28d_deals)+SUM(won_28d_deals))
END AS `_28d_win_rate_1af4c`,
CASE
WHEN (SUM(lost_84d_deals)+SUM(won_84d_deals)) > 0 THEN SUM(won_84d_deals) / (SUM(lost_84d_deals)+SUM(won_84d_deals))
END AS `win_rate_84d`,
CASE
WHEN (SUM(lost_56d_deals)+SUM(won_56d_deals)) > 0 THEN SUM(won_56d_deals) / (SUM(lost_56d_deals)+SUM(won_56d_deals))
END AS `Win_Rate_56D_760a8`
FROM `core_recurly`.`account_subscription_history`
WHERE `upgrade_status` IN ('standard')
AND `is_preset` IN ('FALSE')
GROUP BY `dt`
ORDER BY win_rate DESC
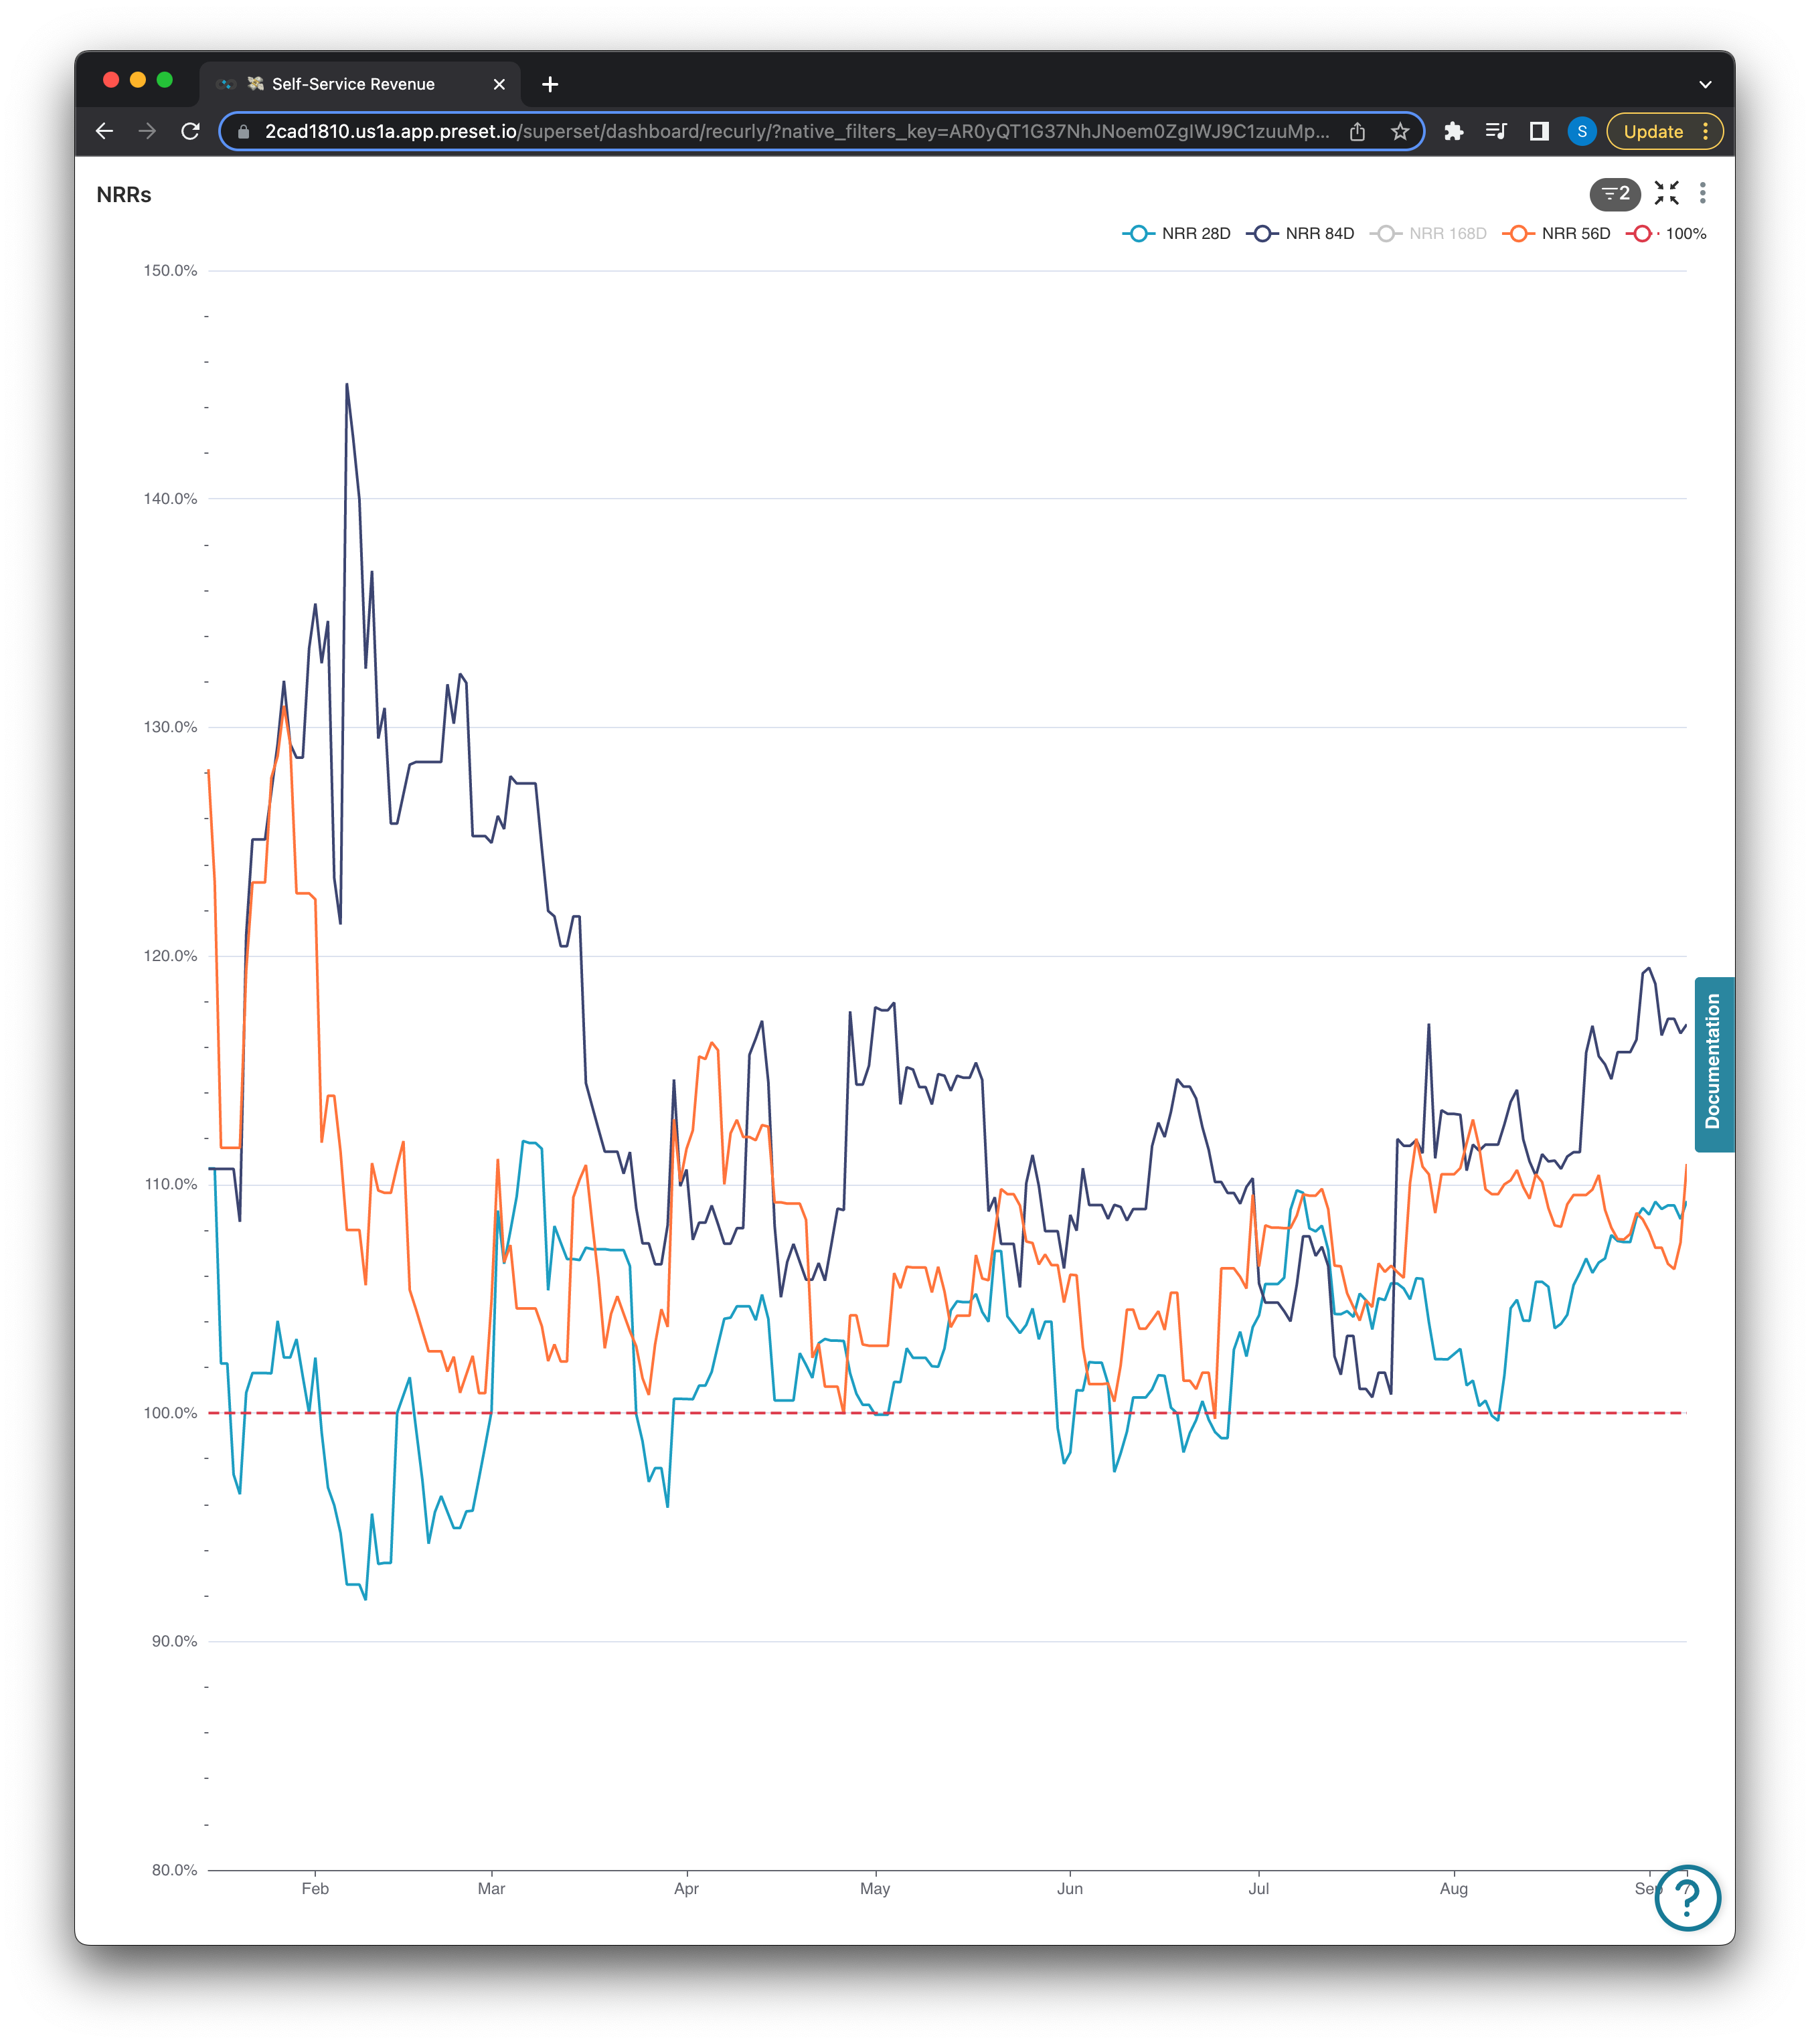
LIMIT 10000NRRs
Net Revenue Retention (NRR) is the percentage of recurring revenue retained from existing customers over a given time period (usually monthly or annually). It takes into account income from upgrades, cross-sales, downgrades, and cancellations.
SELECT DATE_TRUNC(`dt`, DAY) AS `dt`,
       CASE
           WHEN SUM(arr_28d_ago)>0 THEN (SUM(arr_28d_ago) + SUM(nrr_change_28d_for_arr)) / SUM(arr_28d_ago)
           ELSE 0
       END AS `_28d_nrr_50c2e`,
       CASE
           WHEN SUM(arr_84d_ago)>0 THEN (SUM(arr_84d_ago) + SUM(nrr_change_84d_for_arr)) / SUM(arr_84d_ago)
           ELSE 0
       END AS `_84d_nrr_1b75c`,
       CASE
           WHEN SUM(arr_56d_ago)>0 THEN (SUM(arr_56d_ago) + SUM(nrr_change_56d_for_arr)) / SUM(arr_56d_ago)
           ELSE 0
       END AS `nrr_56d`,
       CASE
           WHEN SUM(arr_168d_ago)>0 THEN (SUM(arr_168d_ago) + SUM(nrr_change_168d_for_arr)) / SUM(arr_168d_ago)
           ELSE 0
       END AS `nrr_168d`
FROM `core_recurly`.`account_subscription_history`
WHERE `dt` >= CAST('2022-01-15' AS DATE)
  AND `dt` < CAST('2022-09-06' AS DATE)
  AND `upgrade_status` IN ('standard')
  AND `is_preset` IN ('FALSE')
GROUP BY `dt`
ORDER BY _28d_nrr_50c2e DESC
LIMIT 10000
Additional Self-Service Metrics
From above we can see the bulk of the self-service revenue metrics we track come from our derived account subscription history dataset. We can go further and derive an account_subscription_latest dataset (in a similar fashion to how the *_latest datasets were created above) to visualize a couple of more metrics:
{{ config(materialized="table") }}
SELECT *
FROM {{ ref('account_subscription_history') }}
WHERE dt = DATE('{{ latest_dt(ref('account_subscription_history'), "dt", previous_day=False) }}')
With this dataset we can now visualize the metrics below!
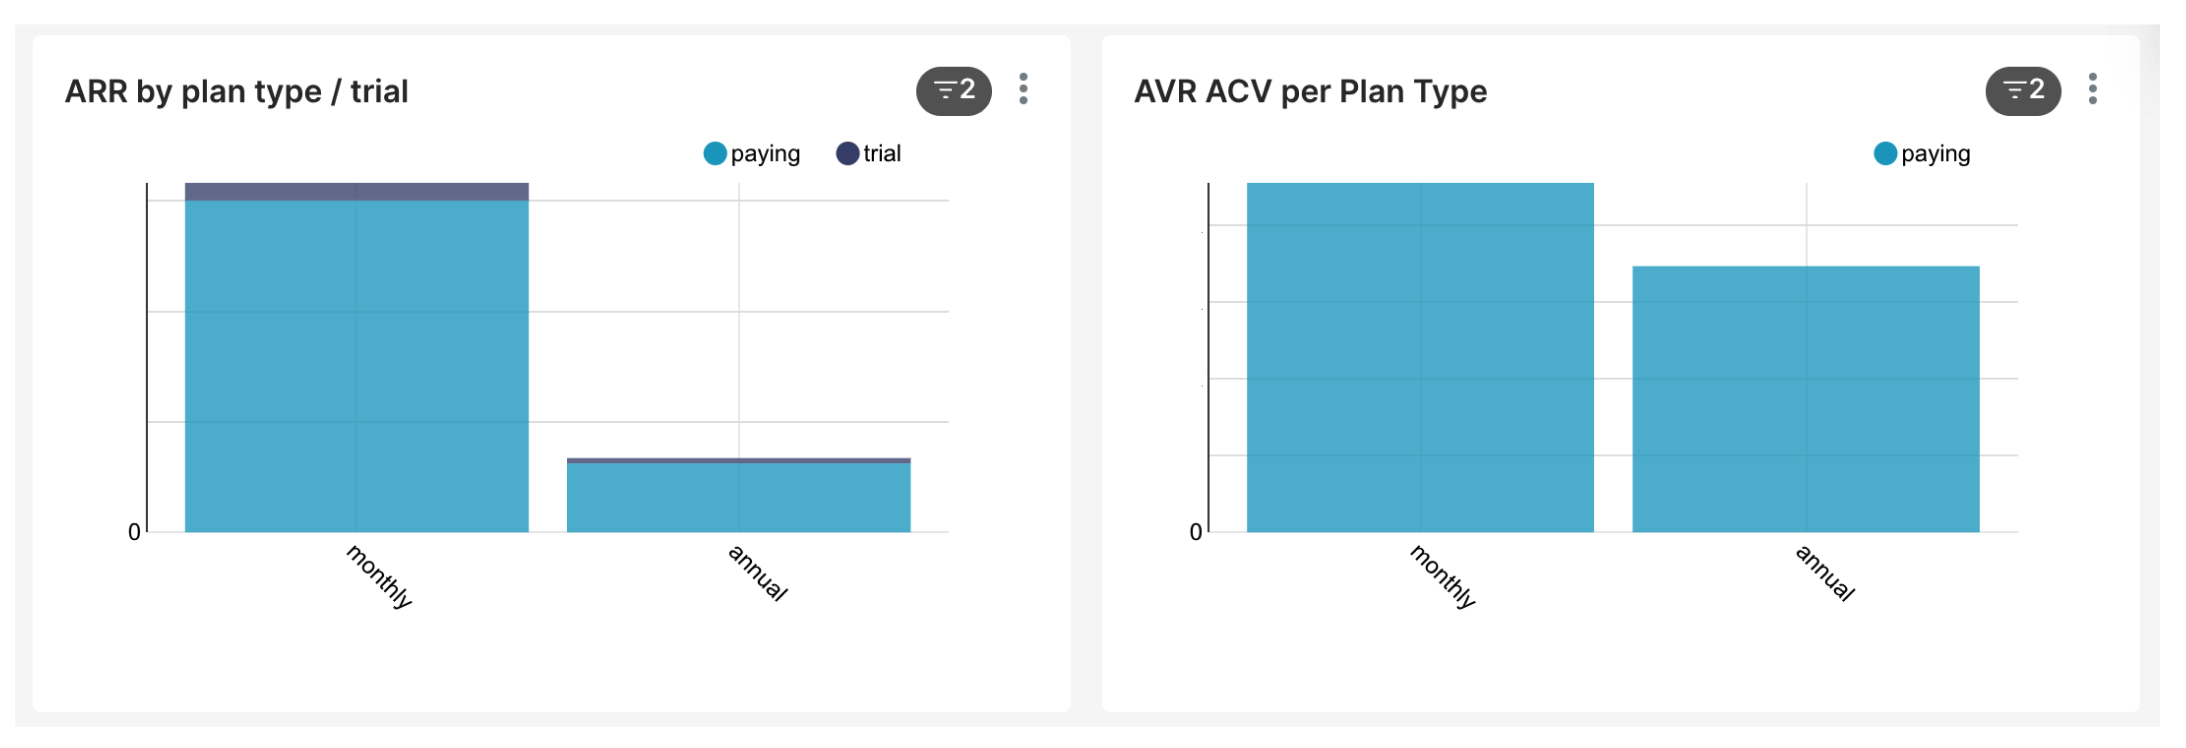
Y-Axis dollar amounts on ARR by plan type has been covered.
Y-Axis dollar amount being paid — AVR (asset valuation review) ACV (average customer value) per plan type has been covered.
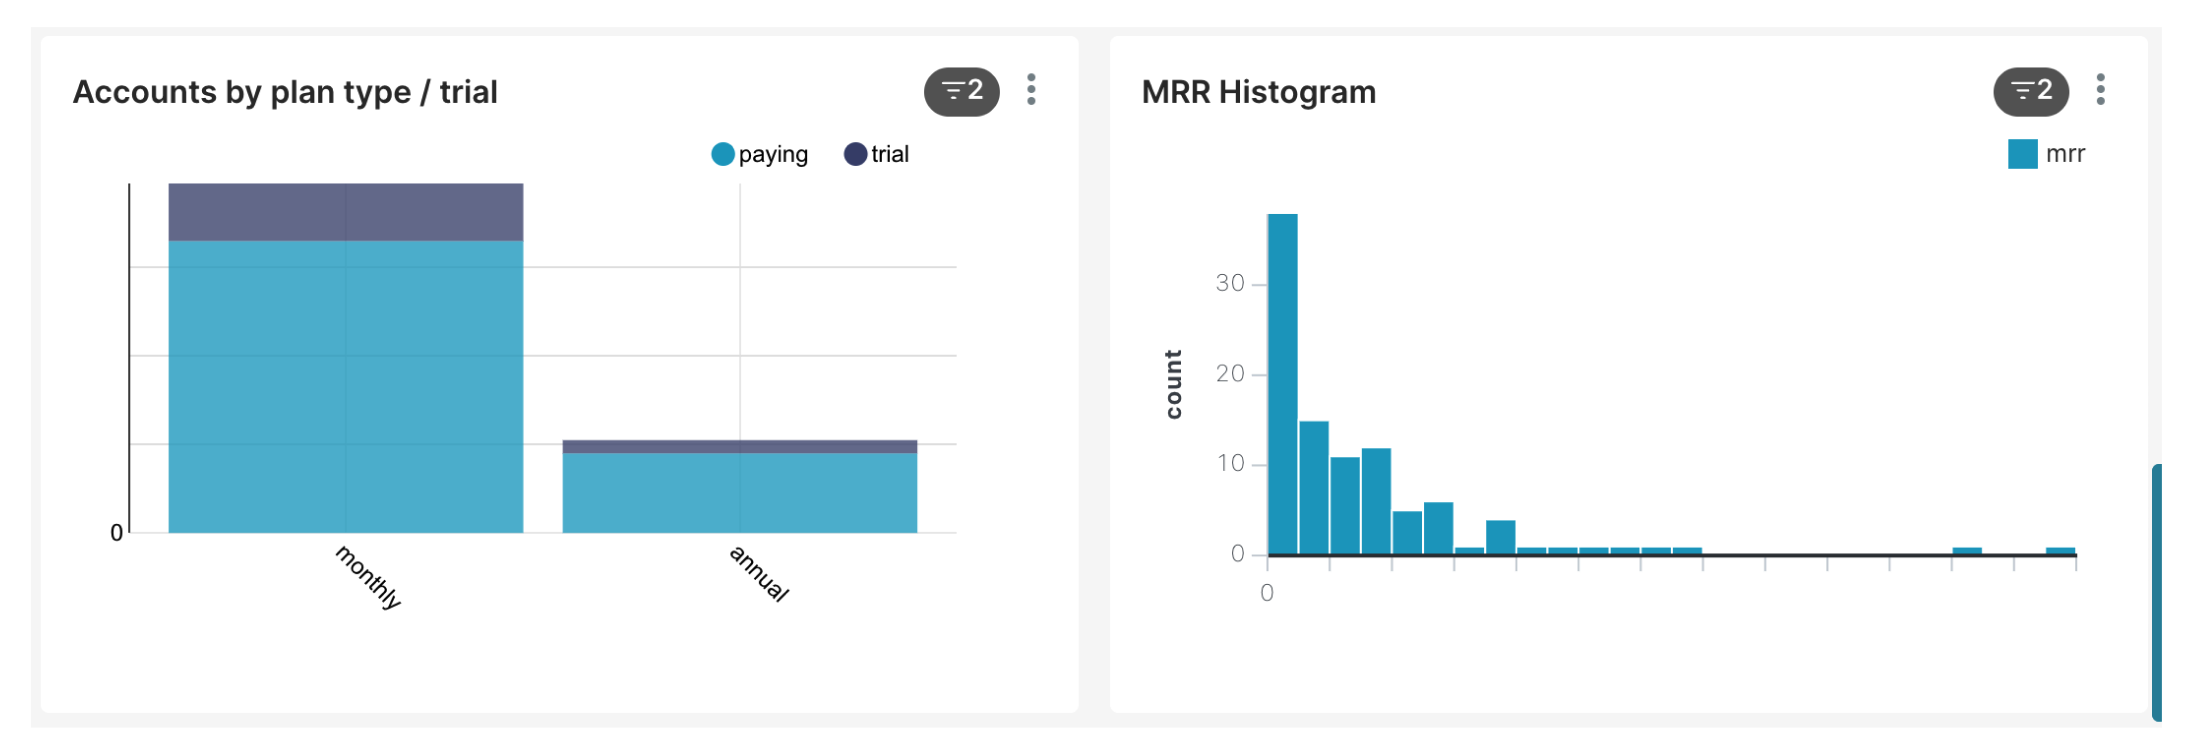
Y-Axis showing counts of Account by Plan Type/Trial has been covered.
X-Axis showing spend per standard account has been covered.
ARR by Plan Type/Trial
SELECT CASE
           WHEN LOWER(plan_name) LIKE '%monthly%' THEN 'monthly'
           WHEN LOWER(plan_name) LIKE '%annual%' THEN 'annual'
           ELSE plan_name
       END AS `short_plan_name`,
       `trial_status` AS `trial_status`,
       SUM(arr) AS `arr`
FROM `core_recurly`.`account_subscription_latest`
WHERE `is_expired` IN (false)
  AND `upgrade_status` IN ('standard')
  AND `is_preset` IN ('FALSE')
GROUP BY `short_plan_name`,
         `trial_status`
ORDER BY arr DESC
LIMIT 10000
AVR ACV per Plan Type
AVR/ACV tells us how much is the average customer spending on it
SELECT CASE
           WHEN LOWER(plan_name) LIKE '%monthly%' THEN 'monthly'
           WHEN LOWER(plan_name) LIKE '%annual%' THEN 'annual'
           ELSE plan_name
       END AS `short_plan_name`,
       `trial_status` AS `trial_status`,
       SUM(arr) / COUNT(1) AS `AVR_AGG_3b53f`
FROM `core_recurly`.`account_subscription_latest`
WHERE `trial_status` IN ('paying')
  AND `upgrade_status` IN ('standard')
  AND `is_preset` IN ('FALSE')
GROUP BY `short_plan_name`,
         `trial_status`
ORDER BY AVR_AGG_3b53f DESC
LIMIT 10000
Accounts by Plan Type/Trial
SELECT CASE
           WHEN LOWER(plan_name) LIKE '%monthly%' THEN 'monthly'
           WHEN LOWER(plan_name) LIKE '%annual%' THEN 'annual'
           ELSE plan_name
       END AS `short_plan_name`,
       `trial_status` AS `trial_status`,
       COUNT(*) AS `count`
FROM `core_recurly`.`account_subscription_latest`
WHERE `is_expired` IN (false)
  AND `upgrade_status` IN ('standard')
  AND `is_preset` IN ('FALSE')
GROUP BY `short_plan_name`,
         `trial_status`
ORDER BY count DESC
LIMIT 10000
MRR Histogram
SELECT `mrr` AS `mrr`
FROM `core_recurly`.`account_subscription_latest`
WHERE `is_expired` IN (false)
  AND `upgrade_status` IN ('standard')
  AND `is_preset` IN ('FALSE')
LIMIT 10000
Using only three (of many) raw data models Preset is able to visualize a wide array of various metrics to monitor its revenue growth over time. I hope this can provide some real world context as to what is possible using these specific tools!
