


The Case for Dataset-Centric Visualization


Different BI tools offer different approaches to building dashboards. On one end of the spectrum, you have tools that prescribe having one query per chart and on the other end you have tools that espouse implementing a complex semantic layer. I believe there's a middle path that lies between both extremes, and I call it the dataset-centric approach.
In the dataset-centric approach, the tool is connected to individual datasets that are expected to contain all of the metrics and dimensions for a given subject area.
In this post, I'll describe the strengths and tradeoffs for each of the approaches and make the case for the dataset-centric approach as the ideal one for fast-moving data teams.
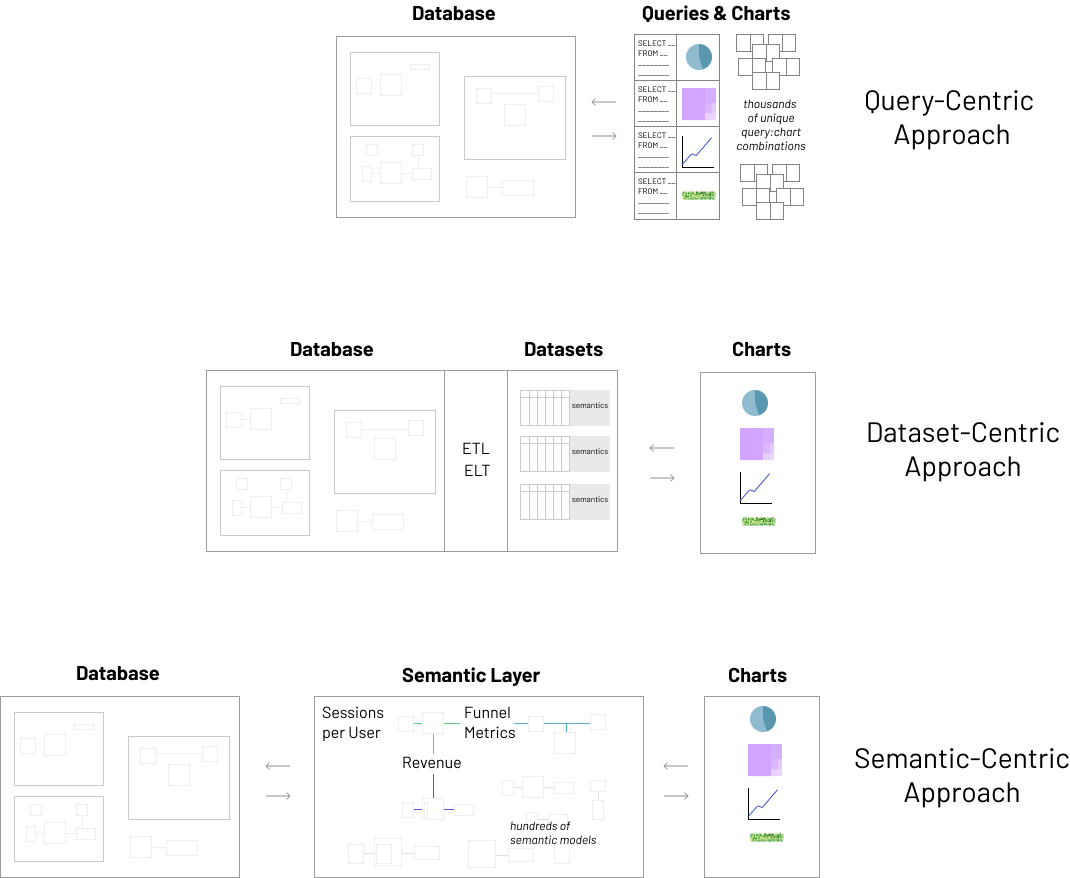
Query-Centric Visualization

This approach is intuitive for folks who are comfortable with SQL or SQL-generating workflows (aka query builders). This approach lets you have an arbitrarily complex data model and lets you unleash the SQL wizards in your organization. These SQL oriented team members will need to navigate the schema complexity (often through tribal knowledge) and craft the collection of joins and unions needed to shape the data precisely for the visualization they're creating.
This approach requires the most technical skills and the most knowledge of the schemas, but is by far the most flexible. With enough time and energy, you can prep the data for any chart you need to create, even if the data schema is incredibly intricate and complex.
Here are the challenges for this approach:
- Little re-use of logic: most of the "business logic" and semantics around labels, joins, unions, and metric definitions often live inside the chart itself as the query is associated tightly with the chart. Typical compensatory workflows involve team members cloning an existing chart, duplicating the logic, and altering the now derived logic and semantics themselves. Over time, this leads to an overgrowth of duplicated and inconsistent business logic that lives outside of source control.
- difficult change management: logic duplication and raw complexity makes it difficult to make atomic changes. This leads to a lot of broken dashboards when analytical needs and schemas evolve and starts to foster a culture of resistance to and resentment around schema changes.
- difficult dashboard filtering: after writing queries and arranging charts and arranging the charts in a dashboard, the usual next step is to create filters that apply across the charts within a dashboard. In this approach, you'll need to "retrofit" the queries behind each chart to include the extra dimensions needed for dashboard filtering. This becomes unmanageable quickly, especially given that BI tools often prescribe templated SQL (e.g. something like Jinja) as a way to incorporate dynamic conditional logic in the queries. Modern dashboards often contain dozens of charts and filters and the combinatorial explosion here is an incredible maintenance burden.
- limited exploration: users often want to dig deeper beyond the charts laid out in a tidy dashboard made by someone else. In the query-centric approach, however, digging deeper means exposing yourself to the raw SQL queries and modifying the charts ends up requiring a similar amount of tribal knowledge (around schemas & the data model) and SQL skills as the chart creator.
Semantic-Centric Visualization

On the opposite extreme is the semantic-centric approach to visualization. For those new to the concept, the semantic layer is an abstraction layer that sits above your physical database schemas. The goal of a semantic layer is to provide a "business representation" of the organization's data.
Typically, the semantic layer includes:
- a map of all of the relevant physical tables and views
- the metrics and dimensions that each table and view contain
- knowledge around which tables can be joined together
- hierarchy information
- named filters
- human-friendly labels and rich descriptions for all of the above
The general premise is that when you have all this information in one place, users can pick and choose things from a structured menu of objects, and SQL and charts magically get generated for them.
There’s a long history in business intelligence tooling, dating back to the late 1990s, behind the evolving sophistication of semantic layers.
- BusinessObjects called their semantic layer “universes”
- MicroStrategy had “projects”
- Microsoft SSAS ROLAP has "cubes"
- Looker has LookML "models", where the semantics are defined using a proprietary language/format.
The promised land of the perfect semantic layer is definitely appealing! The main value proposition of the semantic layer is that more people - namely “business users” who aren't familiar with SQL - can easily and safely self-serve to fulfill analytics needs on their own.
But despite its appeal, the semantic layer often falls short on its promises, especially in fast-moving environments. Let’s unpack some of the challenges that surface when dealing with heavy semantic layers:
- Maintenance burden: change management in data is notoriously messy and difficult. Evolving your data pipelines, data structures, historical data and visualization assets is challenging to say the least. As complexity compounds, change management burden grows quadratically. Having this extra layer to evolve jointly with everything else is challenging to say the least.
- Lots of upfront investment: historically at least, semantic layers haven't been progressively adaptable and most tools forced you to model data in the semantic layer prior to producing any sort of visualization. However, data work is fundamentally iterative and forcing a large investment in describing the semantic layer upfront made it difficult for analysts to just go and explore their data. Someone wanting to do a first pass on a new dataset may ask themselves -- "If I already have a table and want to quickly make a few charts, why do I even have to know what a LookML model is first?"
- Compounding complexity: the analytics process, which describes how data is instrumented, accumulated, curated, cleaned, structured, analyzed, and visualized) is already a complex and fragile chain that involves a variety of personas, skills, and technologies.
- Duplication of tools and logic: many organizations have multiple business intelligence and data visualization solutions. It's not uncommon to find more than 5 different solutions in place at larger companies. In the absence of a “universal semantic layer” that allows different tools to re-use the organization’s investment in modeling, people have to implement the same models multiple times across multiple tools. Different tools also have slightly different approaches to modeling, which multiples the complexity and maintenance burden discussed earlier.
- Self-service not materializing: a huge driver for investing in and maintaining a semantic layer is to enable business users to self-serve. In my experience spanning over a decade in business intelligence at many organizations and watching the evolution of business intelligence tools, I believe that we've fallen short on the promise of "build it and they will come". I’d like to dig deeper in this topic in another blog post in the future, exploring how and why the semantic layer has failed to deliver on its promises.
Dataset-Centric Visualization

What is a dataset? I define a dataset as an "enriched tabular structure", usually manifesting as a pointer to a physical table or view with extra semantics (more on this later).
Tabular structures are widely understood and easy to reason about. A majority of knowledge workers are already familiar with tabular structures from spreadsheets and “slice and dicing”-type operations from experience with pivot tables, column level filtering, and so on. This widespread familiarity constitutes a simple contract between the database and the BI tool that users can easily reason about and interact with.
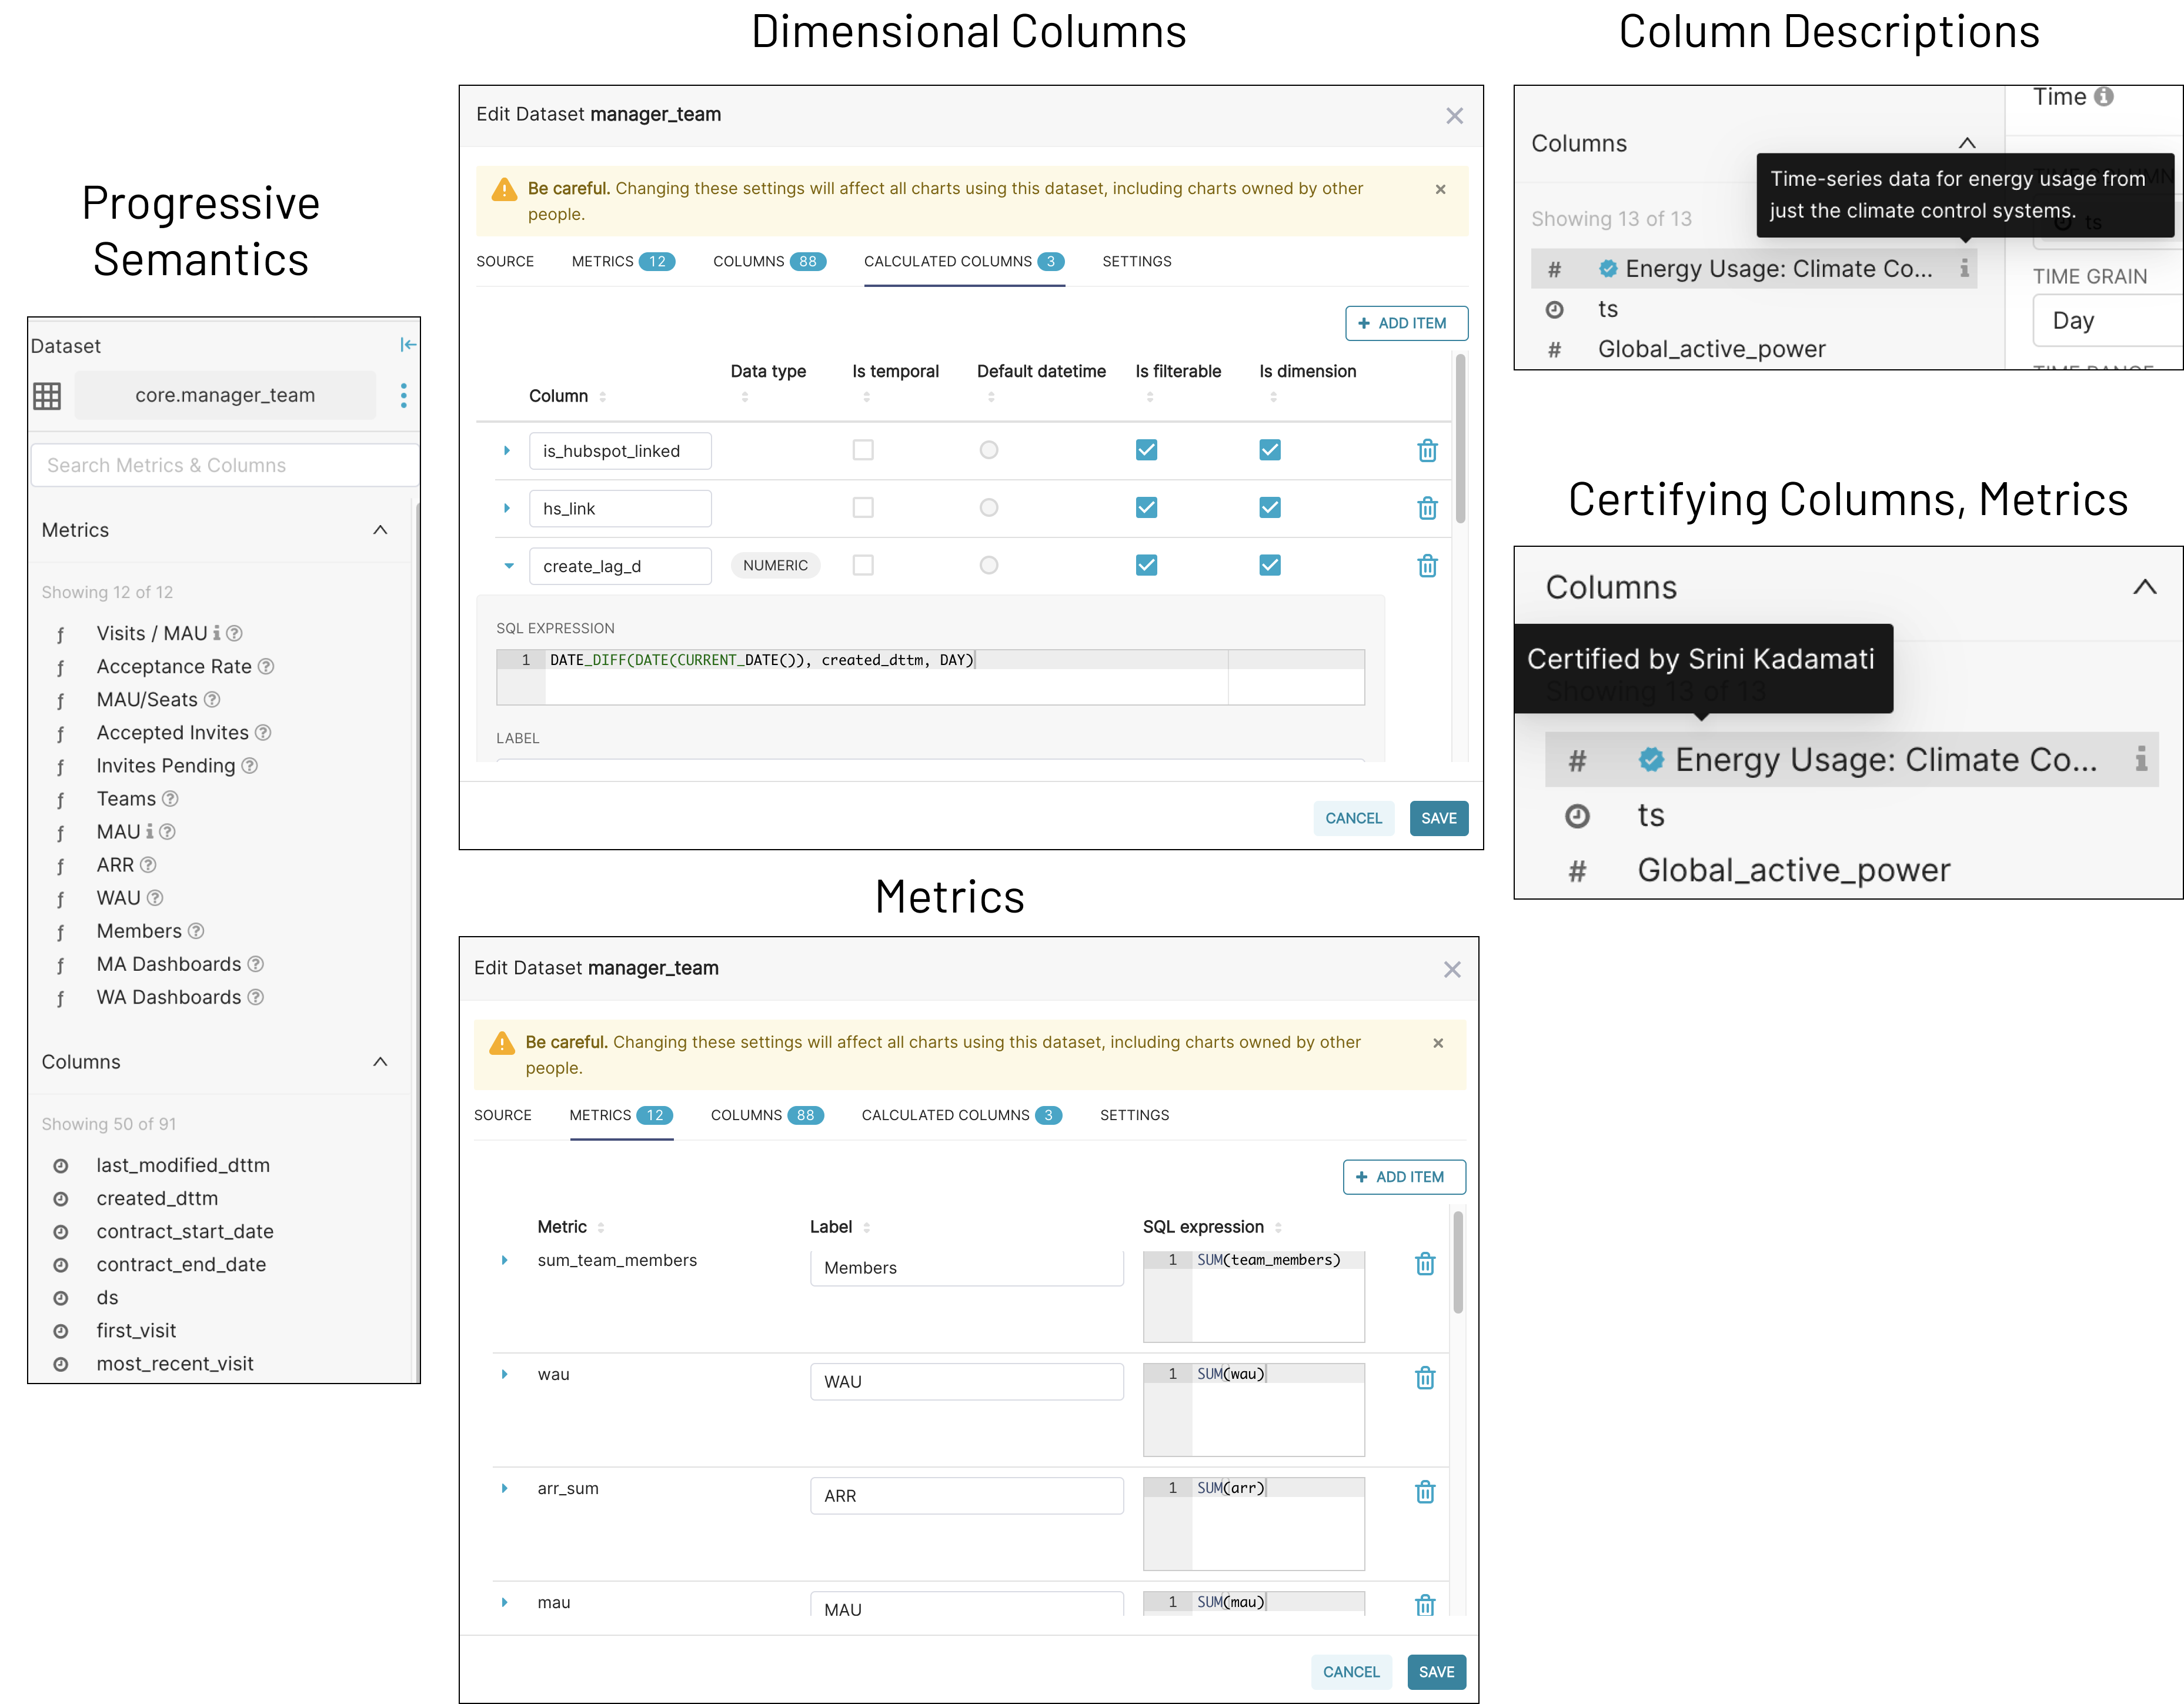
With that being said, raw data tables alone aren't enough and it's critical to incorporate some ideas from the semantic layer to get the best of both worlds. Datasets should contain extra semantics, like:
- clear labels and rich descriptions for the dataset itself
- clear labels and descriptions for the columns
- metrics as aggregate SQL expressions
- Total Population:
SUM(population) - Sessions per User:
COUNT(DISTINCT session_id) / COUNT(DISTINCT user_id)
- Total Population:
- calculated dimensions computed row-by-row at runtime
- definitions for which columns can be aggregated and filtered on
- for time series columns, information on timezone, time granularity, etc
- for numerical columns, information on units and preferred formatting
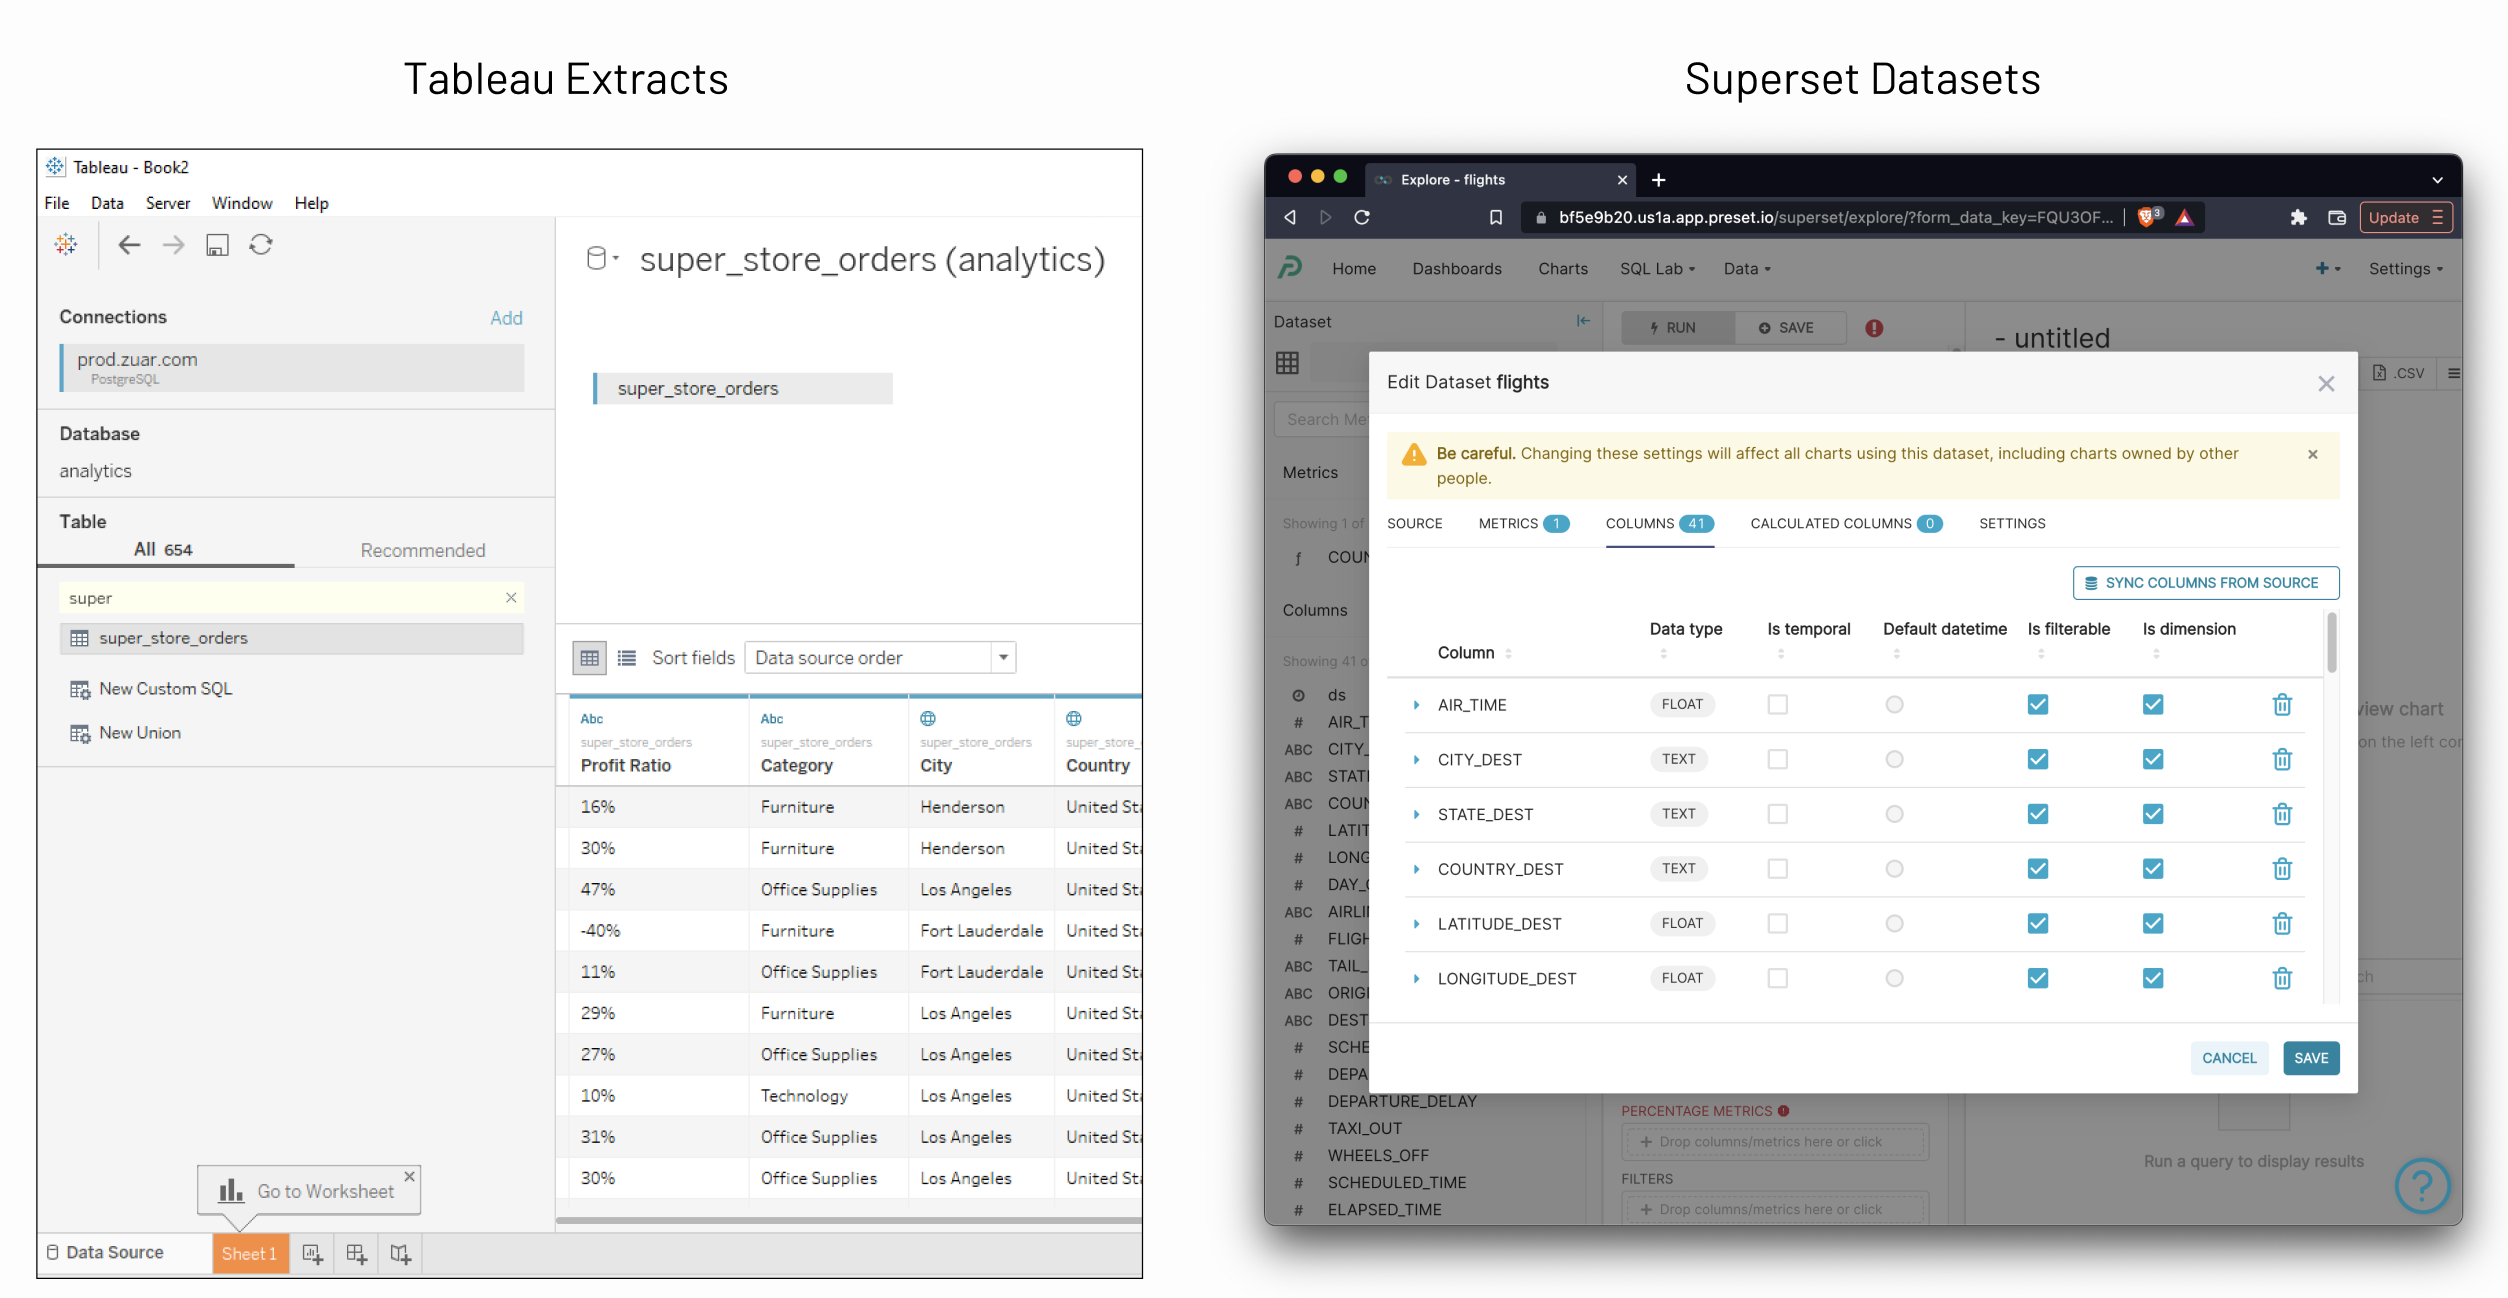
Arguably, part of the success of tools like Apache Superset and tools like Tableau could be attributed to their dataset-centric approach.
In the world of analytics, it's often recommended to produce and expose highly denormalized datasets for consumption. Whether you subscribe to dimensional modeling or another data modeling methodology, offering curated, denormalized, and well documented datasets on top of your more normalized models is a great approach. With storage and compute being incredibly cheap nowadays and with columnar file formats acting effectively as "inverted dimensional models", the cost of denormalizing further is minimal.
Instead of having the business logic live in the semantic layer (usually in the BI tool), have it live in the transform layer! Whether you want to use a ELT oriented approach powered by dbt, Airflow or something else entirely, the complexity of semantics are best stored in your transformation layer not in your data visualization layer.
Why is this?
First off, your transformation layer already contains a lot of complexity that's managed using software development best practices:
- logic can be stored in source control
- data lineage can be understood and visualized
- change management like CI / CD hooks and automated tests are available
The other important benefit of this approach is that the datasets resulting from your transformation layer can be re-used by all of the data tools in your organization (ranging from R / Python notebooks, BI tools, data apps, etc).
The dataset metaphor offers a simple and safe "dimensional" playground. In the dataset centric approach, all charts are built from these datasets that contain a comprehensive collection of relevant dimensions and metrics. This enables users to self-serve within that context. Your team members can typically slice and dice, which entails superpowers like applying arbitrary filters, drilling into dimensional details, drilling through to atomic rows, and choosing the right visualization
- This is superior to the one-query-one-chart approach where “pivoting” and slice-and-dicing requires going back to the query, understanding it and the underlying datasets, and altering it to fit your next question.
- This is superior to the semantic layer approach because the semantics can be progressively added over time in an agile way, instead of requiring a massive up-front definition
One drawback of pushing denormalization to its limits is that it introduces the use case for the Type 1 method from slowly changing dimensions (or SCD-1 for short). In simple terms, SCD-1 is when you’re interested in the most current attribute of the dimension member, and not the denormalized stamp of what it was at the time of the event. If a table has been denormalized/materialized, you’d have to reprocess its history to have this reflected. The simple solution for this is to define datasets as views. The view and underlying models can still be delivered as a tabular abstraction, while behind the scene solving the SCD-1 use case.
The Dataset-Centric Approach in Superset
Apache Superset was born at Airbnb in 2015 and evolved at hundreds of organizations over the past ~7 years. As a result, Superset's design evolution has centered around organizations with insight-driven, decentralized and highly effective data teams. Philosophically, time-to-chart, time-to-dashboard, and progressive adoptability over semantics have been the driving principles for Apache Superset.

While there wasn't a top-down mandate to be strictly dataset-centric, this design emerged over time through lots of iteration within the open source community.
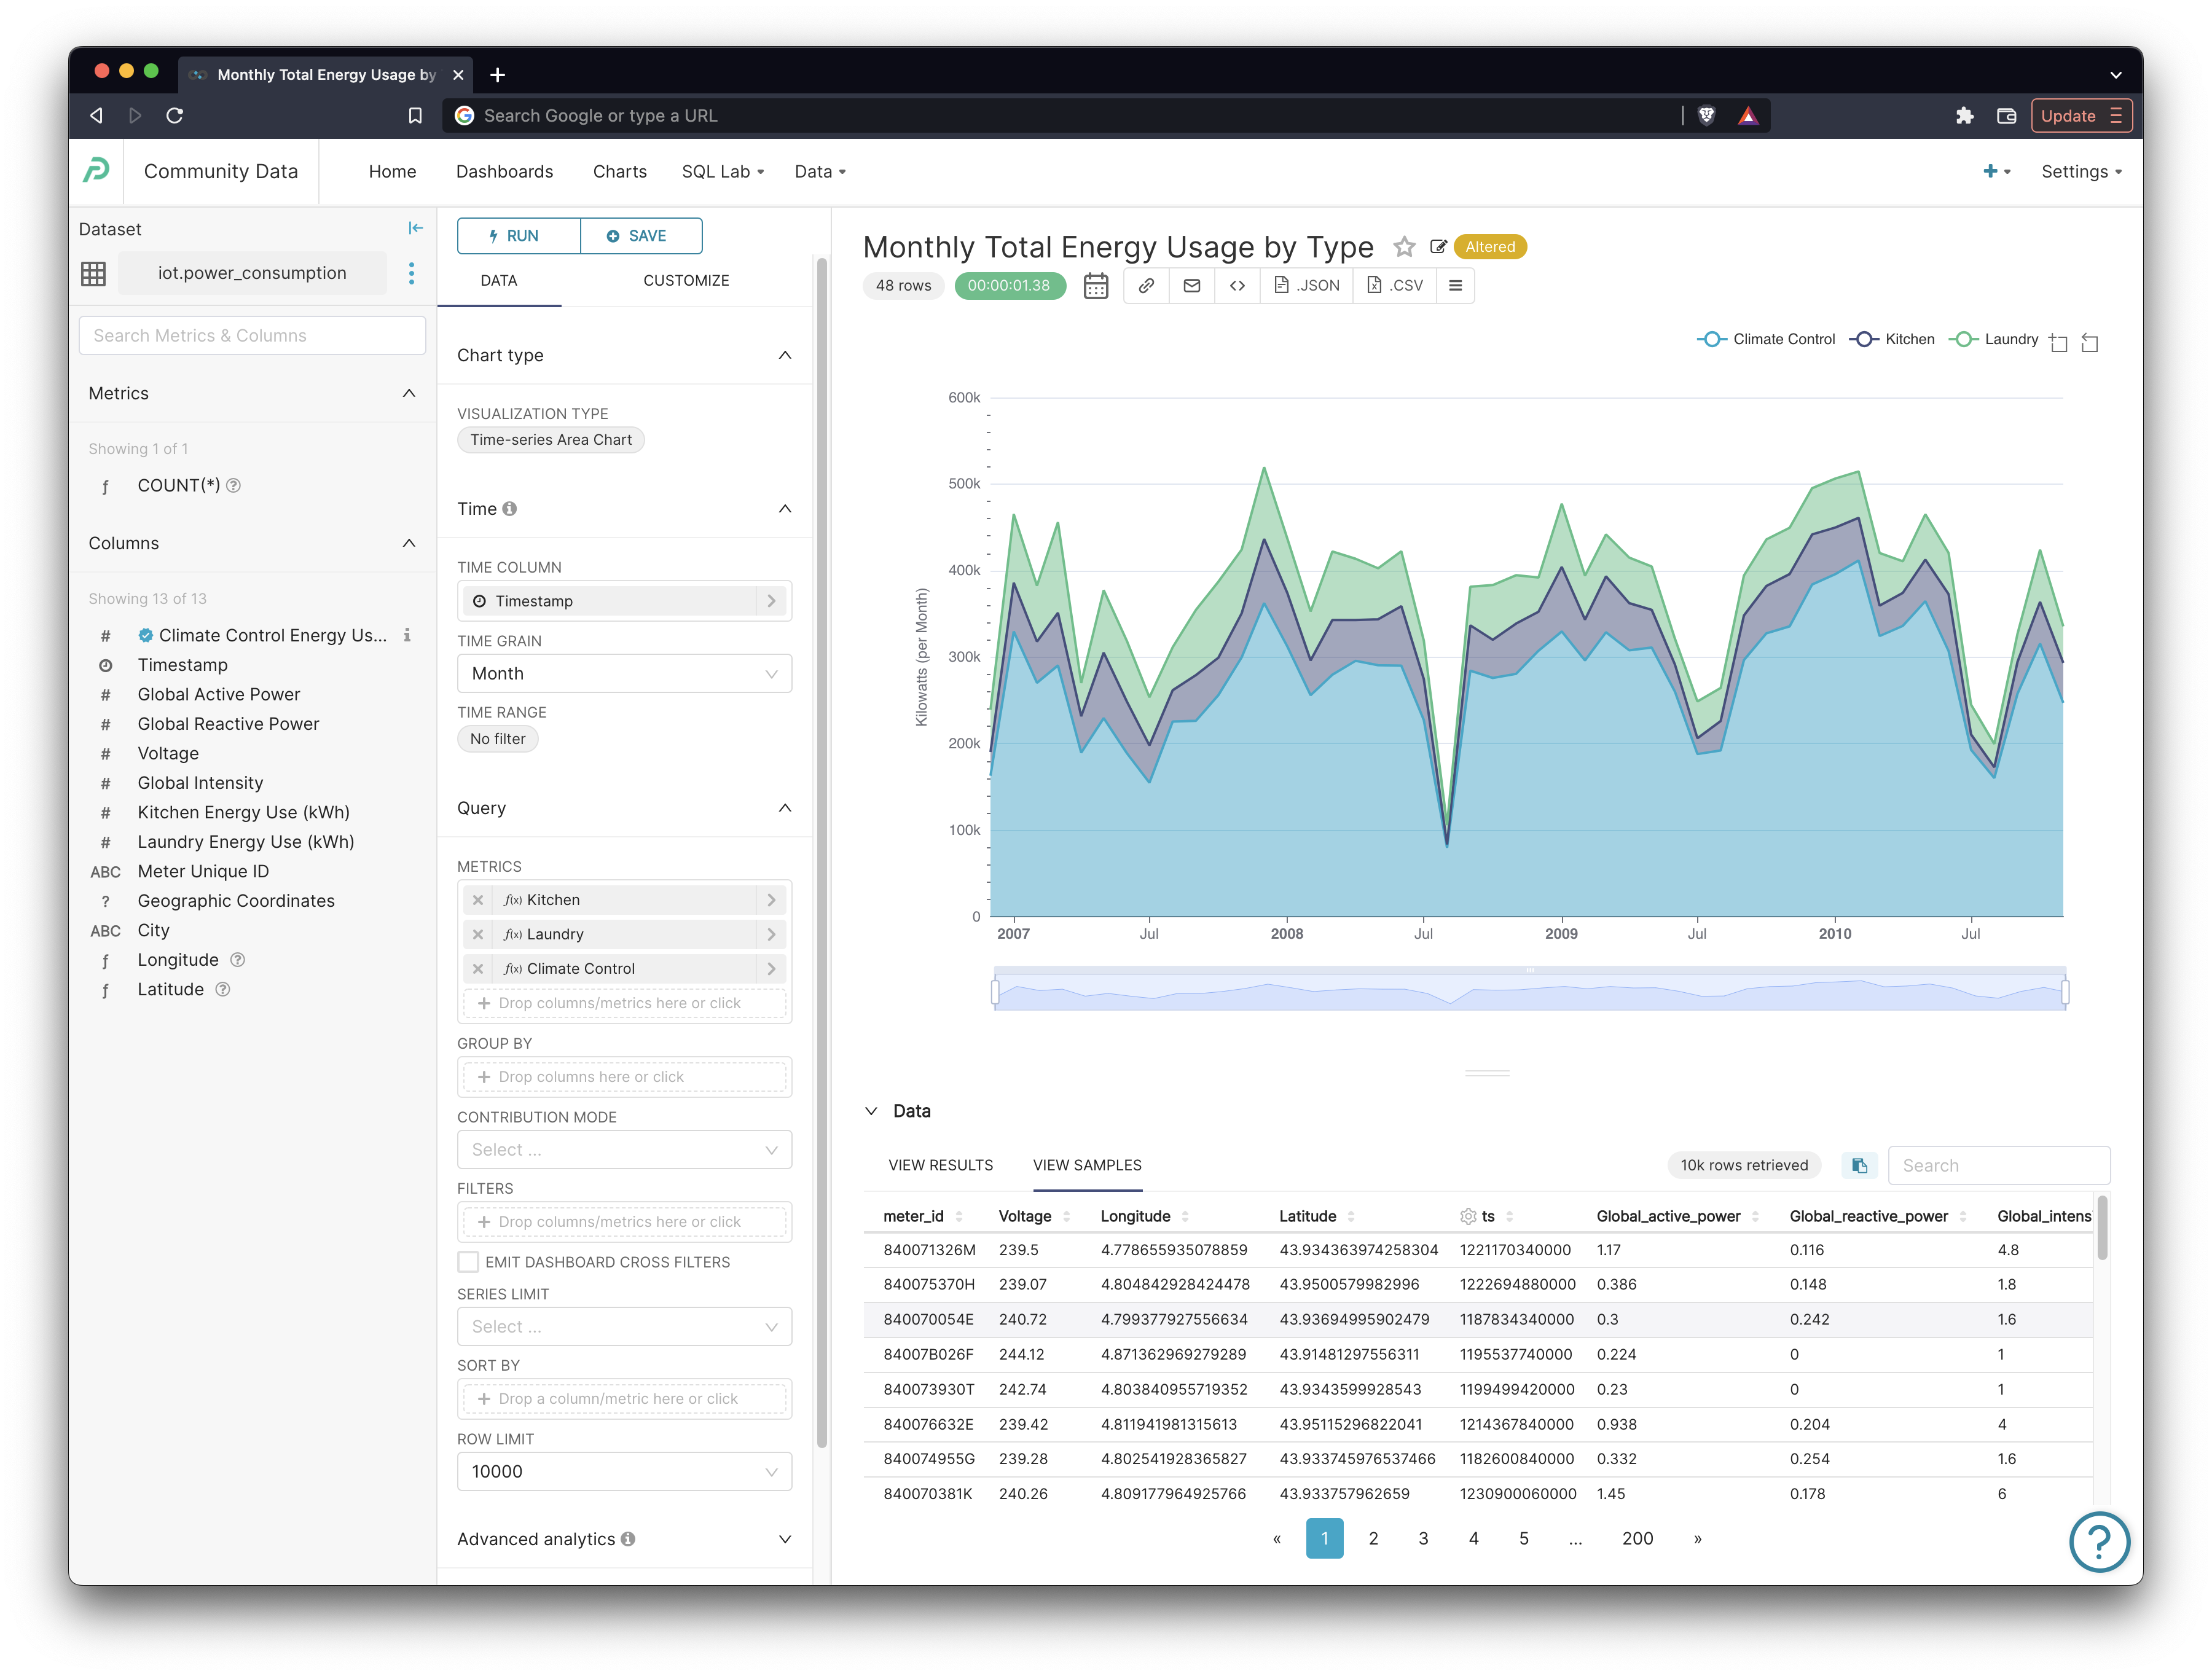
No Code Chart Builder
The core use case for Superset is to enable people to explore, visualize and collaborate on their data effectively. If you've set up the transformation layer to power the datasets you need for your analysis, Superset aims to be the fastest way to craft a chart. Because the dataset was prepared by the principles described in this approach, the following chart was created in just a few seconds:
Beyond the charts is a collection, with some interactive controls. Dashboards are essentially simple “data apps” and data app creation is the last sprint of the analytics process chain. Superset aims at making it as easy as possible to do just that.
Progressive Semantics
As providing semantics can be a bit tedious and get in the way of the core use cases listed above, Superset’s approach is to make semantics something you can adopt progressively as datasets become more used. All datasets are not made equal and each one follows some sort of maturity lifecycle. Given that, it’s important to let datasets and their semantics evolve together progressively. Whether your dataset is a bit of a personal experiment or whether it’s used by hundreds of data professionals daily in your organization should dictate how rigorous and how much enrichment you’ll do around this dataset.
You can learn more about the Superset philosophy for the thin semantic layer here.
Superset API
As a dataset becomes more useful and popular, it may make sense to move some of the semantic logic to source control. Superset, through its rich API, allows you to manage some of your data assets as code. This way, you can decide which parts of the BI experience lives outside of the GUI and are instead maintained as code. This unlocks the rigor you may eventually need around versioning, reviewing processes, change management and deployments.
Integration with Standalone Semantic Layers
As the BI layer is getting unbundled, semantics have eroded out of BI and instead have gone standalone or integrated into the database. For example, Superset integrates and pays nicely with these tools:
- dbt
- Transform
- Metriql
- Cube
- Dremio Semantic Layer
- and many more!
The old generation of semantic layer solutions were built by BI tools and were tightly integrated, which acted as a form of lock-in. The new generation of data tools increasingly store and share those semantics with the BI layer and seek to power datasets for multiple data environments (data apps, notebooks, BI tools, etc).
As the semantic layer intricately erodes into new areas, and as tools become better at exposing and sharing them, Superset’s philosophy is to embrace this change, and integrate with the emerging solutions. Also note that it’s always possible to denormalize further, meaning exposing dataset structures on top of a more traditional semantic layer is possible.
Takeaways
Some key points I want to highlight:
- The dataset centric approach builds on the tabular data structure that the majority of knowledge workers already understand.
- Dataset centric modeling is a powerful approach that I believe combines the best of the query-centric and semantic-centric visualization approaches.
- The dataset-centric approach encourages your organization to progressively adopt modern data stack practices without being forced to commit either extreme options up front.
If this approach excites you, I'd encourage you to give Superset a spin on Preset Cloud. Preset Cloud is our hosted offering for Superset and we have an incredibly generous free tier for you to start with.
