


Mastering Marketing Analytics with Marketing Dashboards


Introduction
In today's digital age, data is the currency that fuels modern, AI-enabled marketing. The ability to gather, manage and analyze numbers is essential for businesses striving to stay competitive and make informed choices. However, the sheer volume of information available poses a challenge for marketing teams. How can we transform vast amounts of raw data into actionable insights that drive our strategy? The answer lies in a marketing dashboard.
Recent research highlights why investing in dashboards matters. A guide from Dataslayer notes that 40% of users rate their dashboards three out of five or lower, and 72% still export data to Excel when dashboards fail to deliver answers. By contrast, companies with effective dashboards make decisions five times faster and cut reporting time by 80%, underscoring the value of a robust marketing dashboard.
What is a Marketing Dashboard?
A marketing dashboard is a consolidated workspace that displays key metrics and trends across all your channels. Rather than manually collating information from multiple sources, a dashboard pulls data from website analytics, CRM systems, email marketing platforms, social networks and more into one place. The goal is to simplify the process of analysis so that you can focus on interpreting results and making data‑driven decisions. A well‑designed dashboard highlights the metrics that matter most, provides context with comparison periods, and updates automatically to avoid stale data.
Key Components of a Comprehensive Marketing Dashboard
- Data Sources: A marketing dashboard is only as good as the platforms and data it pulls information from. Common sources include advertising platforms like Google Ads and Meta Ads, analytics tools such as Google Analytics 4 and Adobe Analytics, CRM systems like HubSpot and Salesforce.
- Visualization Tools: Charts, graphs and tables are used in dashboards to present numbers in a visually appealing manner. The right visualization makes patterns visible at a glance; the wrong one obscures them entirely. Keep layouts uncluttered, use color purposefully and ensure that the most important figures stand out.
- Metrics and KPIs: Raw numbers like impressions, clicks, conversions and revenue form the foundation of a dashboard but mean little without context. Key performance indicators (KPIs) tie metrics directly to business goals.
Benefits of Using Dashboards
Incorporating dashboards into your business strategy yields a range of advantages that make them indispensable tools in modern marketing.
- Real‑Time Data Insights: Dashboards provide immediate access to up‑to‑the‑minute figures, allowing you to respond promptly to shifting conditions and emerging trends. This agility is invaluable in a fast‑paced environment where delays can mean missed opportunities.
- Informed Decision‑Making: With consolidated data and clear visualizations, you can optimize campaigns, allocate resources effectively and navigate your strategy with precision. Data‑backed insights replace guesswork and help you focus on the initiatives that generate results.
- Enhanced ROI Tracking: Tracking the return on investment for each channel becomes much easier with a dashboard. You can pinpoint which strategies deliver the best outcomes and adjust your budget accordingly.
- Comprehensive Performance Assessment: A marketing KPI dashboard offers a holistic view of your performance by consolidating data from various sources. This allows you to assess how different elements of your strategy interact and influence each other.
- Improved Communication and Collaboration: Beyond individual benefits, dashboards promote better communication and collaboration within your team and organization. They provide a shared understanding of success metrics and foster cohesive, effective marketing efforts.
Marketing dashboards are particularly valuable in online marketing, where campaigns across channels produce streams of metrics that must be monitored in real time. A well‑structured dashboard can consolidate information from social platforms, email campaigns and paid ads, providing an online marketing dashboard that tracks performance across every touchpoint. By integrating tools like Google Analytics and CRM data, you gain a holistic view of your digital marketing efforts and can adjust tactics quickly.
Metrics to Track on Your Dashboard
To fully harness the power of dashboards, monitoring the right metrics is essential. Here's an example list of important measurements to include:
- Website Traffic and Unique Visitors: Measure the number of visitors to your site, including new and returning visitors, to gain insights into your online reach.
- Website Conversion Rates: Track the percentage of visitors who take desired actions such as making a purchase or signing up for a newsletter.
- Email Open Rate and Click‑Through Rate: Evaluate the effectiveness of your email campaigns by monitoring how many recipients open your messages and click on links within them. You can also track which links were most popular.
- Conversion Rates for Each Stage of the Funnel: Understand how effectively you're guiding leads through your marketing and sales process, from initial awareness to conversion.
- Cost Per Click (CPC): Monitor the effectiveness of paid campaigns such as Google Ads, LinkedIn Ads or Facebook Ads to maximize your investment.
- Cost Per Lead (CPL): Calculate the cost associated with acquiring a lead, helping you assess the efficiency of your lead generation strategies.
- Cost Per Acquisition (CPA): Determine the cost of acquiring a customer, including all marketing expenses, to gauge the profitability of your acquisition efforts.
- Customer Lifetime Value (CLV): Predict the long‑term value a customer brings to your business, aiding in strategic decisions regarding retention and acquisition.
- Return on Investment (ROI): Measure the profitability of campaigns by comparing the gain from investments to the cost of those investments.
There are many more metrics you can track when monitoring performance, such as social media engagement, email deliverability rates, number of impressions and click‑through rates for each campaign. Focus on the measures that align with your objectives and adjust as your goals evolve.
For digital campaigns, additional metrics may include ad impressions, click‑through rates, share of voice and sentiment analysis from social listening. A performance dashboard often relies on Google Analytics as a foundational source of website and campaign data, complemented by advertising platforms and marketing automation tools. Including website analytics events, such as conversions, goal completions and user flow, within your dashboard ensures you capture the full customer journey. When building a marketing dashboard, it is important to choose metrics that align with your funnel and overall marketing objectives.
Top 7 Marketing Dashboard Examples
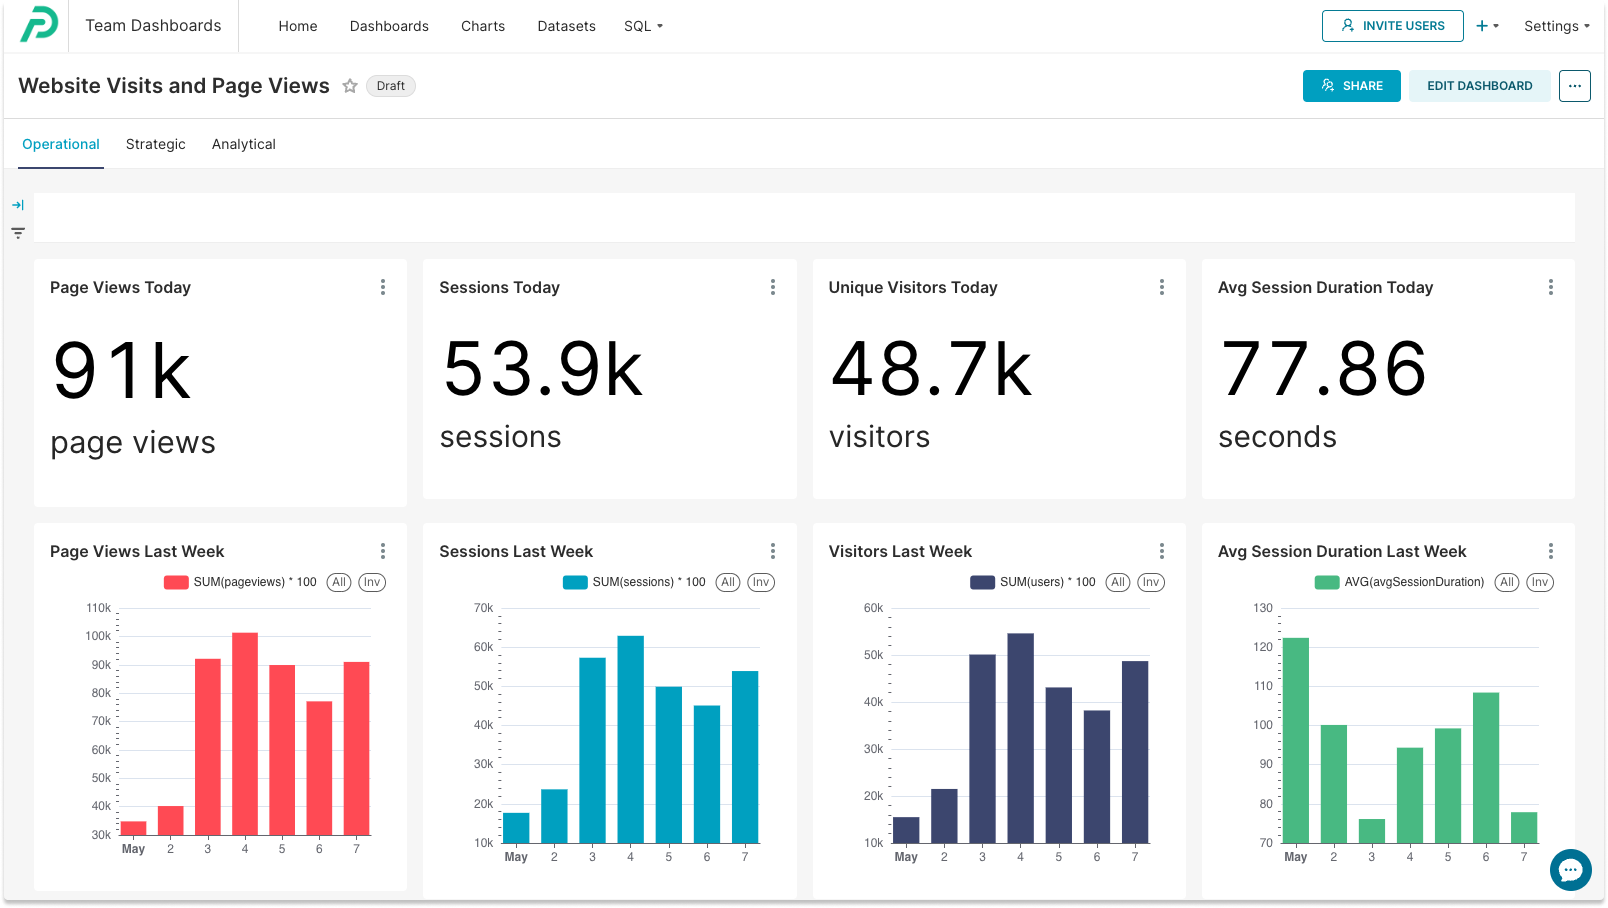
- Web Analytics Dashboard: This type of dashboard integrates with your Google Analytics dashboard and shows metrics for today as well as the last week. You can modify charts using different criteria such as dates, unique versus total visits, new users versus returning users, bounce rates, user demographics and more.
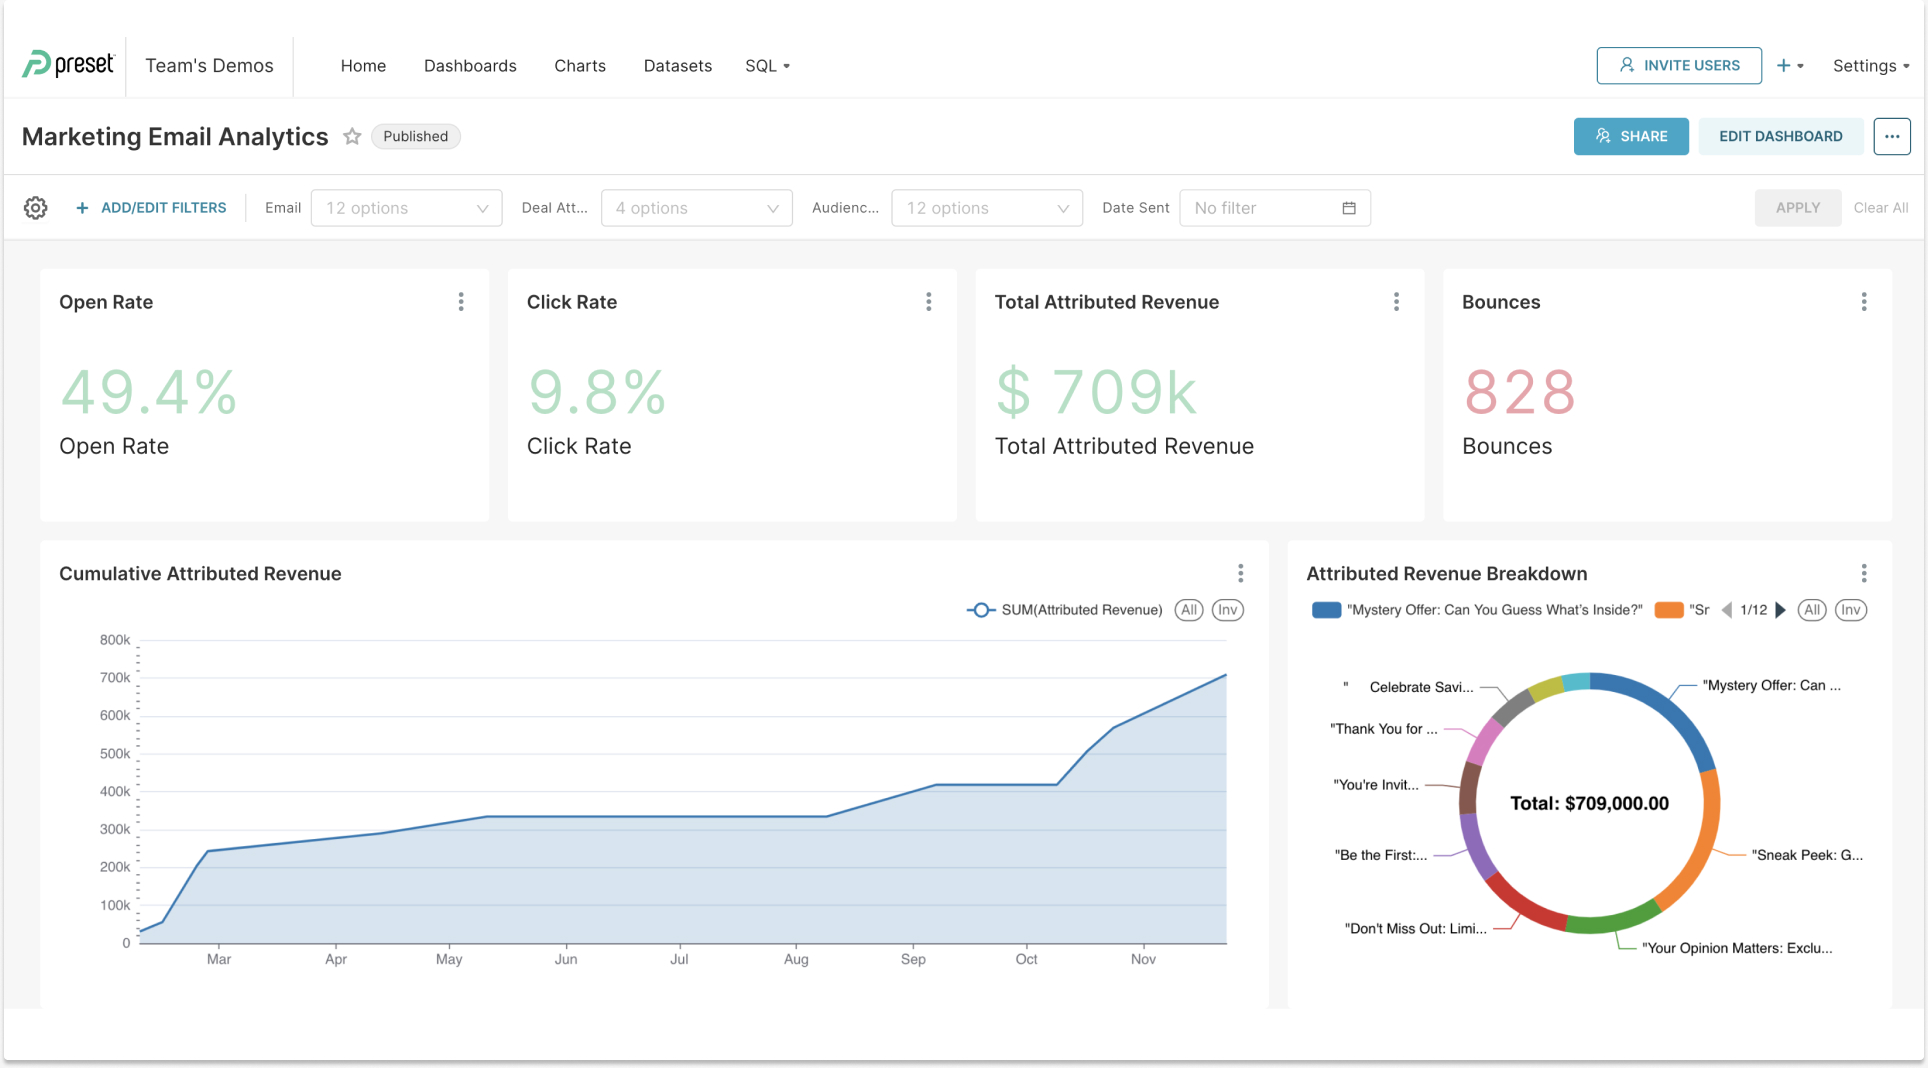
- Email Marketing Performance Dashboard: An email dashboard enables you to quickly grasp campaign performance at a glance. Beyond tracking open and click‑through rates, you can attribute revenue to each campaign and view the breakdown of attributed revenue by campaign.
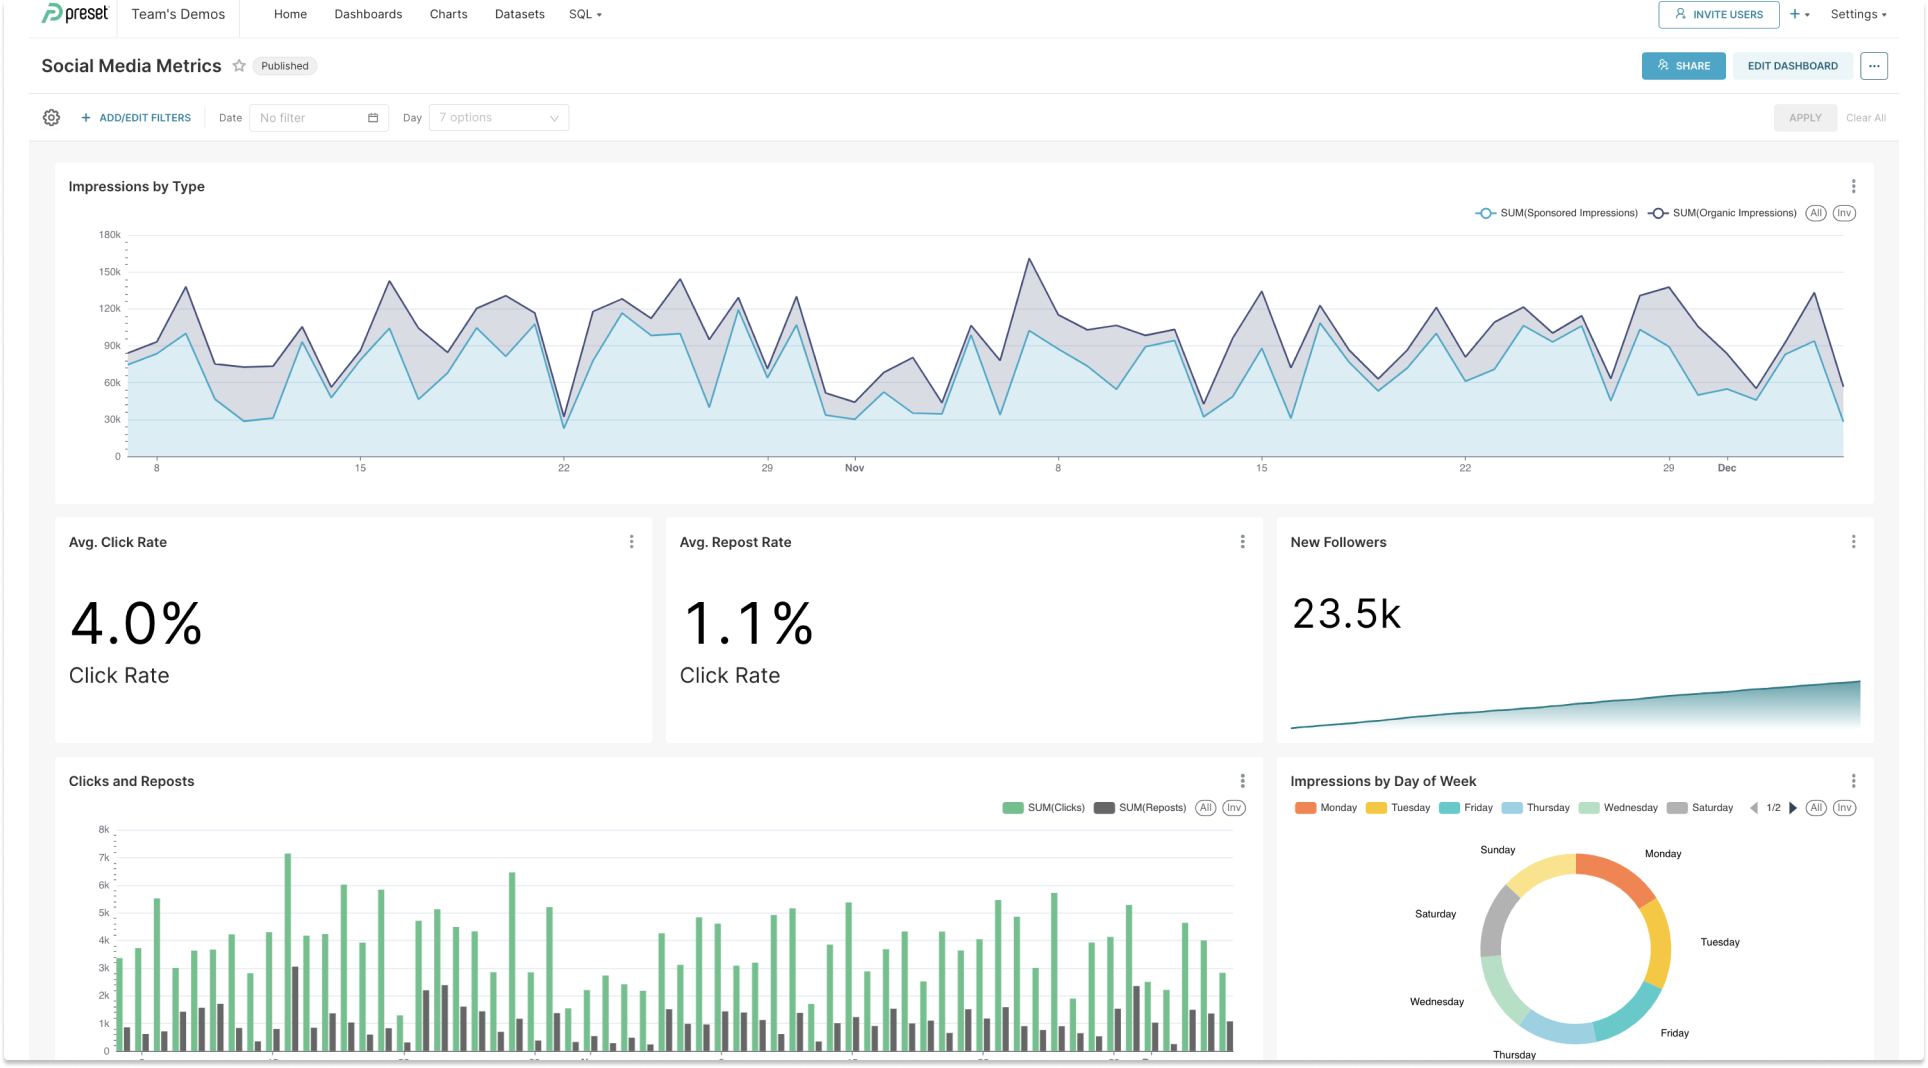
- Social Media Engagement Dashboard: This dashboard tracks key metrics such as likes, shares and comments to gauge your social media performance. It provides insights into follower growth, post reach and engagement trends, helping you refine your content strategy for better audience interaction.
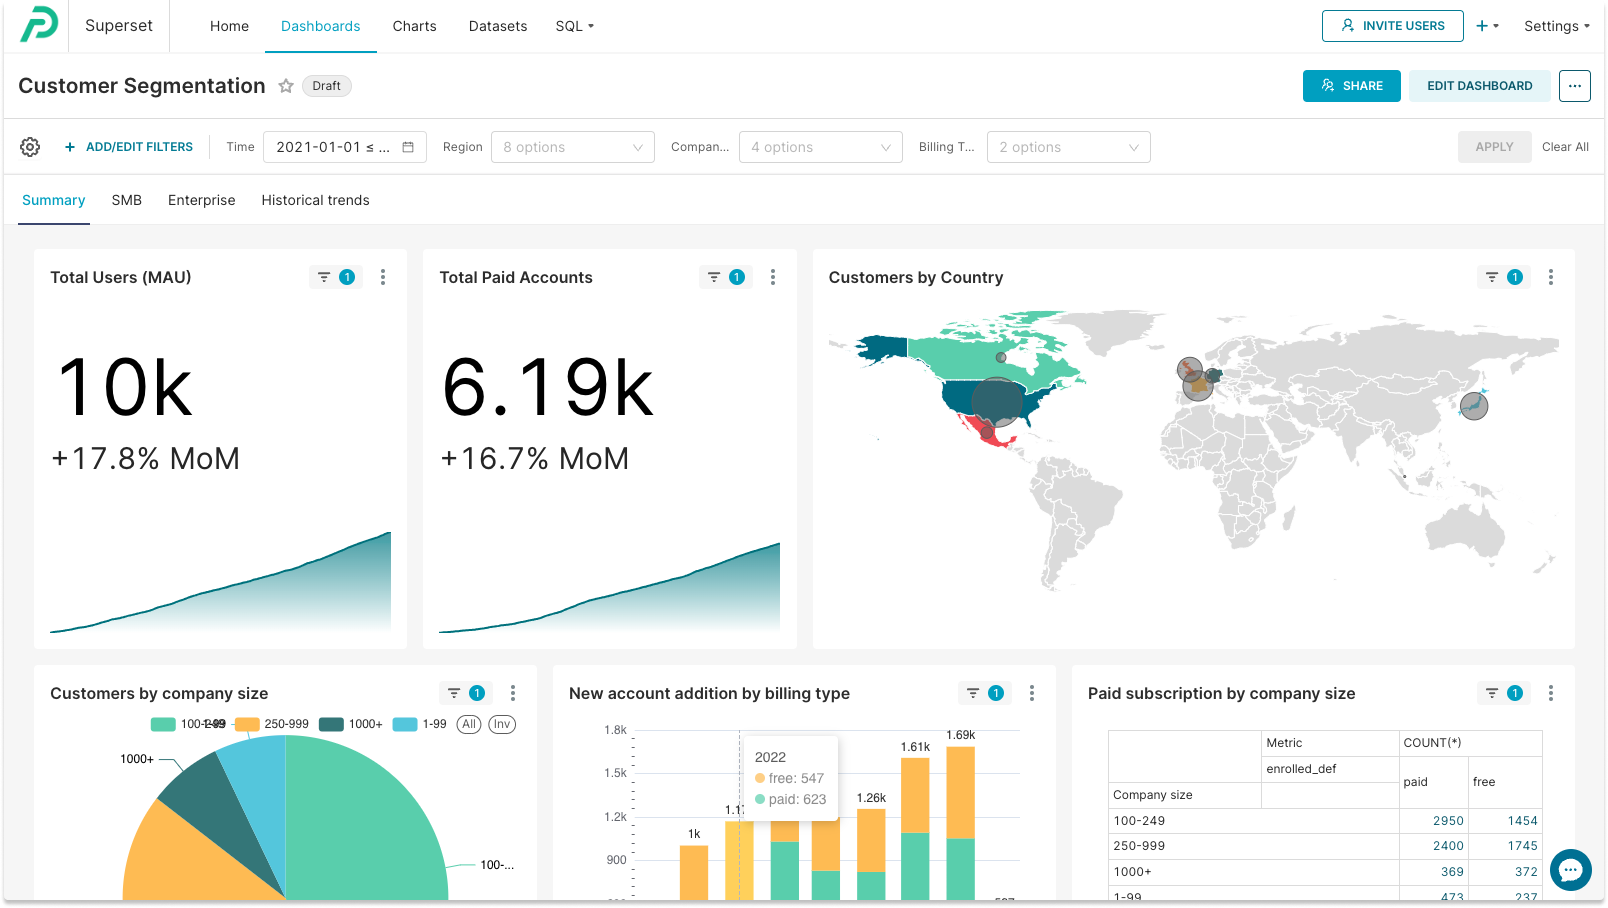
- Customer Segmentation Dashboard: A customer segmentation dashboard helps you gain a deeper understanding of your audience by segmenting customers based on demographics, firmographics and subscription types. This information helps you refine your ideal customer profile, sharpen targeting and improve marketing efficiency.
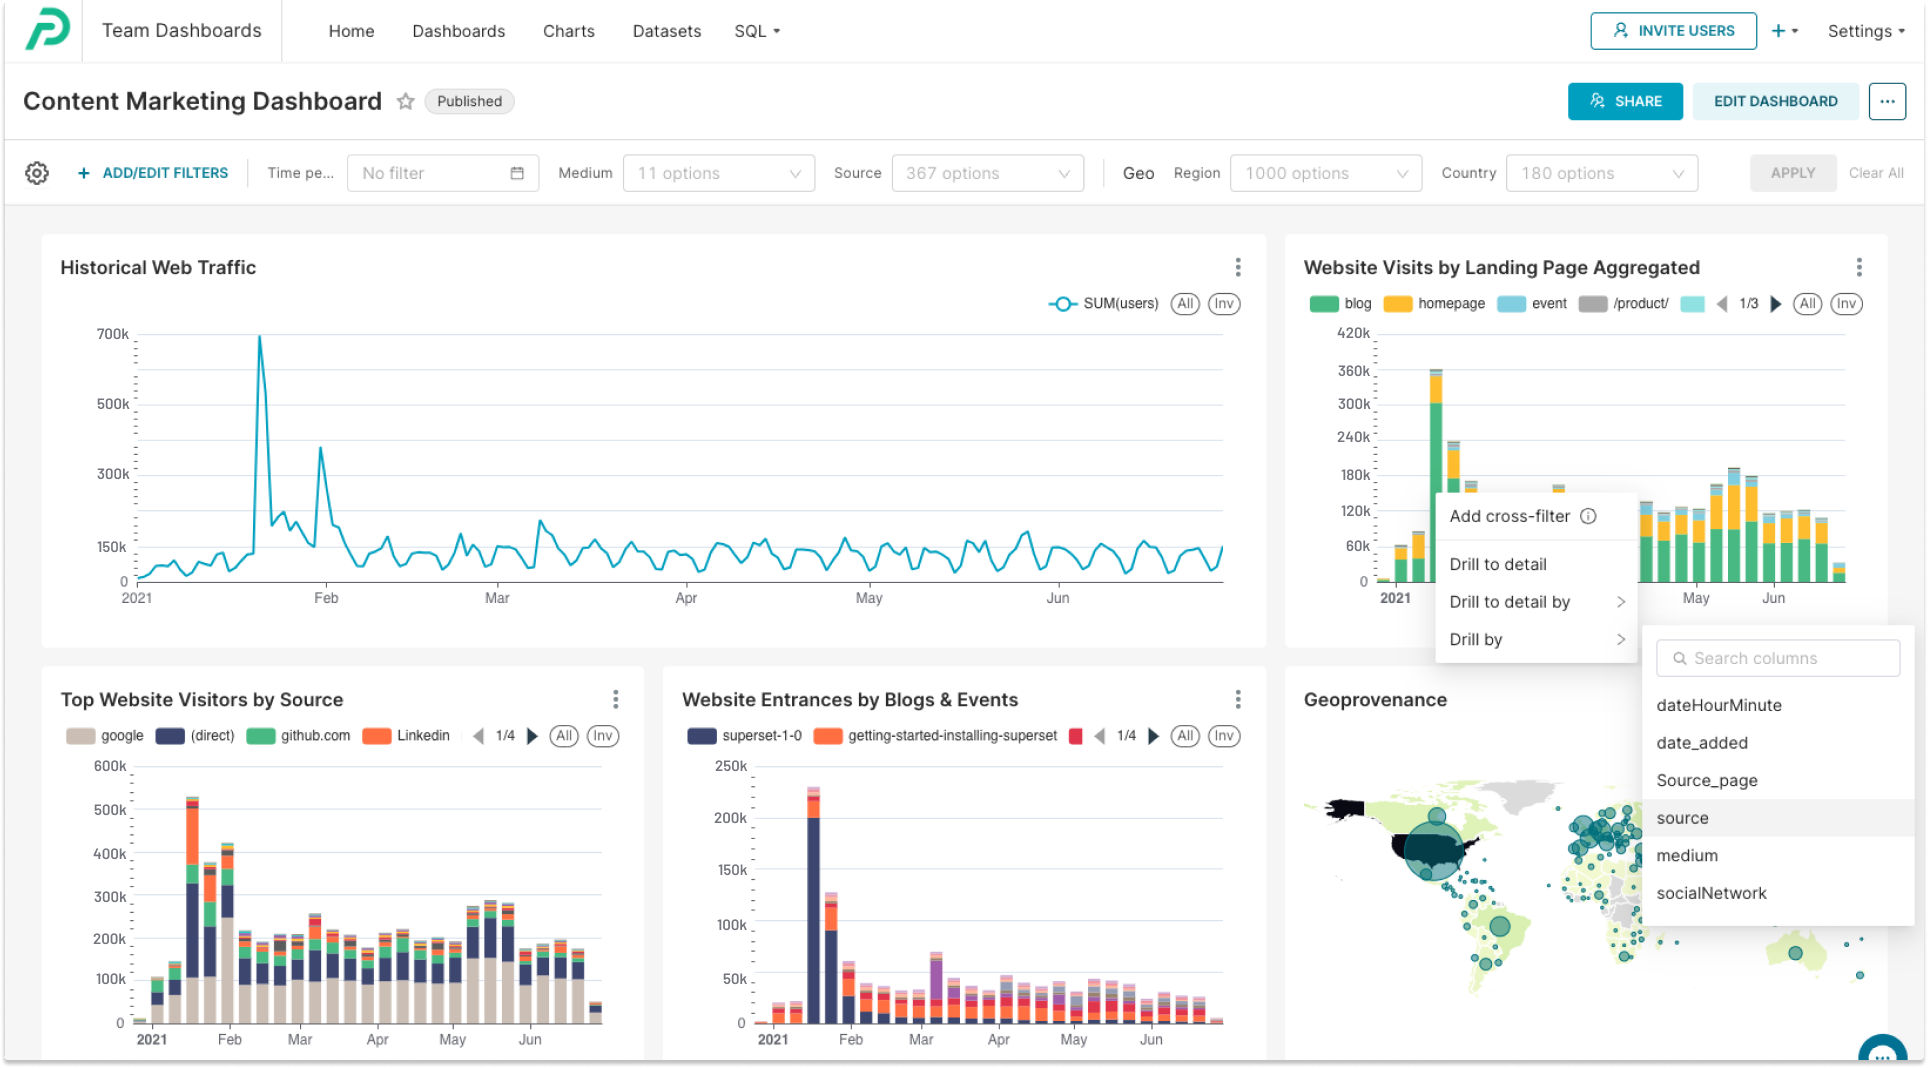
- Content Marketing Dashboard: This dashboard analyzes the effectiveness of your content marketing initiatives, including blog posts and events. It focuses on identifying the landing pages that attract the most traffic, a key element in shaping your content strategy. You can also apply filters to see the traffic sources for specific pages and differentiate between organic and paid traffic.
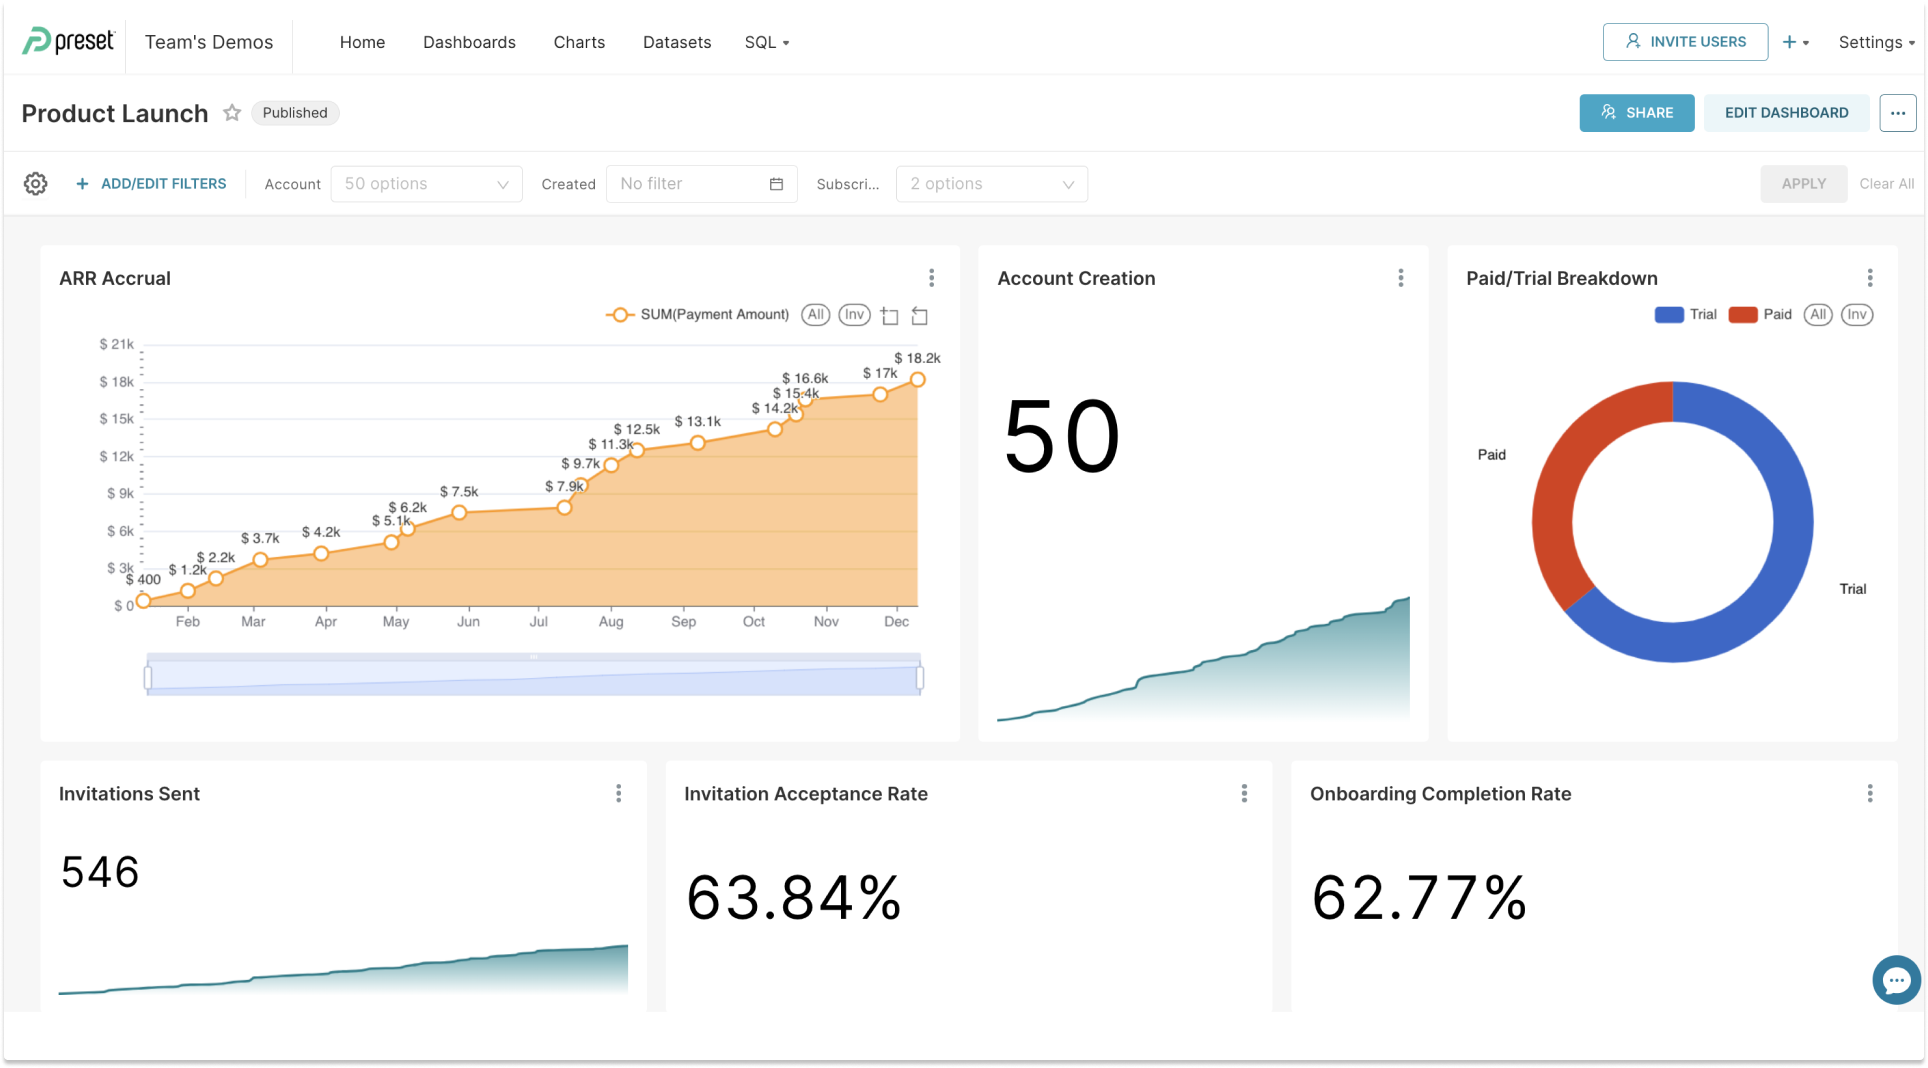
- Product Launch Dashboard: For SaaS marketers, particularly those concentrating on product‑led growth, a product launch is a major event. A product launch dashboard assists in evaluating the impact of your marketing initiatives and shaping future strategies by showing how different channels contribute to sign‑ups or revenue.
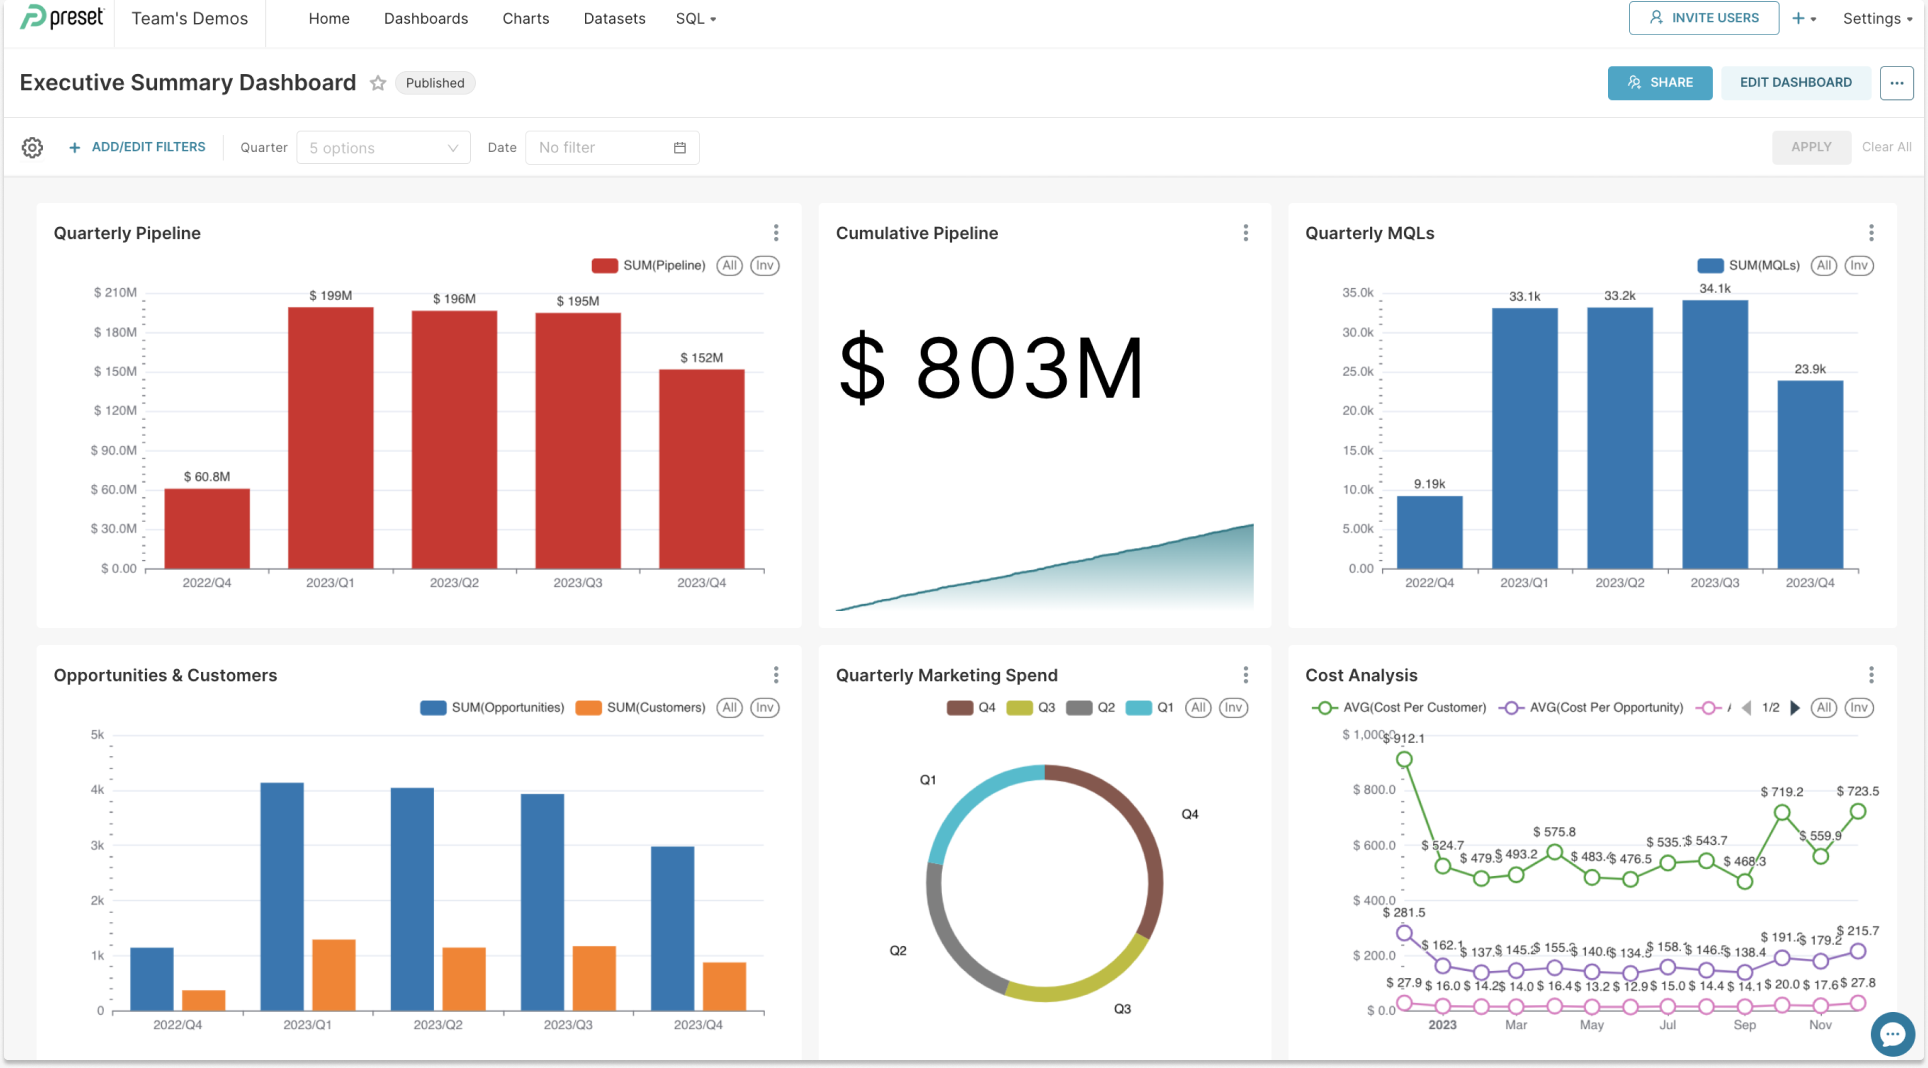
- Executive Summary Dashboard: This dashboard offers a high‑level overview tailored for executive decision‑makers. It displays key metrics that matter to company leadership, including quarterly pipeline creation, conversion rates from opportunities to customers, marketing spend and cost analysis.
A simple way to get started is to use a dashboard template tailored for your role or industry. A predefined dashboard offers the basic structure, with charts and tables ready to populate with your data. For instance, if you're managing content marketing, you can select a template that includes traffic sources, bounce rates and popular pages.
Those new to dashboards may find it helpful to explore Preset's documentation and chart walkthrough, offering step-by-step instructions that illustrate how to organize metrics within a dashboard. Over time you can customize the template and add new visualizations to create a marketing dashboard that reflects your unique needs. Using a predefined layout accelerates the setup process and removes guesswork, allowing you to focus on insights rather than design.
How to Create Your Own Dashboard
Ready to build your own dashboard? Follow these steps:
- Identify the Dashboard's Purpose: Before anything else, determine what problem the dashboard is intended to solve or what specific questions it aims to answer. This understanding guides all subsequent steps and ensures relevance and effectiveness.
- Select the Right Data Visualization Tools: There are many tools on the market. Choose one that meets your criteria and allows you to create effective, interactive dashboards.
- Define Your Key Metrics and KPIs: Identify the metrics and KPIs most relevant to your business goals so that you can focus on answering important questions.
- Design the Layout: Create a visually appealing layout that is easy to navigate and understand. Use hierarchy to guide the eye.
- Data Integration and Automation: Integrate data sources and automate updates for real‑time insights. Manual exports can lead to delays and stale information.
- Regular Monitoring and Optimization: Continuously monitor your dashboard and make improvements based on changing objectives and insights.
When assembling your dashboard, remember that Google Analytics offers a robust set of dimensions and metrics that integrate seamlessly with many visualization tools. Connecting this analytics platform to your dashboard enables deeper analysis of user behavior and campaign performance.
Pairing data from this platform with information from email platforms and CRM systems helps you create a comprehensive dashboard. As your organization grows, you may evolve from a single dashboard to multiple dashboards, each tailored to different marketing functions or campaigns.
Get Started with Preset
As you look to create a powerful marketing dashboard, you'll need the right tools to simplify the process and make your data come to life. Preset is a valuable tool that can significantly streamline the creation of dashboards.
Key Features and Benefits of Preset
- Customization: Preset provides you with the flexibility to customize your marketing dashboard to align perfectly with your brand identity and specific data requirements. Tailor your dashboard to display the metrics and KPIs that matter most to your business.
- Data Visualization Capabilities: Preset is equipped with powerful data visualization tools that can transform complex datasets into easy‑to‑understand charts, graphs and tables. These visualizations are instrumental in conveying your data's story effectively.
- User‑Friendliness: Even if you're not a data analytics expert, Preset's interface makes dashboard creation accessible to everyone. You can easily drag and drop elements, connect data sources and create stunning visuals without extensive technical skills.
Why Choose Preset for Your Dashboard?
By incorporating Preset's marketing dashboard templates into your projects, you can save valuable time and resources while ensuring that your analytics efforts are as efficient and insightful as possible.
Whether you're a marketing professional looking to impress stakeholders with visually compelling reports or a business owner aiming to make data‑driven decisions, Preset can help you achieve your goals.
Preset makes it easy to build dashboards from scratch or customize existing chart templates. The platform integrates with popular analytics tools and other marketing data sources, empowering teams to design a cohesive dashboard that delivers actionable insights.
By providing a rich library of visualization types and a flexible layout editor, Preset helps you create dashboards that inform and inspire. Whether you're optimizing a search campaign or monitoring brand sentiment, a dashboard designed in Preset can transform raw data into compelling stories.
Don't miss out on the opportunity to unlock the full potential of your marketing strategies. Book a demo with Preset today and discover how it can elevate your dashboard game.
Future of Marketing Dashboards and Best Practices
Modern marketing dashboards can come in many varieties, including campaign‑specific dashboards, multi‑channel dashboards and executive overview dashboards. These marketing dashboards should be designed with clarity and purpose, ensuring that each marketing dashboard answers a specific business question.
As technology evolves, marketing dashboards will increasingly apply predictive analytics and AI to surface insights without manual digging. When evaluating a marketing dashboard, consider how quickly it refreshes data and whether it can integrate seamlessly with your existing tools. Effective marketing dashboards also prioritize accessibility, allowing stakeholders to explore metrics without specialized training.
Let's Get Visual. Try Preset Today.
Ready to take the next step? Start using Preset for free and explore the possibilities of building interactive dashboards that drive success in your marketing initiatives.
