


Business Intelligence Reporting


Introduction
Today's businesses face an unprecedented challenge—navigating an ever-expanding ocean of data. Every click, every transaction, every engagement leaves a data footprint. And while this surge of information presents countless opportunities, organizations are often paralyzed by the sheer volume of it. This is where Business Intelligence reporting (BI reporting) strides in, offering a lifeline to businesses searching for clarity amidst the chaos. Business intelligence reporting gives organizations the tools to move from data overload to confident, evidence-backed decisions. Data analytics sits at the heart of this process, giving structure and meaning to the numbers that flow through an organization every single day. This comprehensive exploration into business intelligence reporting will shed light on its definition, various forms, benefits, best practices, and how Preset is carving a niche in this domain.
What is Business Intelligence Reporting?
At its core, business intelligence tools allow you to create reports that use a technology-driven process to interpret raw data into meaningful, actionable business insights. This transformative approach aims to streamline data comprehension through systematic collection, integration, analysis, and presentation of business information. The ultimate goal? To facilitate strategic decision-making, offering businesses a competitive edge in the ever-evolving marketplace. In practice, business intelligence reporting draws on data analytics pipelines that pull from databases, CRMs, marketing platforms, and operational systems to produce a unified, reliable view of performance across the organization.
Delving into the types of business intelligence (BI) reports uncovers a spectrum of tools, each designed to cater to diverse business needs:
- Self-service BI: A democratized approach where individuals, irrespective of their technical prowess, can generate BI reports tailored to their needs, freeing up data analysts and data engineers and promoting a data-driven culture across all departments of an organization.
- BI dashboards: Think of these as the cockpit of an airplane. Dashboards centralize the most critical metrics through data visualization, offering a bird's-eye view, and ensuring quick and informed decisions.
- Embedded BI reports: These are seamlessly integrated into business applications, ensuring users don't have to switch platforms to derive insights, enhancing efficiency and user experience.
- Mobile BI: With the world going mobile, BI tools haven't stayed behind. Mobile BI ensures decision-makers have access to insights on the go, ensuring agility in responses.
- Static BI: The traditional stalwarts, these are non-interactive reports, often used for standard monthly reviews or regulatory submissions.
The Benefits of Business Intelligence Reporting
A business intelligence reporting tool is the unsung hero in the modern business playbook. Beyond simplifying data management, business intelligence reporting is instrumental in sculpting a company's roadmap to success. As we delve deeper, we realize its transformative potential. Selecting the right BI reporting tool for your organization is the critical first step toward unlocking each of these advantages at scale.
- Improved Operational Efficiency: Business intelligence reporting highlights inefficiencies, streamlines processes, and optimizes resource allocation, leading to tangible cost savings.
- Versatile Applicability: From HR to supply chain, marketing to finance, business intelligence reporting finds utility across the board, making it an indispensable BI tool.
- Data Utilization: It's not enough to have data; one must harness it. BI reporting ensures every byte is analyzed, turning potential insights into actionable strategies. Data analytics capabilities make this possible by connecting disparate sources into a single reporting layer, so teams spend less time gathering information and more time acting on it.
- Customer Insights and Predictive Analysis: Ever wondered what your customers might want next? BI reporting, with its predictive analytics, offers a glimpse into the future, ensuring businesses always stay one step ahead. Advanced data analytics within BI platforms allow teams to model churn risk, segment audiences by behavior, and forecast lifetime value with a precision that manual analysis simply cannot replicate.
- Operational Optimization and Forecasting: Whether it's anticipating seasonal demand surges or understanding market shifts, BI reporting provides businesses the foresight to adapt and thrive. Teams that embed data analytics into their forecasting workflows consistently outperform those relying on static spreadsheets, because they can respond to signals in the data before those signals become costly problems.
- Cost Management: By highlighting wastages, inefficiencies, and redundancies, BI reporting is a guardian of the bottom line.
- Informed Strategic Decision-Making: No more relying on gut feelings or anecdotal evidence. Every decision is backed by data analysis, minimizing risks and maximizing outcomes. When a well-constructed BI report reaches a leadership team, it carries enough analytical weight to shift priorities, reallocate budgets, and reshape the direction of a product or campaign.
How to Create an Effective Business Intelligence Report
Creating a business intelligence report that resonates and drives action is an art. It's not merely about presenting data but doing so in a manner that is comprehensible, compelling, and convincing. Let's dissect the best practices to master this:
- Understand Your Audience: Different stakeholders require different insights. A marketing head's requirements will vary vastly from those of a CFO. Tailor your reports to resonate with your audience.
- Prepare Your Data: Garbage in, garbage out. Ensure the data is cleaned, relevant, and updated. Regular audits can avoid potential pitfalls. Data analytics is only as reliable as what feeds it, so establishing clean data pipelines upstream is just as important as the reporting layer itself.
- Build Flexibility and Scalability: Today's insights might not serve tomorrow's challenges. Ensure your BI tools are adaptable, catering to evolving business needs. A BI reporting tool that cannot grow with your data stack will become a bottleneck rather than an asset, so evaluating long-term compatibility at the outset saves significant rework down the line.
- Govern Your Data: In an age of data breaches, ensuring data integrity and security is paramount. Regular checks and robust protocols are non-negotiable.
- Craft Compelling Data Stories: Numbers can be numbing. Weave them into compelling narratives, making the insights relatable and easy to digest. A strong BI report does not just present numbers — it guides the reader through a logical sequence of findings that builds toward a clear, defensible conclusion.
- Continuously Iterate: The business landscape is ever-evolving, and so should your reports. Regular feedback loops and iterations ensure continued relevance.
- Promote Data Literacy: A report is only as good as its interpretation. Invest in training, ensuring that everyone on your team, from business users to data experts, can comprehend and act on the insights. Organizations that invest in training their teams to read and explore reports tend to extract far more value from their data analytics investments, because insight generation does not stop at the analyst's desk.
- Choose Relevant Metrics: Not all numbers matter. Focus on metrics that align with business goals and your story, avoiding data overload.
- Master Data Visualization: A picture speaks a thousand numbers. Use graphs, charts, and infographics to make your data visually appealing and intuitive. Strong data visualization separates a report that gets acted on from one that gets filed away, so investing in the right chart types and layout logic pays dividends across every audience.
BI Reporting Dashboard Examples
There are a number of different business intelligence dashboard options available, allowing teams to visualize data from different data sources and industries. These dashboards not only help users harness the power of their data but also enable them to make informed decisions, identify trends, and uncover hidden patterns. Each dashboard type serves a distinct function within the broader business intelligence reporting ecosystem, from high-level executive overviews to granular operational deep-dives. Let's look at some examples of BI reporting dashboards:
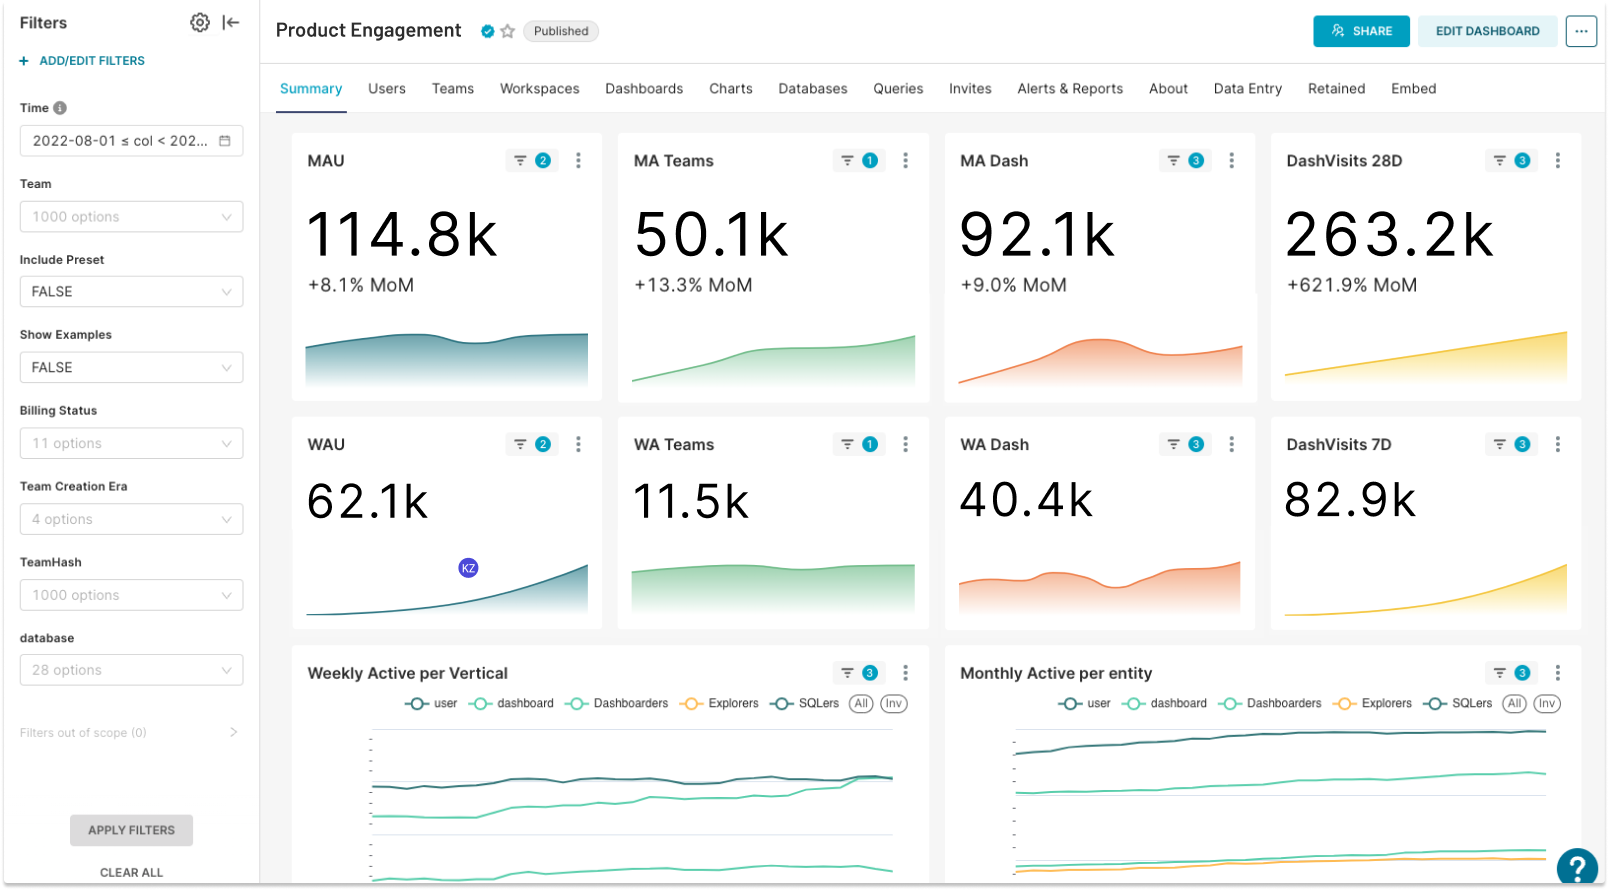
Product Engagement Dashboard
The product engagement dashboard allows organizations to be on top of their product data. There are a variety of metrics that can be tracked. In the example below the dashboard shows data on product engagement using product teams' data, such as Monthly and Weekly Active Users (MAU, WAU), Monthly and Weekly Active Teams (MA Teams, WA Teams), number of Monthly and Weekly Active Dashboards, and number of dashboard visits within the last 7 and 28 days.
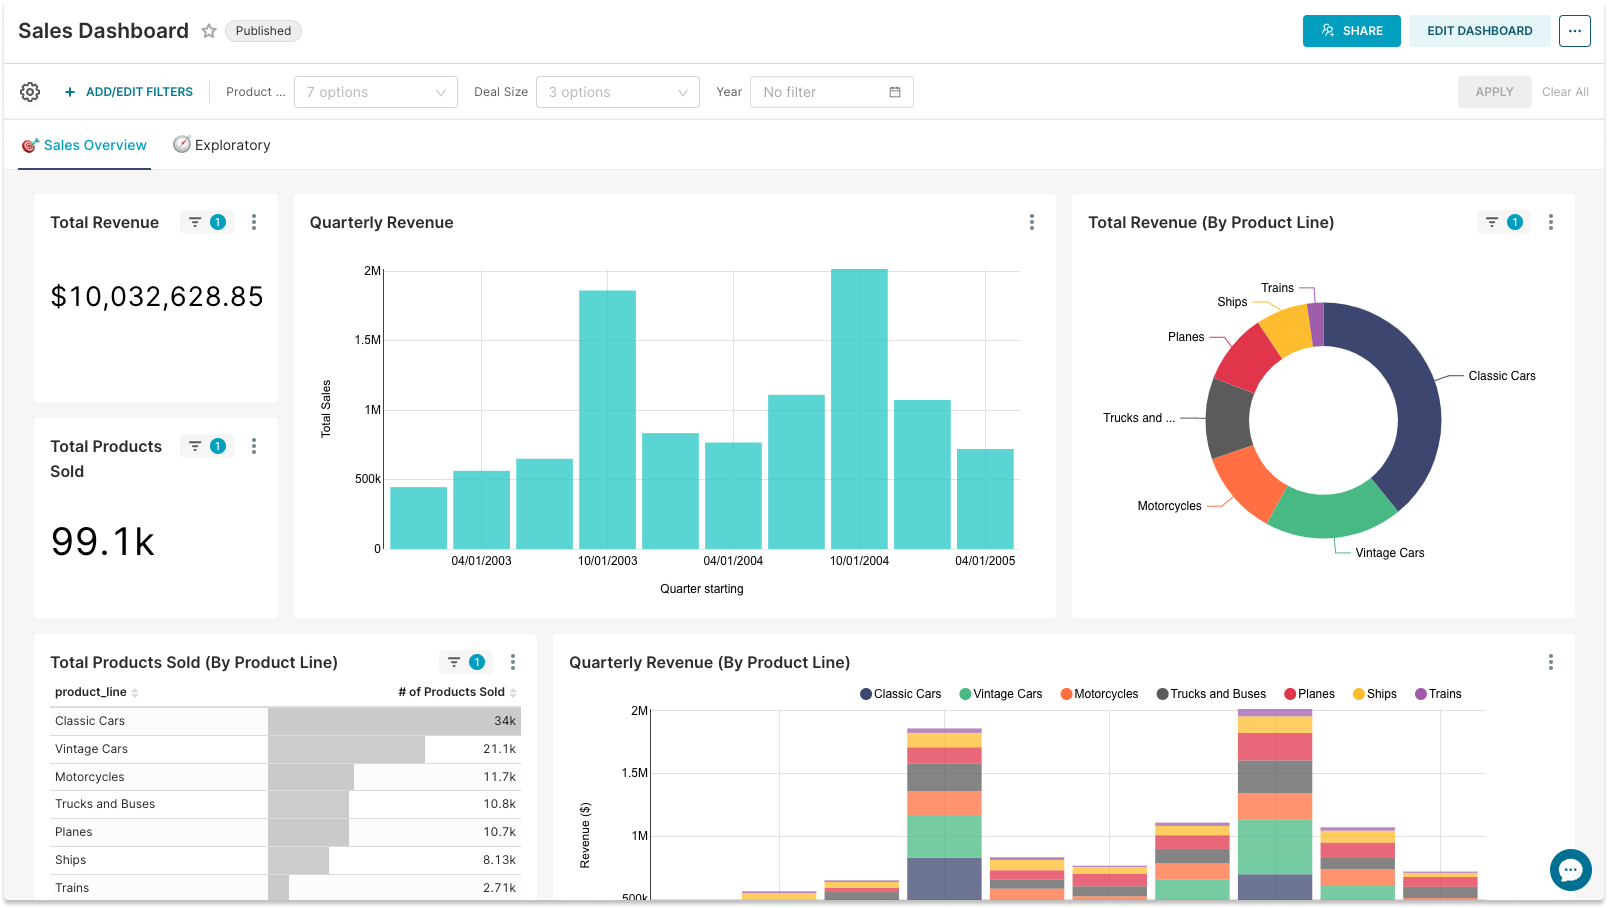
Sales Dashboard
Sales and revenue metrics are critical for companies to be able to ensure growth. This example dashboard provides insight into the business operations of vehicle manufacturers. Tracking sales metrics in BI reporting tools allows sales professionals and other stakeholders to see and analyze important data in a timely manner.
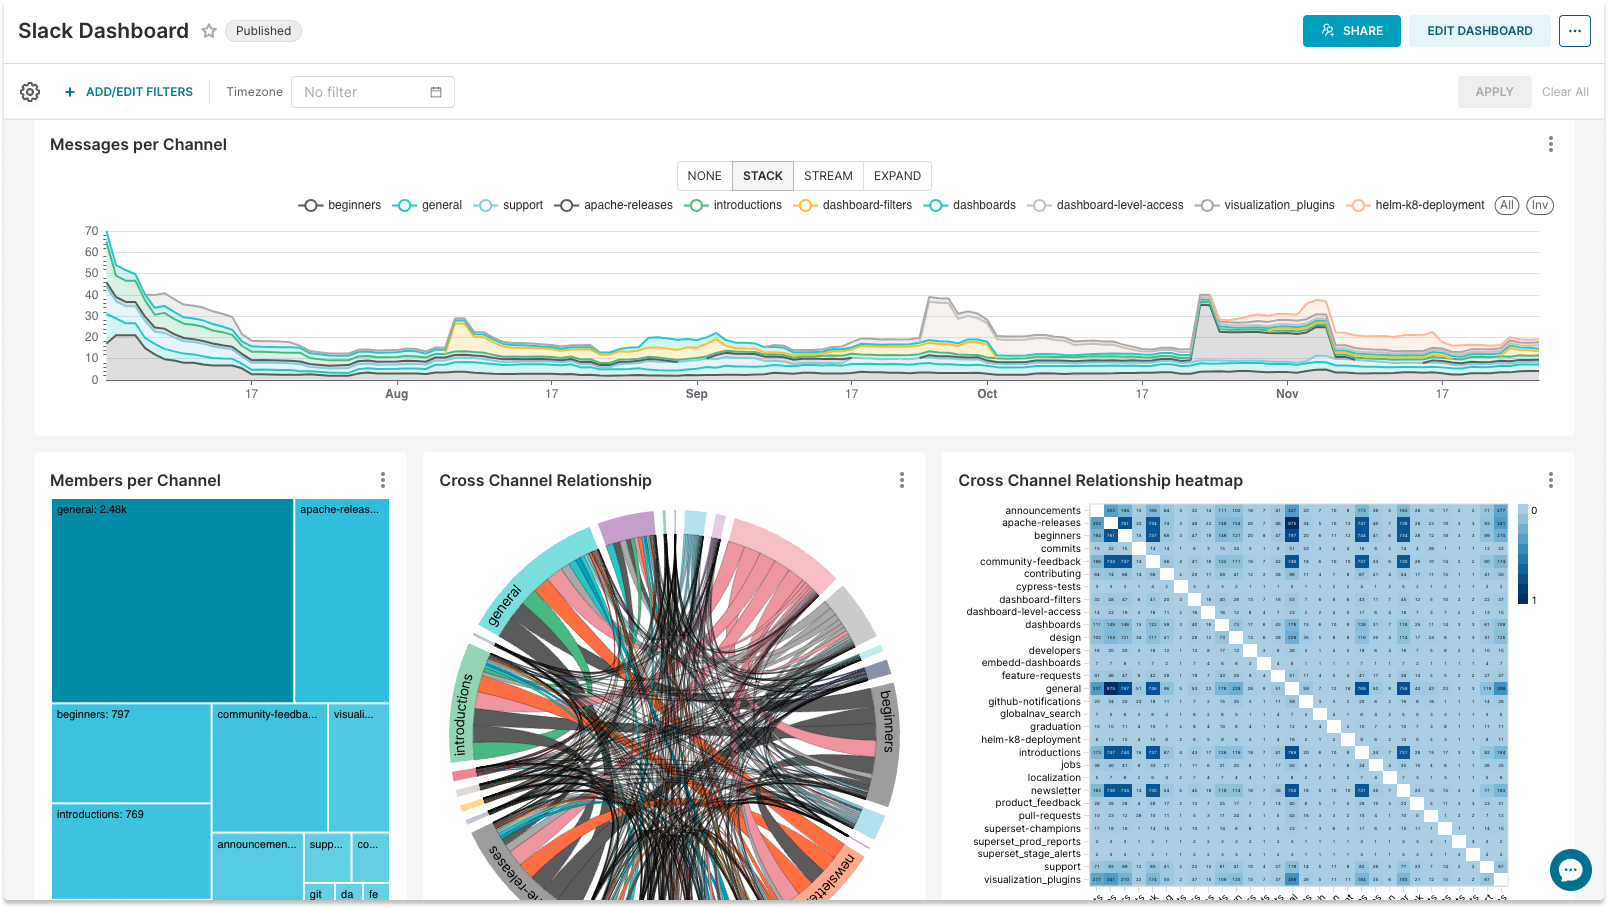
Online Community Health Dashboard
With a growing number of online communities the Community Health Dashboards become very popular. By tracking the metrics of the community, community managers can find valuable insights for the community's growth and development. The dashboard example below gives a view of the overall community health and activity, such as the total number of members, where the members are located, what channels are the most popular, and other insightful information.
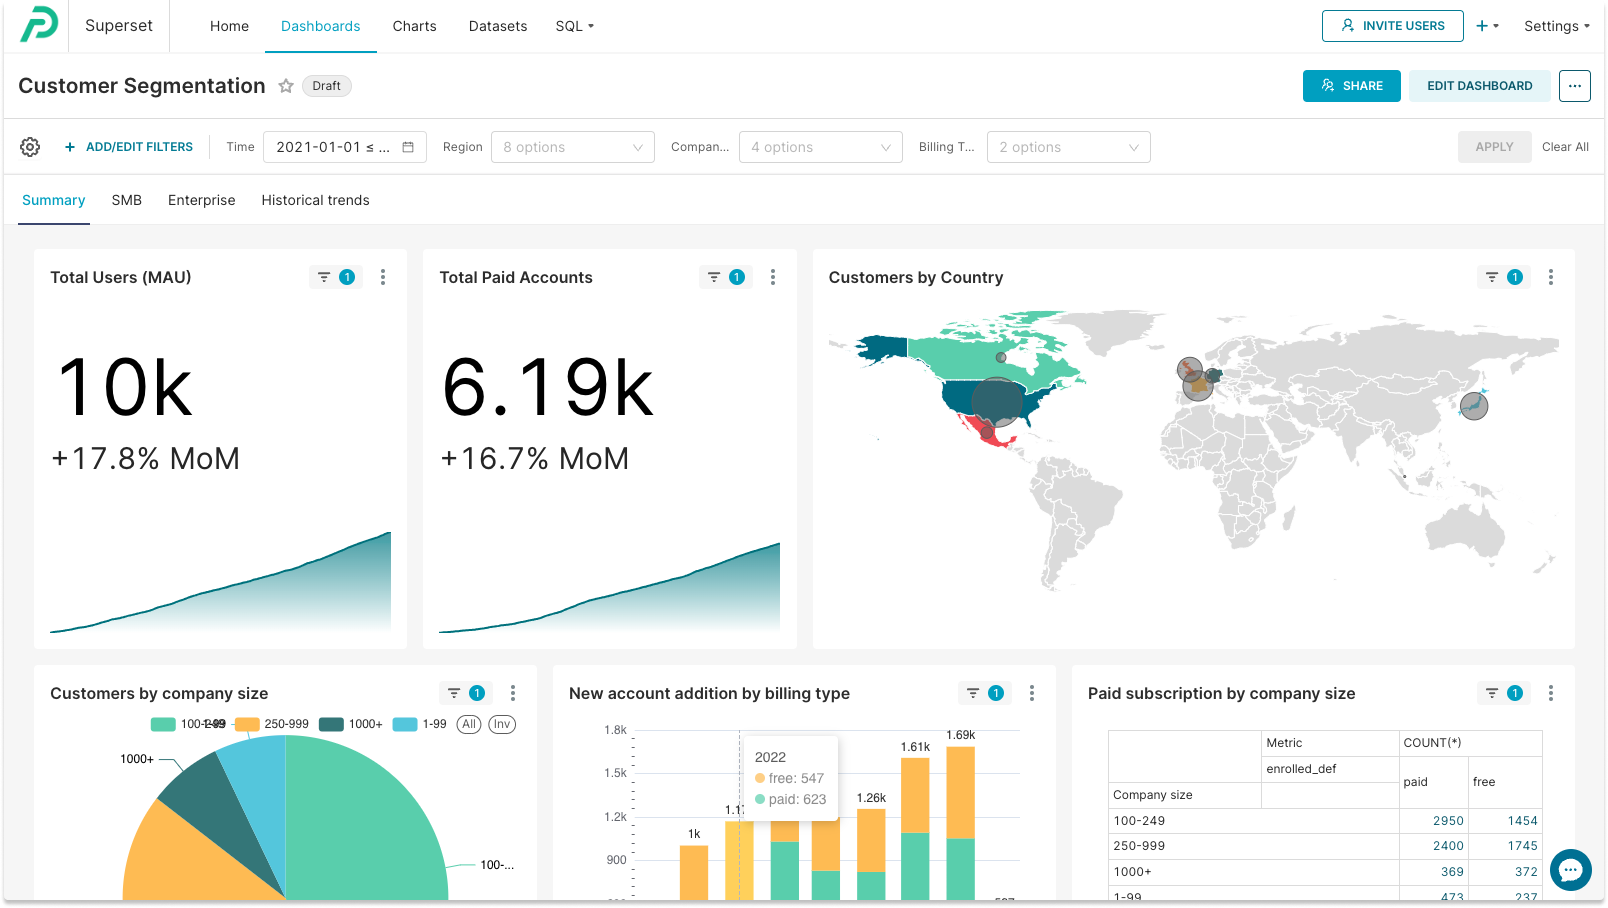
Customer Segmentation Dashboard
Businesses can create an interactive dashboard to look at their customers' segmentation by different criteria, such as company size, location, subscription types, and more.
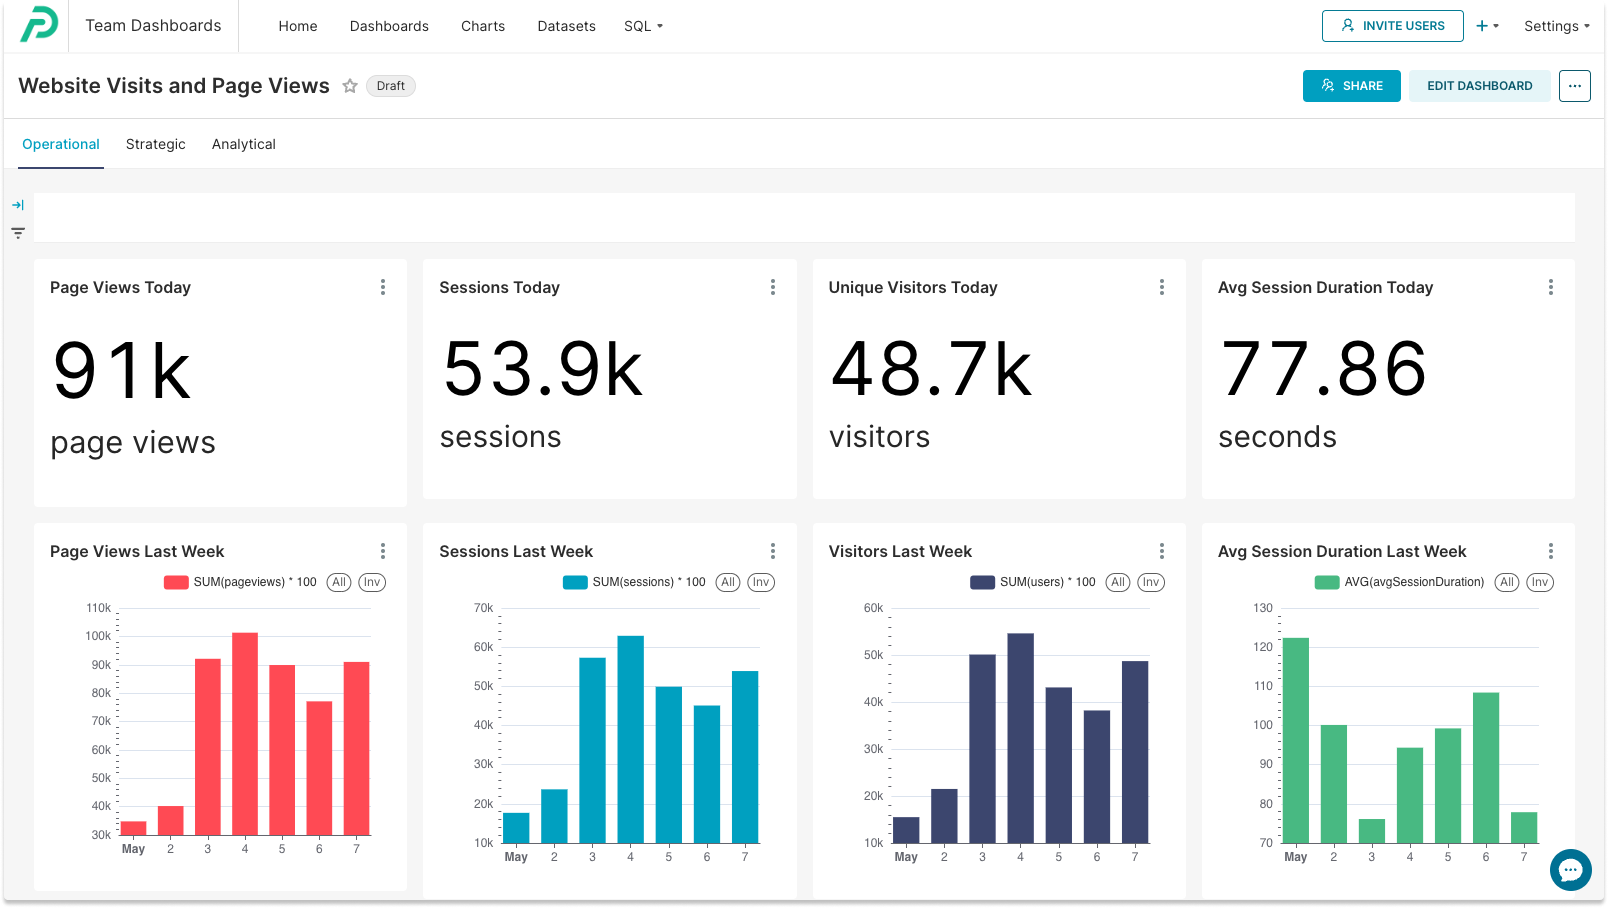
Marketing Dashboard
Having a live visualization of marketing activity and results is crucial for any organization. Marketing professionals track a vast majority of data from different sources: marketing websites, CRM, social media, campaign tools - just to name a few. The example below shows website visits and page views for a marketing website - one of the many BI reporting dashboards that marketers use for planning and analyzing their marketing strategy and everyday activities.
Cutting Edge Business Intelligence Reporting with Preset
Preset is an open, cost-effective business intelligence tool for modern teams that makes self-serve analytics faster, easier, and more approachable for every user in your organization.
Amidst various business intelligence solutions, Preset emerges as a frontrunner, distinguished by its innovative offerings. Based on open-source Apache Superset, Preset extends beyond traditional service parameters, exemplifying customizability, modern visualizations, no-code operations, self-service analytics, and expert support.
What sets Preset apart is its commitment to user empowerment. Through its intuitive platform, it democratizes data, allowing users at all levels to participate in the data dialogue, fostering a holistic, inclusive approach to business strategy formulation. For teams looking to mature their data analytics practice without the overhead of managing internal infrastructure, Preset offers a compelling and cost-effective path forward.
With its no-code visualizations, Preset reduces the technical entry barrier, enabling professionals to focus on insights rather than wrestling with complicated software operations. This ease of use, combined with expert, reliable support, makes Preset the ideal partner in your BI reporting journey.
Ready to transform your raw data into actionable insights through business intelligence reporting? Create your free Preset account to start your journey today.
