


Transitioning from Spreadsheets to Business Intelligence Tools


Spreadsheets have long been a popular tool for data analysis. They offer a familiar column-based structure, allowing users to easily add, modify, and perform calculations on data. But as data grows in size and complexity, business intelligence (BI) tools can be a more powerful, performant alternative for data exploration, collaboration, and reporting.
BI tools also support efficient, data-driven decision-making throughout your organization. While an individual may be able to create a new spreadsheet on the fly, this approach may prevent the rest of the organization from finding fresh and relevant data efficiently in a centralized manner. In contrast, BI tools promote data democratization through robust user access and data permission controls.
In this blog, we will discuss the similarities and differences between the tools and offer tips for transitioning from spreadsheets to BI tools.
Comparing spreadsheets and BI tools
BI tools, such as the open-source Apache Superset and its hosted counterpart, Preset, adopt a dataset-centric approach. This approach mirrors the way people commonly interact with spreadsheets: collecting and scraping data from various sources and then transforming the data into a presentational structure to support the story they want to tell. This workflow closely resembles what data teams accomplish through data pipelines, transformation tools, and semantic layers.
The dataset-centric approach is beneficial for business users and analysts who are accustomed to working with spreadsheets. This approach organizes data in a familiar tabular structure, allowing users to interact with data much like they would with rows and columns in a spreadsheet. Moreover, data manipulation is straightforward in both cases, making it easy to edit, perform calculations, and add data directly from the user interface.
When dealing with larger and more complex datasets that require regular data refreshes and updates, there is a strong case for using BI tools over spreadsheets. Here are the key benefits of using BI tools:
- Performing analysis on larger, more complex data: With BI tools, you can quickly identify trends within millions or billions of data points, as opposed to being confined to data that fits within a scrollable view.
- Consistent business metrics: You would never have to guess or reconcile whose calculation of revenue or active users is correct because everyone would be working off of the standardized metrics and calculations defined in the semantic layer.
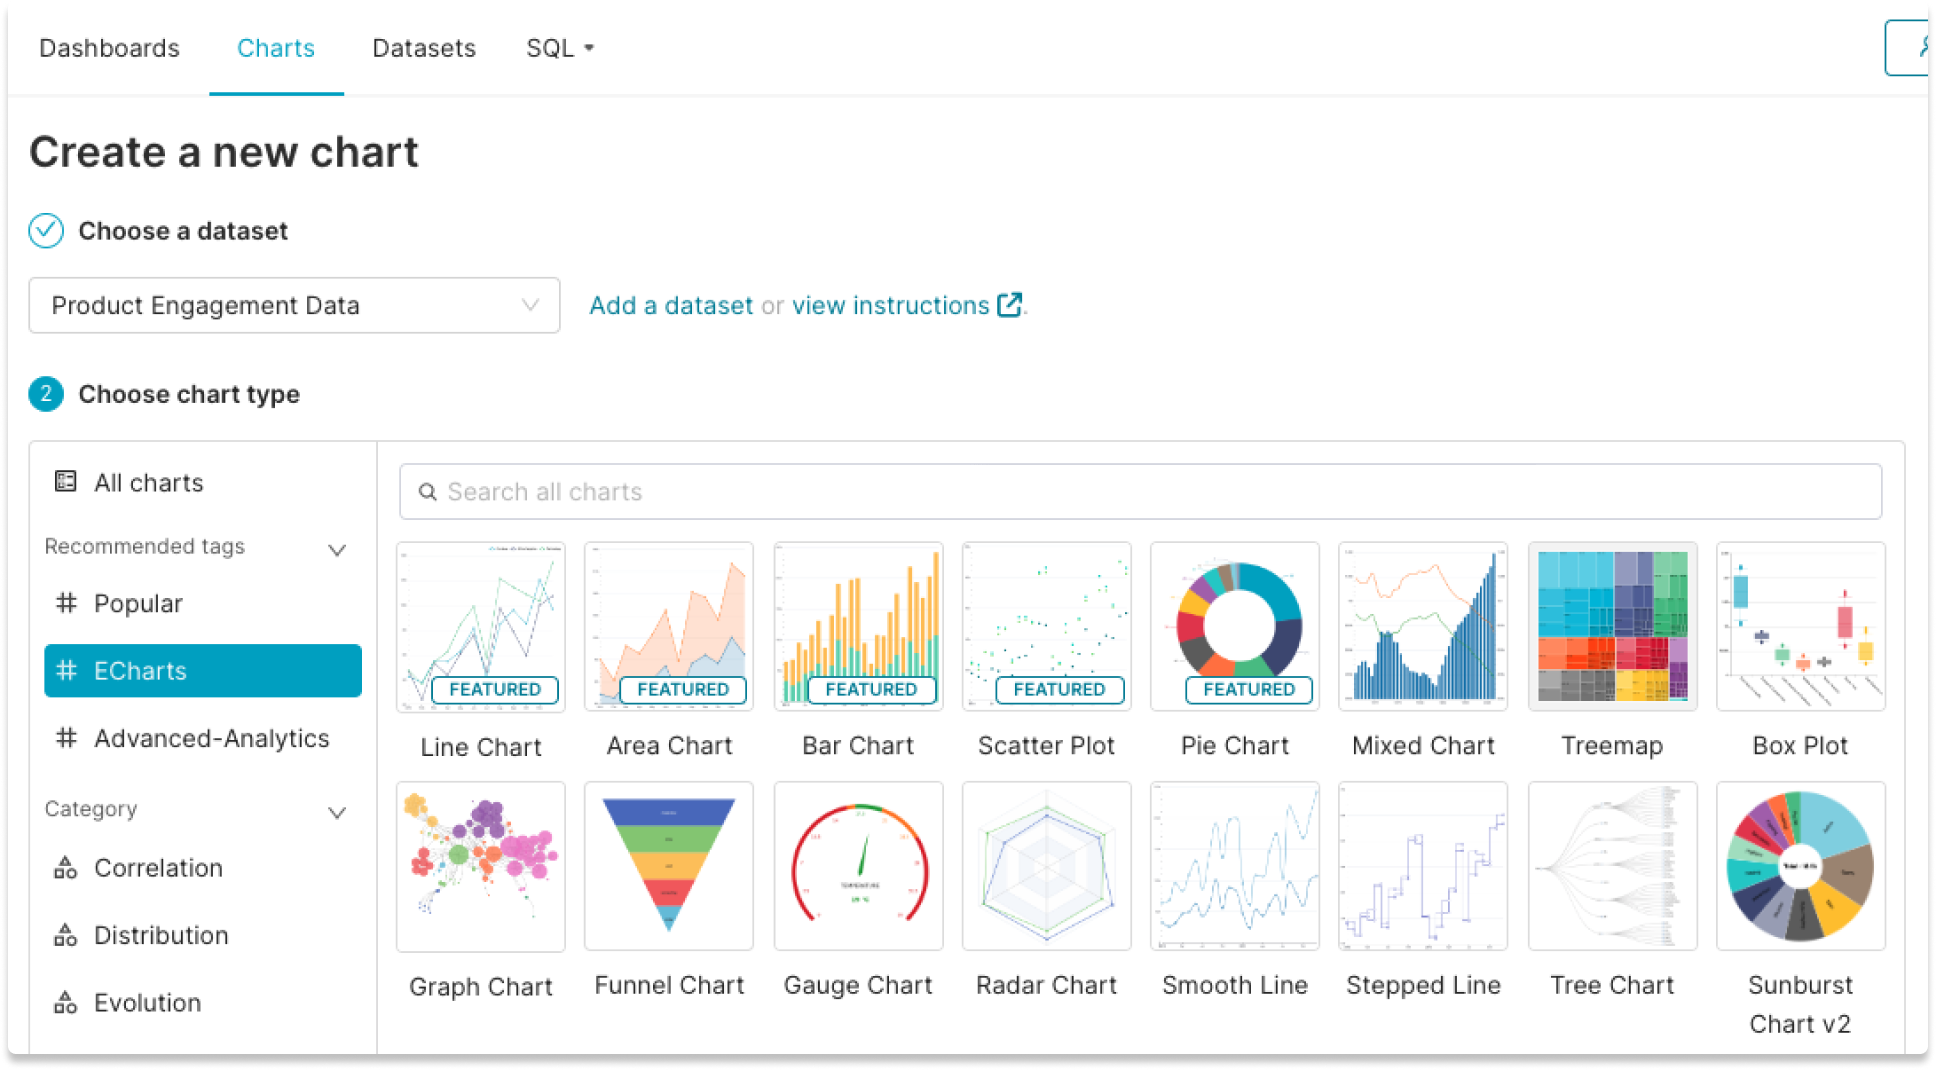
- Enhanced data visualizations: BI tools offer an extensive library of pre-installed charts, graphs, and tables to choose from. The selection may include fundamental chart types like line, area, and bar charts, as well as more specialized chart types such as funnel charts, radar charts, and treemaps.
Figure 1: Pre-installed visualization types in Apache Superset and Preset.
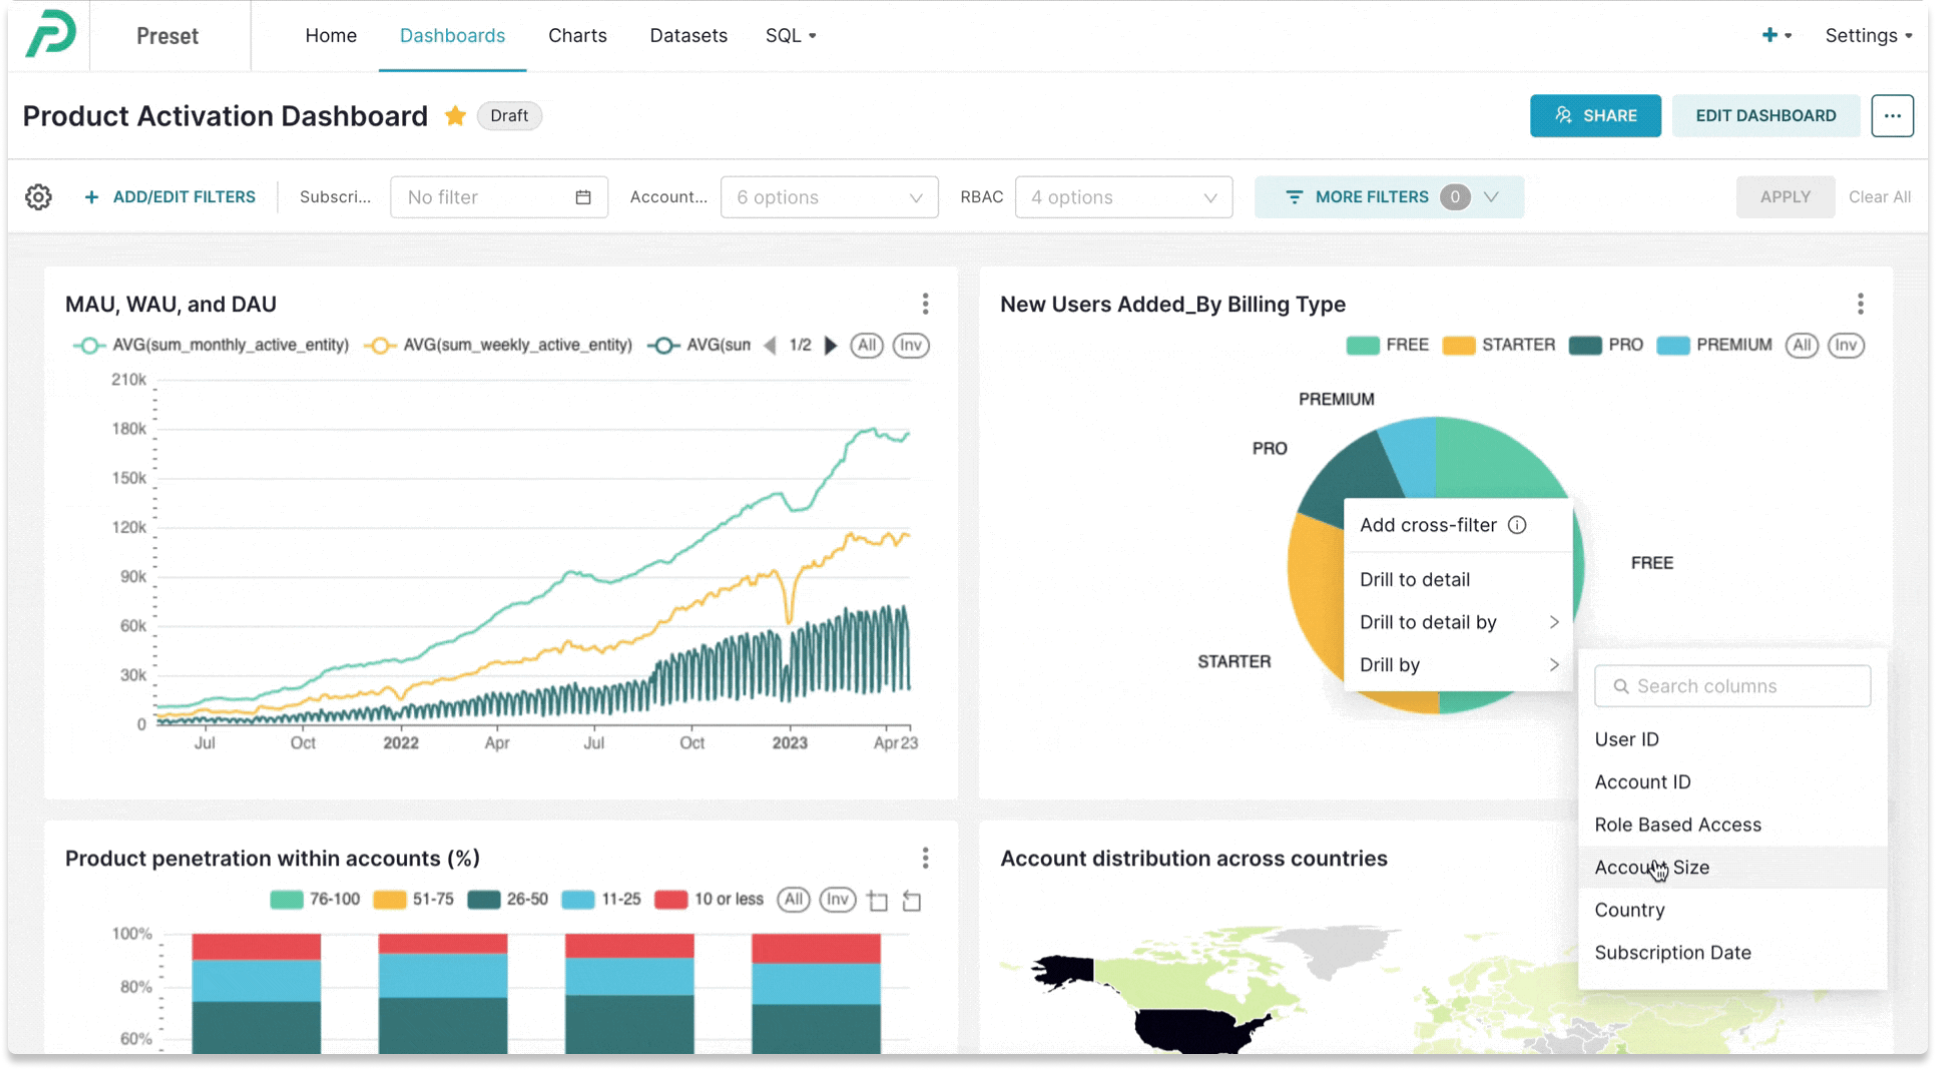
- Interactive dashboards for advanced data exploration: You can create interactive dashboards with multiple charts and tables, making it easy to communicate stories and insights. BI tools also offer advanced data exploration features, including filters, data drilling, and the ability to query data to answer specific questions using SQL or natural language (text-to-SQL).
Figure 2: Performing a data drilling (Drill By) operation on a product metrics dashboard.
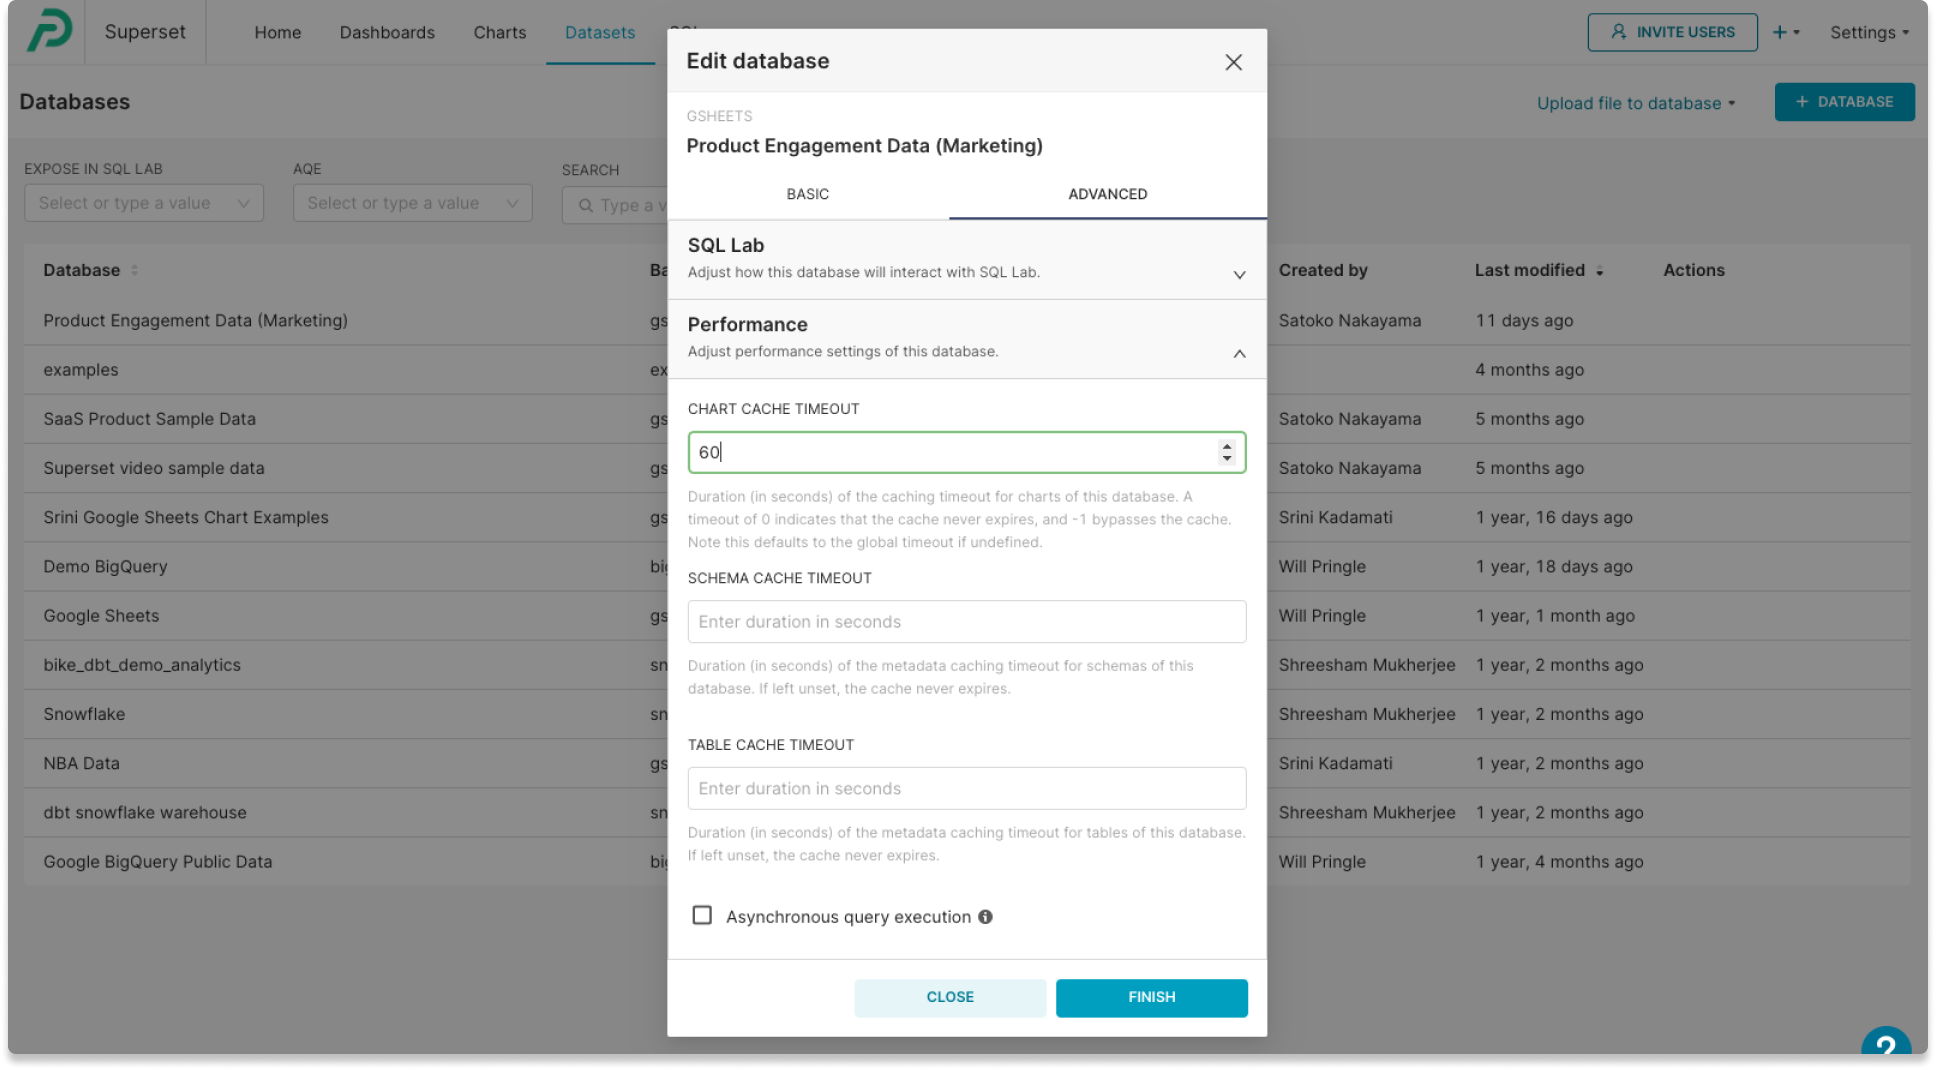
- Real-time data connection: BI tools support real-time or scheduled data updates, ensuring that visualizations always reflect the most current information without manual intervention.
Figure 3: Define how often you want to refresh the underlying data connection through cache settings.
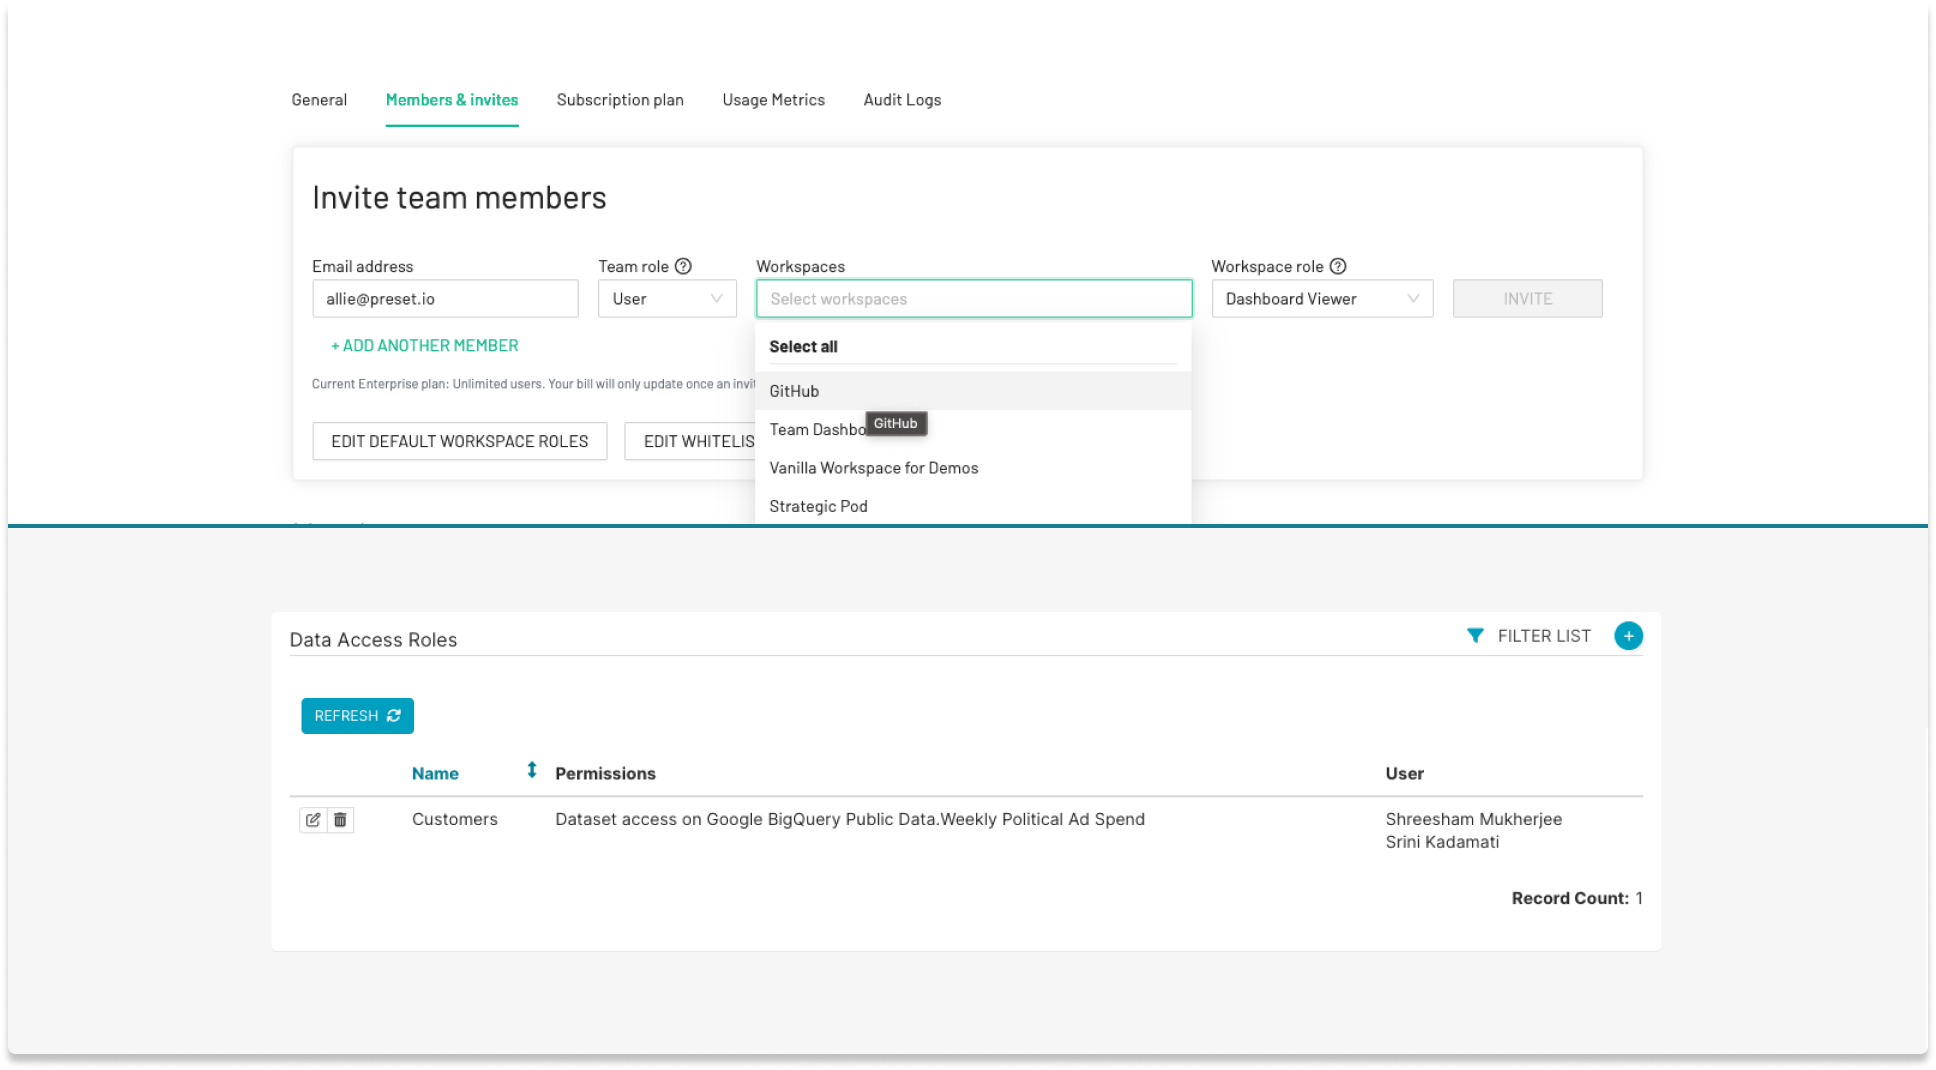
- More collaboration across teams: Because datasets, dashboards, and reports are centralized in one platform, you can easily find the data and metrics you are looking for without relying on the centralized data teams or teammates. Data permissions can also be managed down to the row level to protect sensitive information. Say goodbye to the frustration of searching for a missing spreadsheet or dealing with permission issues when your colleague is out of the office!
Figure 4: Easily define which dashboards and data each user can access.
However, transitioning from spreadsheets to visualization platforms can pose challenges in two areas:
- Data preparation: Proper datasets are essential for maximizing the benefits of BI tools. Inadequate dataset setup can prevent users from creating the desired charts and dashboards.
- Flexibility: Spreadsheets are incredibly flexible and well-suited for a wide range of tasks including making quick, one-time edits to columns. In contrast, working with datasets in BI tools, which are essentially table views of your database, can be challenging when attempting to make on-the-fly, ad-hoc changes to the underlying data.
In the sections below, we will address how you can tackle these challenges using Preset.
Best practices for creating and editing datasets
Preparing datasets
Datasets are curated representations of data stored in your database, providing unified metric definitions for your organization’s charts and dashboards. In addition to 'raw' data, datasets contain semantics, which include labels, calculations, metrics, and other attributes that define the meaning and usage of your data.
Each chart you create may require different columns from your dataset. We encourage you to be selective and include only the data that is relevant to your visualizations for faster performance and a smoother chart creation experience.
The most common way to create a dataset is from a SQL database or a query engine (such as MySQL, BigQuery, PostgreSQL, etc.), which is usually set up by centralized data teams.
For business users coming from spreadsheets, they can actually use spreadsheets as sources of data for datasets in Preset! This approach does not require upfront work by centralized data teams and can help users jump-start their analytics. Today, Preset supports Google Sheets and CSV files as data sources.
- Google Sheets: Users can easily connect Google Sheets as data sources with just a few clicks from the product UI. Because the data feed is live, datasets created from Google Sheets are updated every time you make changes to Google Sheets.
- CSV files: Users can upload CSV files without connecting to any databases (this feature is unique to Preset; in open-source Apache Superset, you cannot upload CSV files without first making data connections).
Once your data source is connected, you can create a dataset from the product user interface (UI). You may be asked to select the database schema and table (this step is often handled by your data team for most databases, and business users won't have to worry about it). If you're connecting Google Sheets or uploading a CSV file, you will only see one option.
As a default, all available columns from your data sources will be displayed in the dataset. In Preset, you can easily edit and customize the data columns just as you would in spreadsheets.
For example:
- Selecting or removing the columns, so that your dataset contains only the data you need for charts and dashboards (this would optimize for performance).
- Labeling, renaming, or adding descriptions to column names, so you can easily identify them when building charts, applying dashboard filters, or drilling into data.
- Turning columns into a temporal data type and defining datetime format.
- Defining which columns can be used for interactive dashboard functionalities, such as filters and Drill By operations.
- Creating metrics using Excel-like formula operations (e.g.,
IFandSUM IFfunctions) (note: the functions/operators may be different in Preset). - Formatting metrics (e.g., defining currency format).
- Applying conditional formatting.
- Performing calculations and adding calculated columns.
Flexibility: Making Ad-Hoc Edits
It's easy to make ad-hoc edits if datasets are created from spreadsheets like Google Sheets or CSV files. You can modify columns, add calculations, or define metrics in your source file first and then sync them to Preset.
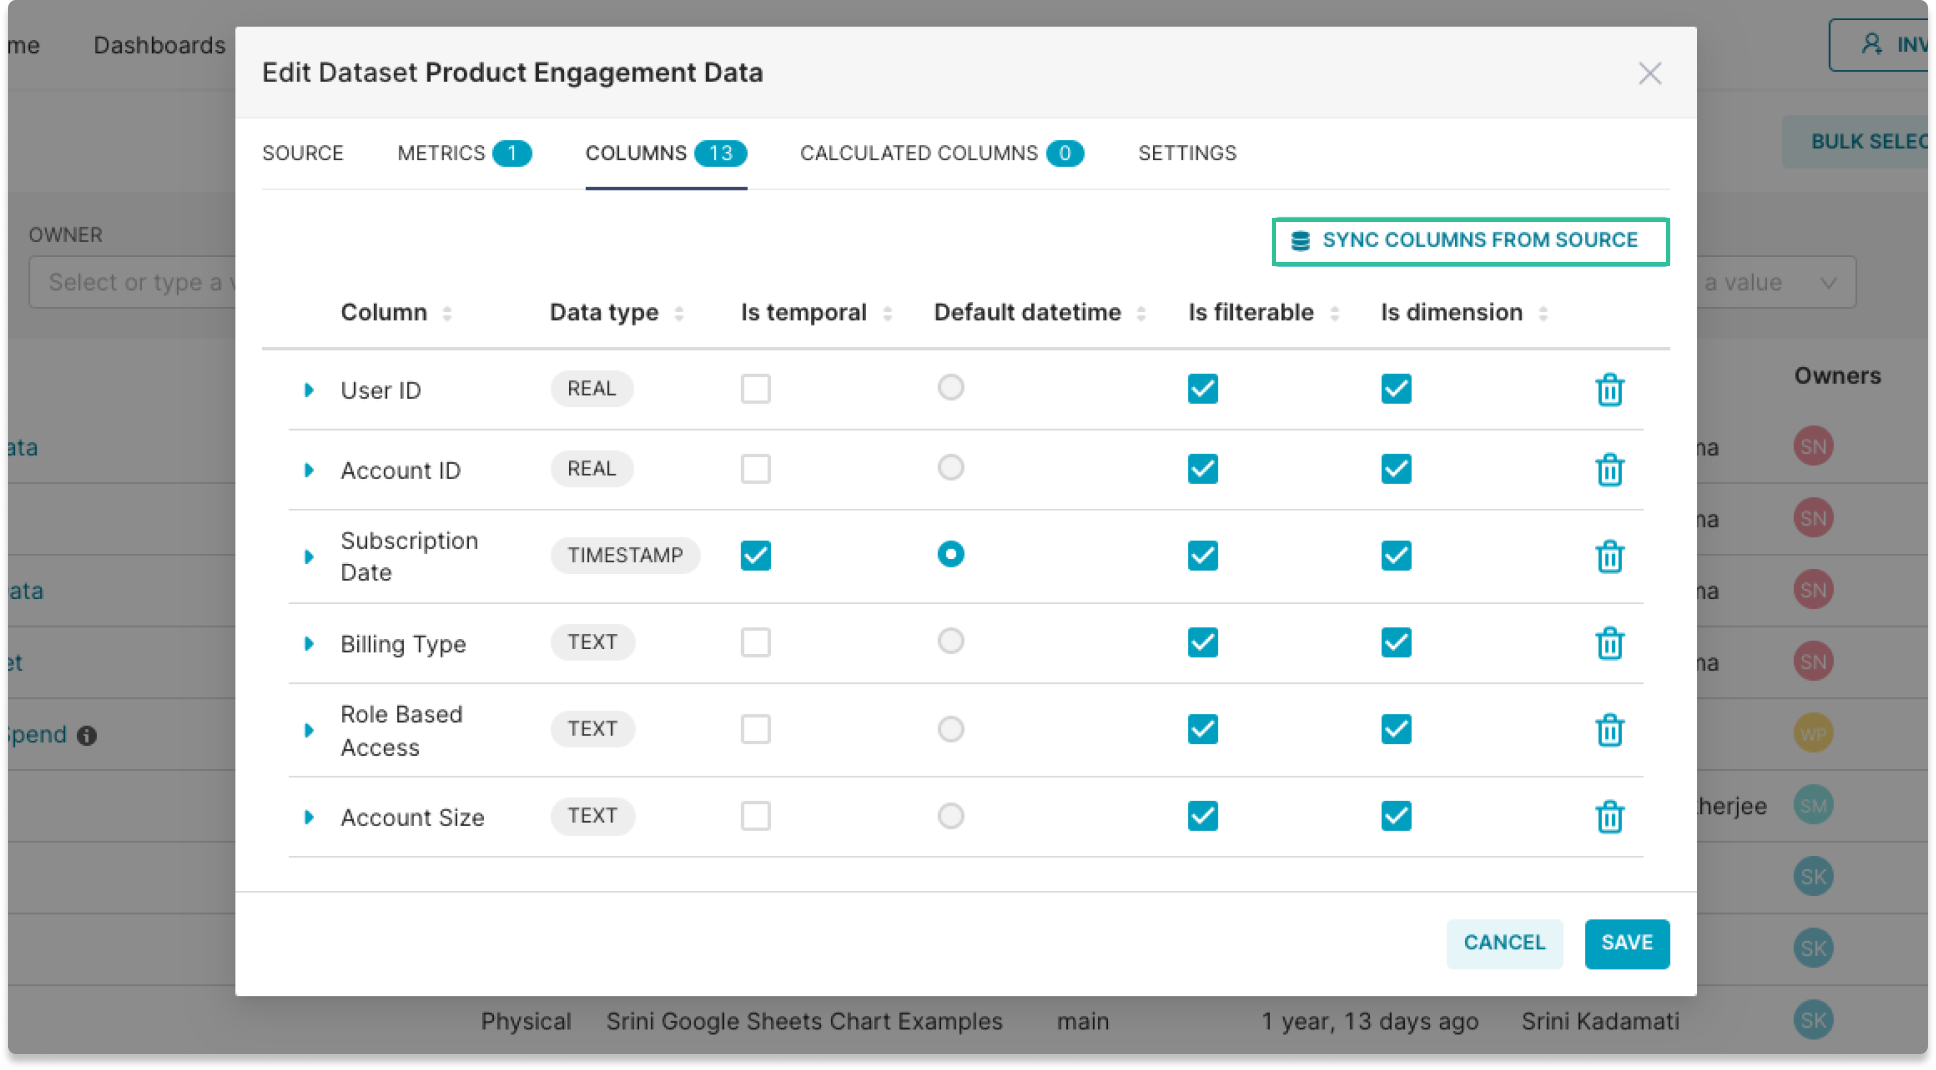
- Editing Google Sheets: After editing, users can go to the “Edit Dataset” modal on the Dataset page in Preset to ensure any new additional columns are selected. Saving changes will update the existing datasets.
Figure 5: Sync updated columns to Preset's datasets with a click.
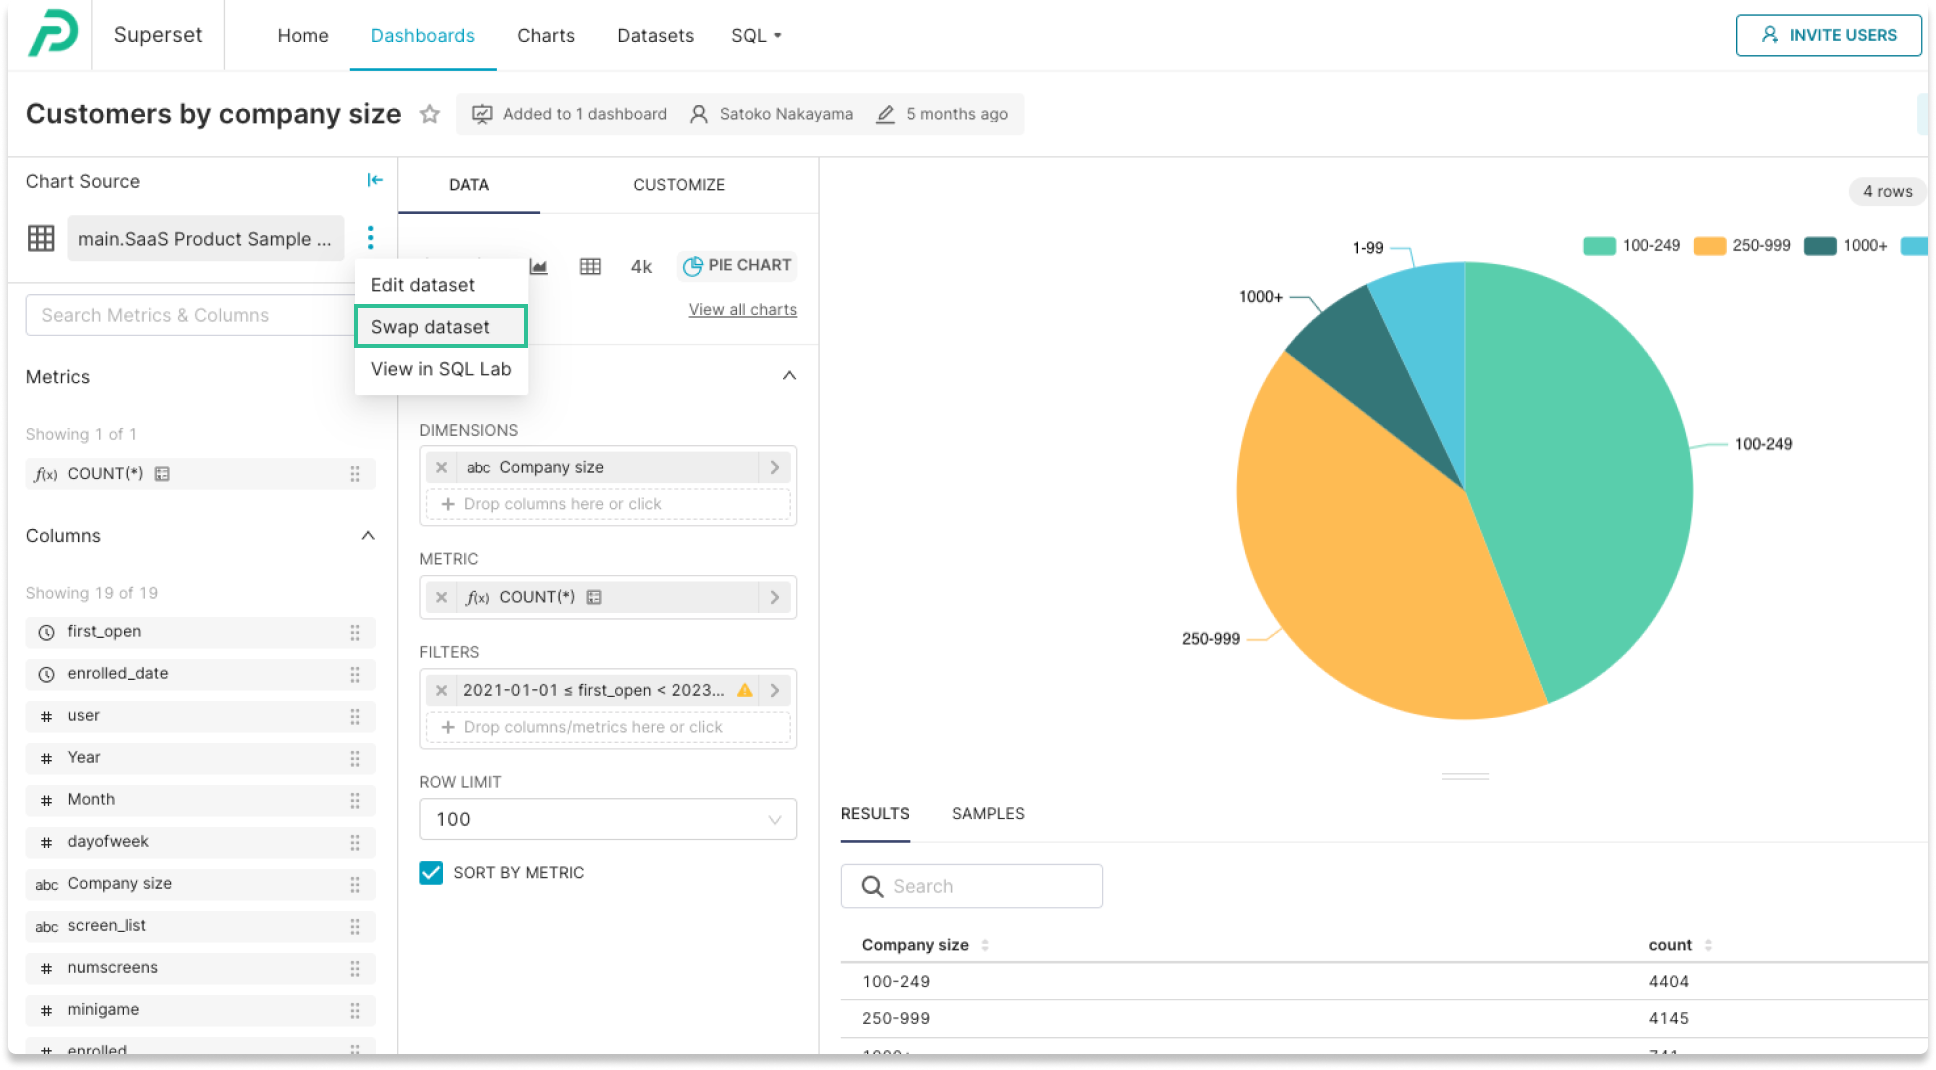
- CSV files: If you have a revised CSV file, you can create a new dataset by uploading the new CSV file. If you have existing charts that are built off of the previous dataset, you can easily swap the source data with the new dataset.
Figure 6: Swap a chart's underlying dataset with a click.
Let’s get started!
Transitioning from spreadsheets to BI and visualization tools can significantly enhance your team’s data analysis capabilities.
Create a free account to get started with Preset. You can immediately start creating charts, tables, and dashboards from Google Sheets and CSV files without the help of centralized data teams.
