


What's New in Preset


The Preset team has been hard at work improving the product experience these past few months. Today, we're excited to provide an overview of all of the cool things we've released.
We'll be publishing more regular updates on new features and enhancements on this blog and through email, so make sure to click Subscribe next to this post's title to stay up to date!
Announcements
Preset Managed Private Cloud
With Preset Managed Private Cloud (MPC), you can deploy Preset workspaces inside your own AWS private cloud as a fully managed solution! This offering is ideal for teams currently managing Superset by themselves who no longer want to, but still need all relevant data to live within their own VPC (or virtual private cloud). Learn more about MPC here
dbt Integration

Preset now integrates with dbt core! You can now define databases, datasets, and metrics definitions in dbt and sync them to Preset using the Preset CLI. This will not only help modern data teams adopt dataset-centric visualization more easily, but it will also help them adopt change management practices around core databases and datasets to prevent data drift and broken Preset dashboards. Learn more about the integration here.
Databricks Partner Connect
Preset Cloud is now available as part of Databricks Partner Connect! With just a few clicks, you can now automatically connect your Databricks workspace to Preset Cloud and immediately start exploring and building charts and dashboards. Learn more about the new experience here.
New Features
Charting and Dashboarding Experience
Quick visualization switcher in the chart builder: we've lowered the friction to switching chart types from within the chart builder. You can now switch between the most common chart types in just one click and all of your existing, relevant chart customizations will carry over automatically. This new experience helps make experimenting with different chart types a joy, encouraging you to find the right type of visualization to convey your insights.
One click chart editing and exploration from a dashboard: clicking the title of a chart takes you immediately to the chart builder. The increased speed to editing and updating charts will help you keep dashboards up to date and will help you take action closer to the speed of thought.
Major upgrades to the user experience of dashboard filters: dashboard filters in Preset have made huge strides! Dashboard filters load more quickly and are more responsive to user input. In addition, it's much easier to define filters that depend on the existing selections of another filter (also known as dependent or cascading filters). Both of these features help close gaps between Preset and other BI tools and make dashboards feel more like rich applications.
Color consistency for metrics within a dashboard: you can now assign a color to a particular series and all instances of that series will automatically have the same color. This will improve the ability of end-users to better compare across multiple charts in a dashboard.
To try out all of these new features, head to your workspace
Visualization Enhancements 📈
Add support for multiple results tabs in Mixed Time-series chart: both the chart builder and dashboard view render both sets of queries and both sets of query results when using Mixed Time-series charts. This will help you debug issues in your queries and charts better when working with this chart type.
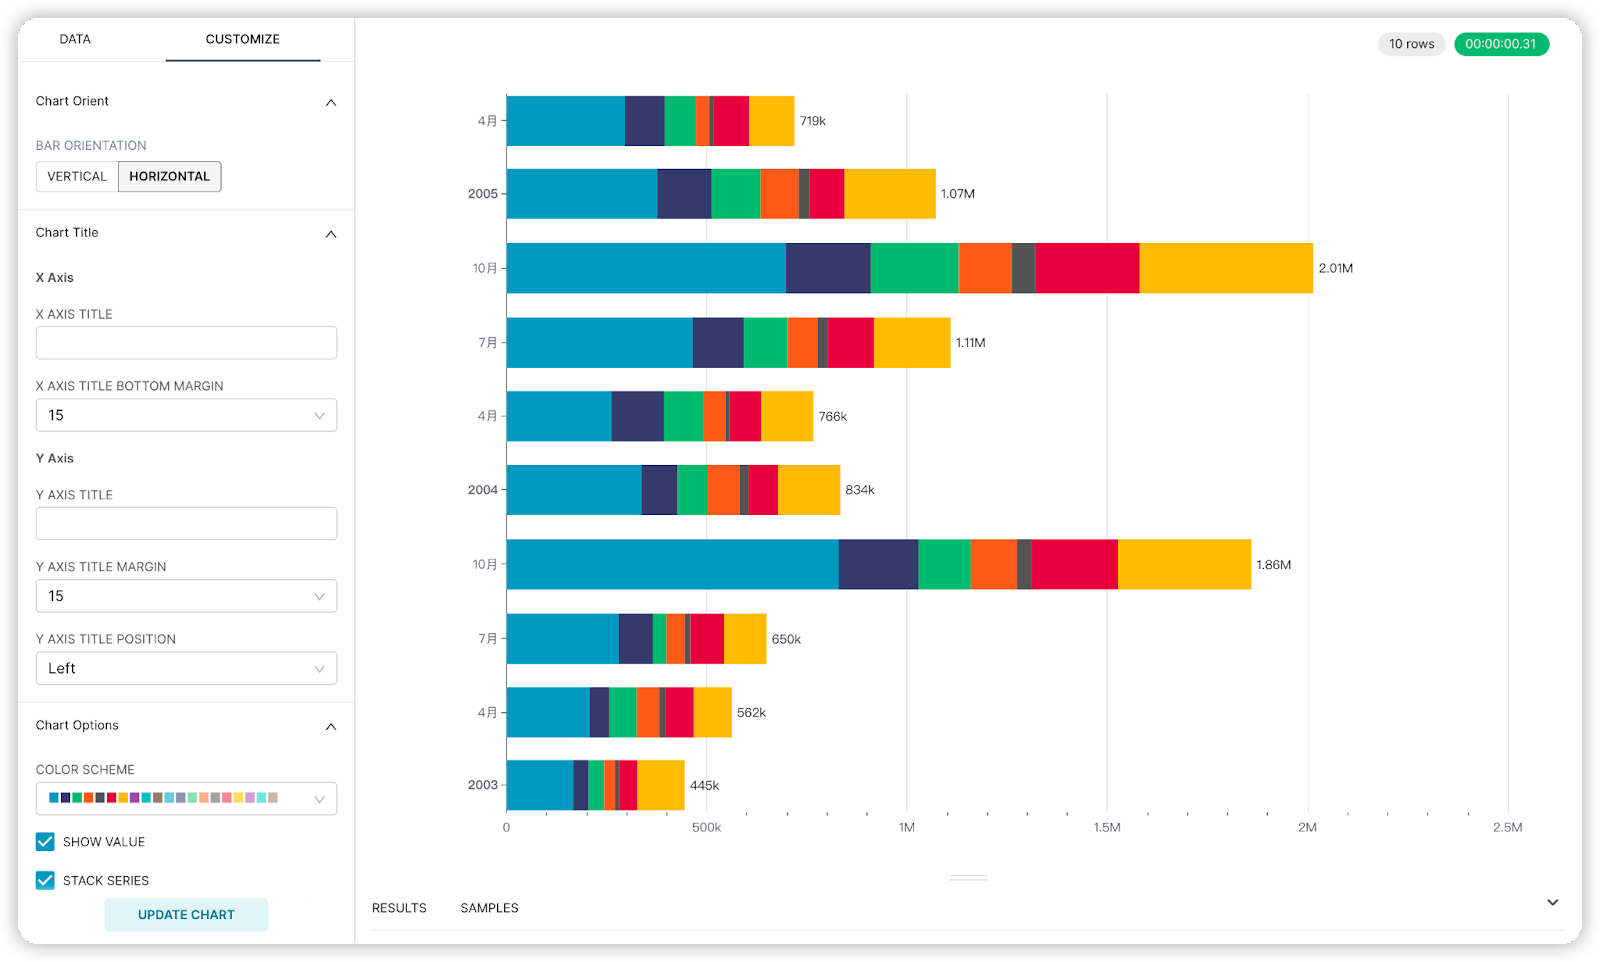
By popular request, Preset now supports Horizontal Bar Charts! When engaging the Time Series Bar Chart v2 visualization, select “Horizontal” under the customize tab and start seeing your bar charts in a whole new light.
Preset API & CLI
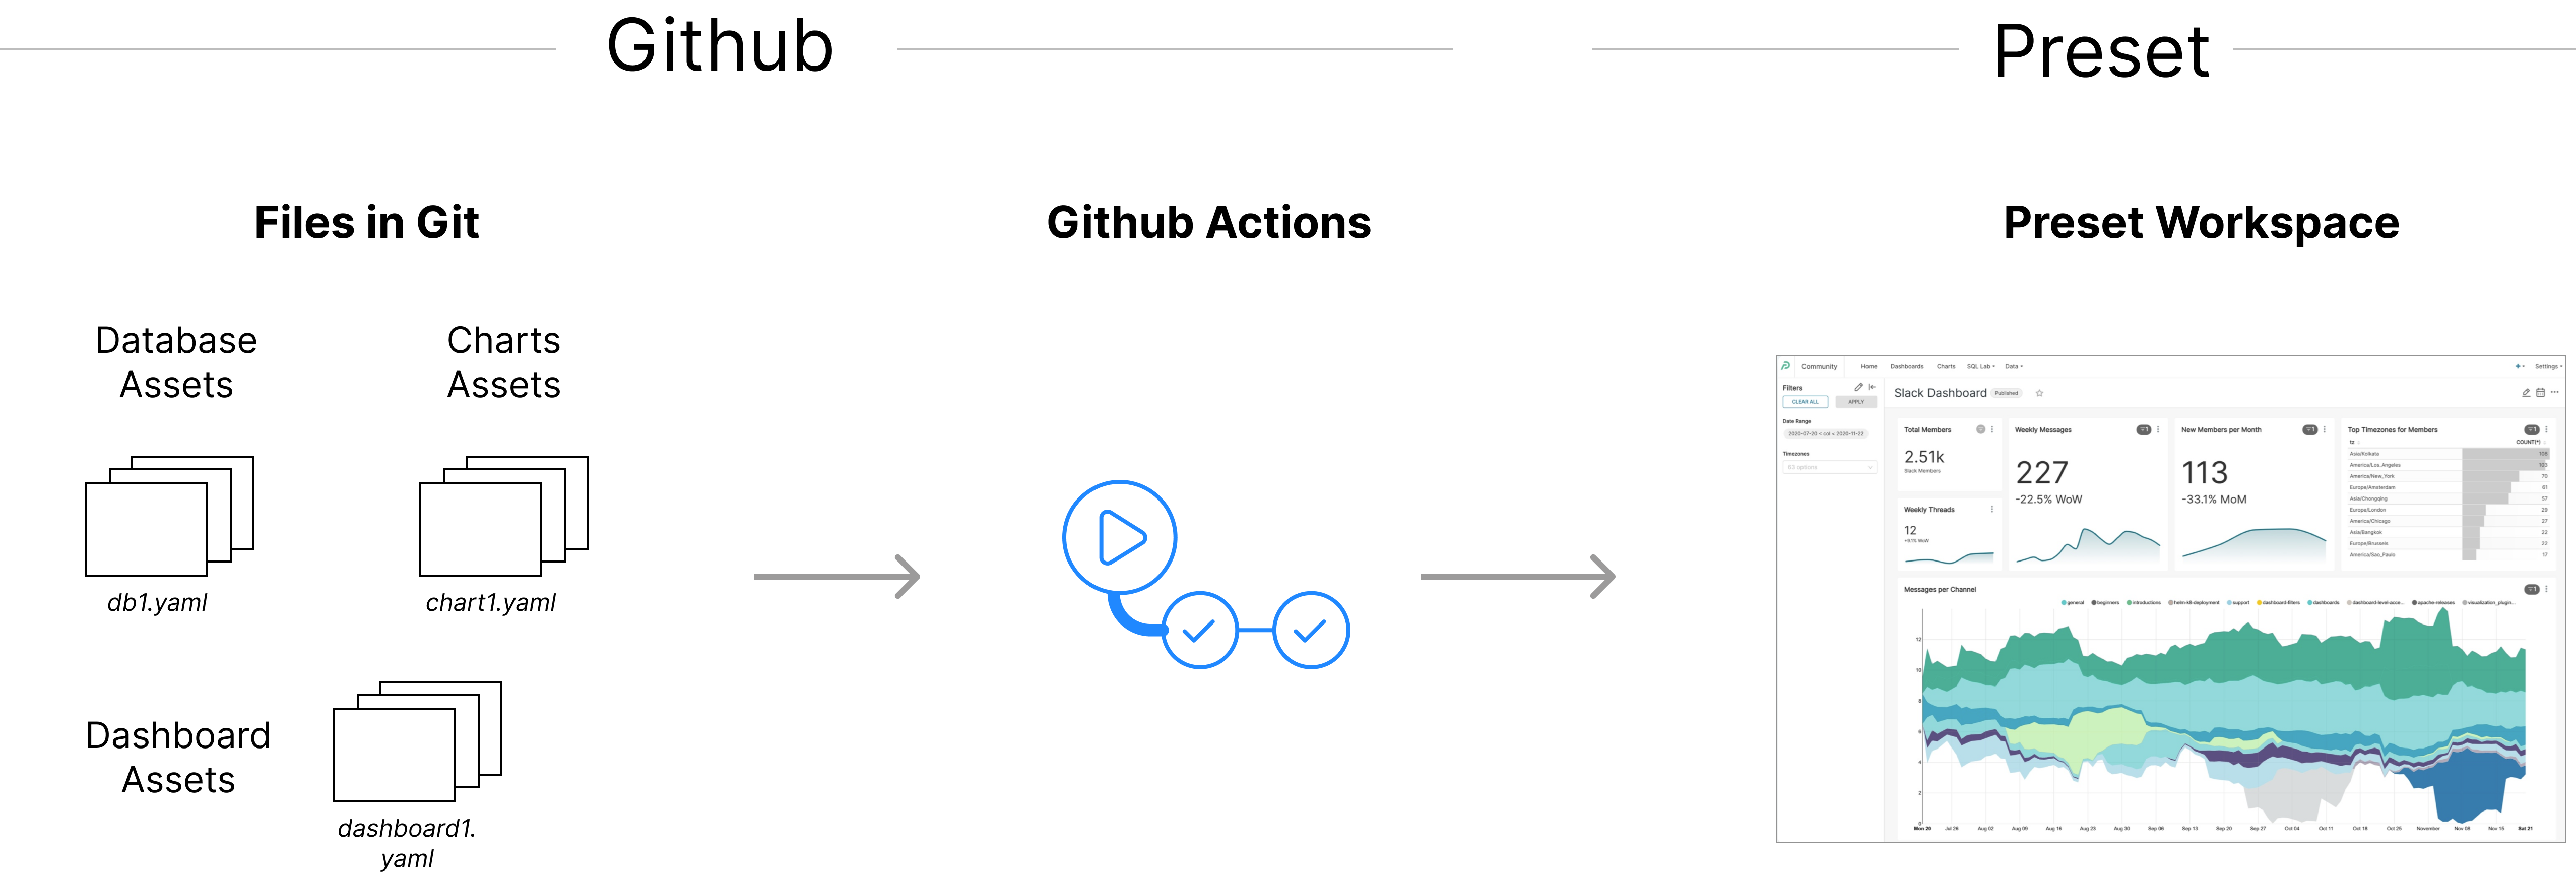
Preset CLI now supports dashboards-as-code workflow: the Preset CLI makes it easy for you to interact with the Preset API programmatically. You can now define your databases, datasets, charts, and metrics in version control (e.g. in a git repo) and sync them to a Preset workspace. You can go even further and centralize these definitions in dbt or even use Preset as a data access layer for your other applications. (Enterprise Only: request access here)
SQL Lab
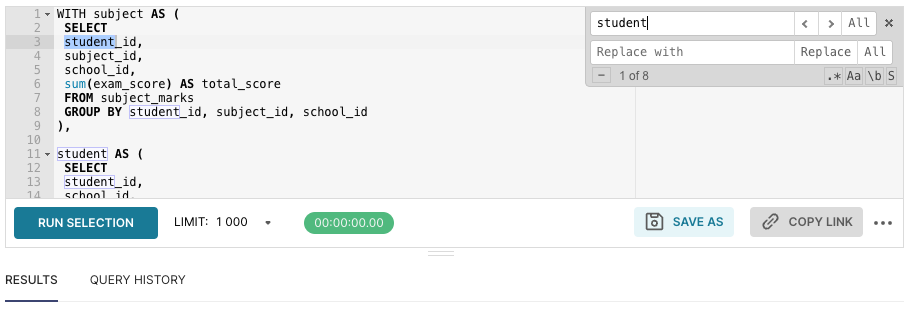
Search in SQL Lab: SQL Lab, Preset's SQL IDE, now has a rich find and replace tool native to the interface. This will help you track down clauses in long SQL queries and help you fix errors you encounter in your syntax.
Preset Manager
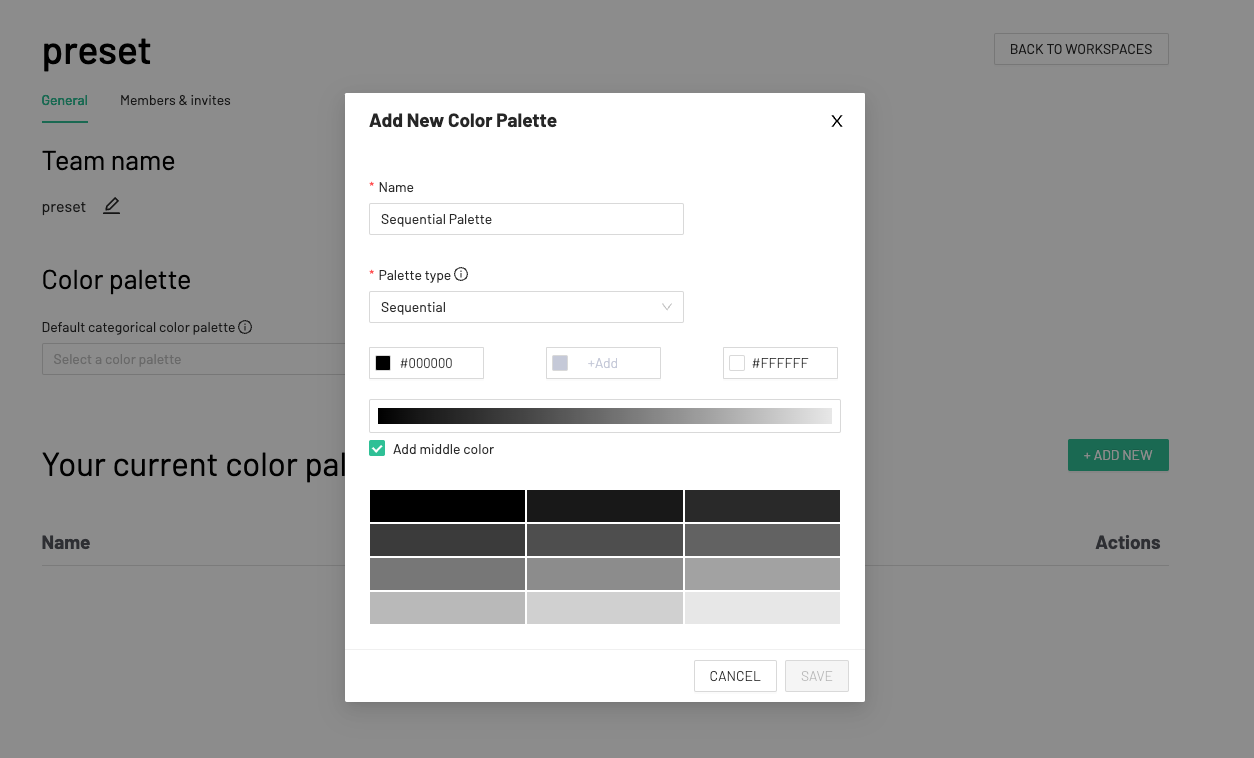
Customize the logo and color palettes in your workspace: you can now change the logo that's displayed in the top left corner of your workspace. You can also define workspace wide color palettes to ensure more consistent styling and branding. (Enterprise Only: request access here)
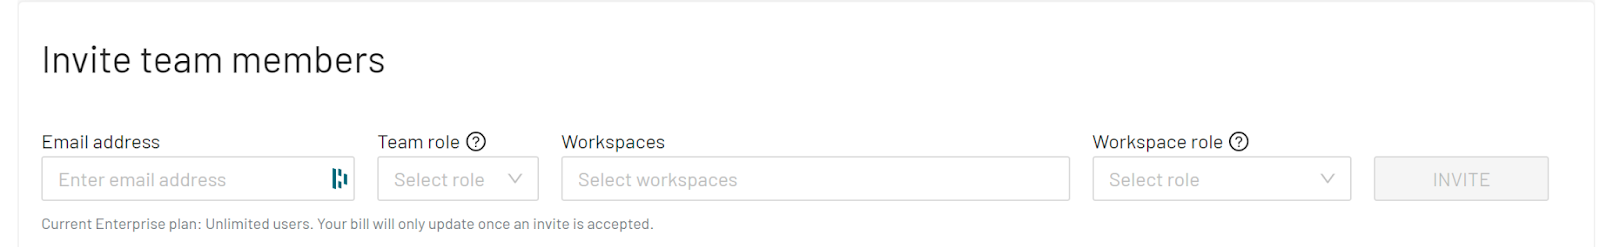
You can now assign roles to members when inviting them to your workspace
Get access to query logs. Charts and dashboards overwhelming your database? Query logs can help you understand which users and queries are slowing down your database. (Enterprise Only: request access here)
All Other Enhancements
- Dashboards: Allow viewers to export CSV's from Charts and Dashboards
- Alerts & Reports: We added modified dates and support for multiple time zones in our Alerts & Reports
- Sharing: New permalinks for easier sharing of dashboards with others!
- Chart Building: Improved chart building UI and drag and drop functionality for metrics, dimensions, and filters
- New timestamps: All of the timestamps in the Data Pane default to an easily readable format instead of epochs
- UI: Added product confirmation on core product actions, improved error messaging
- UI: Enhanced empty states to give users additional guidance in charts, dashboards, SQL lab
- SQL Lab: Enabled sorting on SQL Lab query results of 50+ columns
- Viz: Aggregated numbers on pie chart: Pie Chart metrics are aggregated for easier understanding of the underlying data
- Manager: Manager has a new mobile experience that makes it easy to view your workspaces
- Manager UI Changes: New Manage Team & Invite Settings tab
- Mixed Time-series Charts: Allow users to customize the display of the secondary Y axis
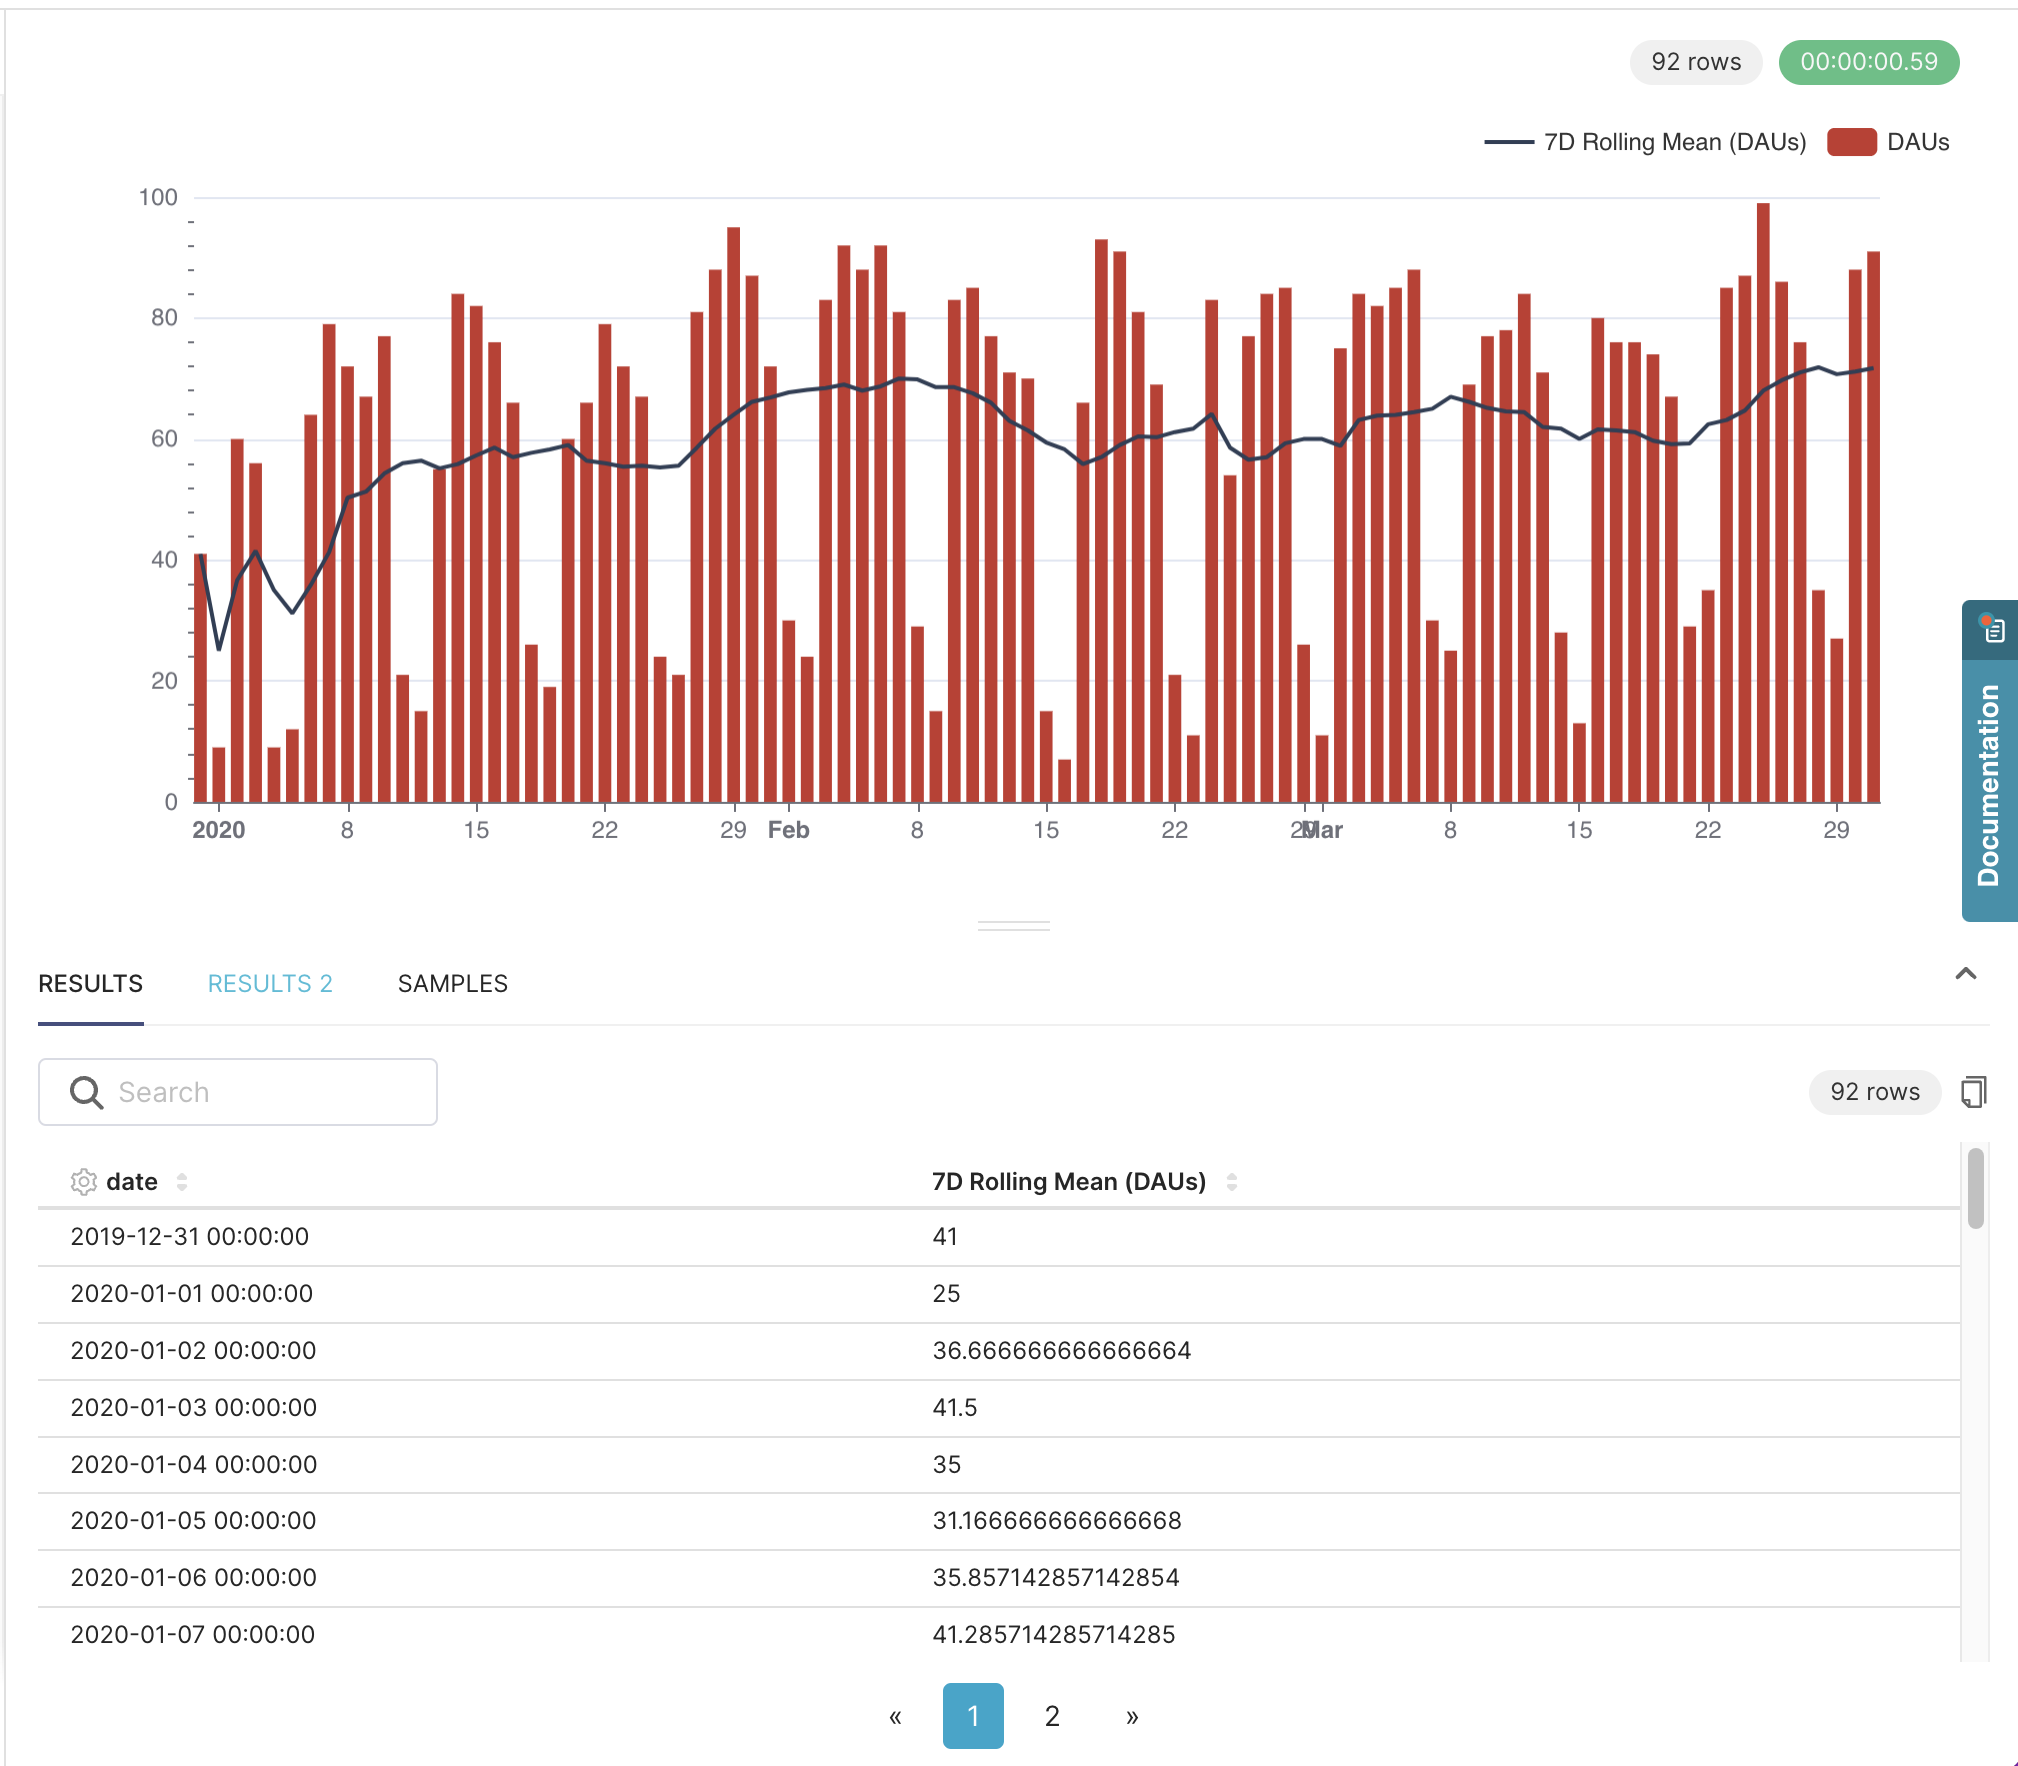
- Mixed Time-series Charts: Now supports Advanced Analytics (e.g. like rolling sum or mean)
Excited to try out these features? Head over to your Preset workspace now and get started!
