


What's New in Preset - Spring 2023


Discover the latest product features and enhancements from Preset's recent releases. You can find a quarterly recap below, or check out the full list of new features, improvements, and bug fixes in our changelog updated bi-weekly.
Don't miss out on our future announcements - click Subscribe next to this post's title to stay informed!
Announcement
Cross-filtering is available to all users by default, empowering self-serve data exploration: Users with any workspace-level role can now apply cross-filters to dashboards, allowing them to gain insights into data nuances and tell their stories more effectively. Cross-filtering enables you to interact with a chart or a table and apply the same filters to other visualizations in the dashboard, without the need to set up persistent filters in the dashboard filter bar.
Key cross-filtering updates include:
- You can immediately apply cross-filters to the dashboards, eliminating the need for chart creators (owners) to mark a chart as usable for cross-filtering. Note that the chart owners can still disable cross-filtering functionality at their discretion.
- You can easily see applied cross-filters in the vertical and horizontal filter bars.
- Cross-filtering is no longer accessible through the Chart Builder view.
New Features
Self-Serve Analytics
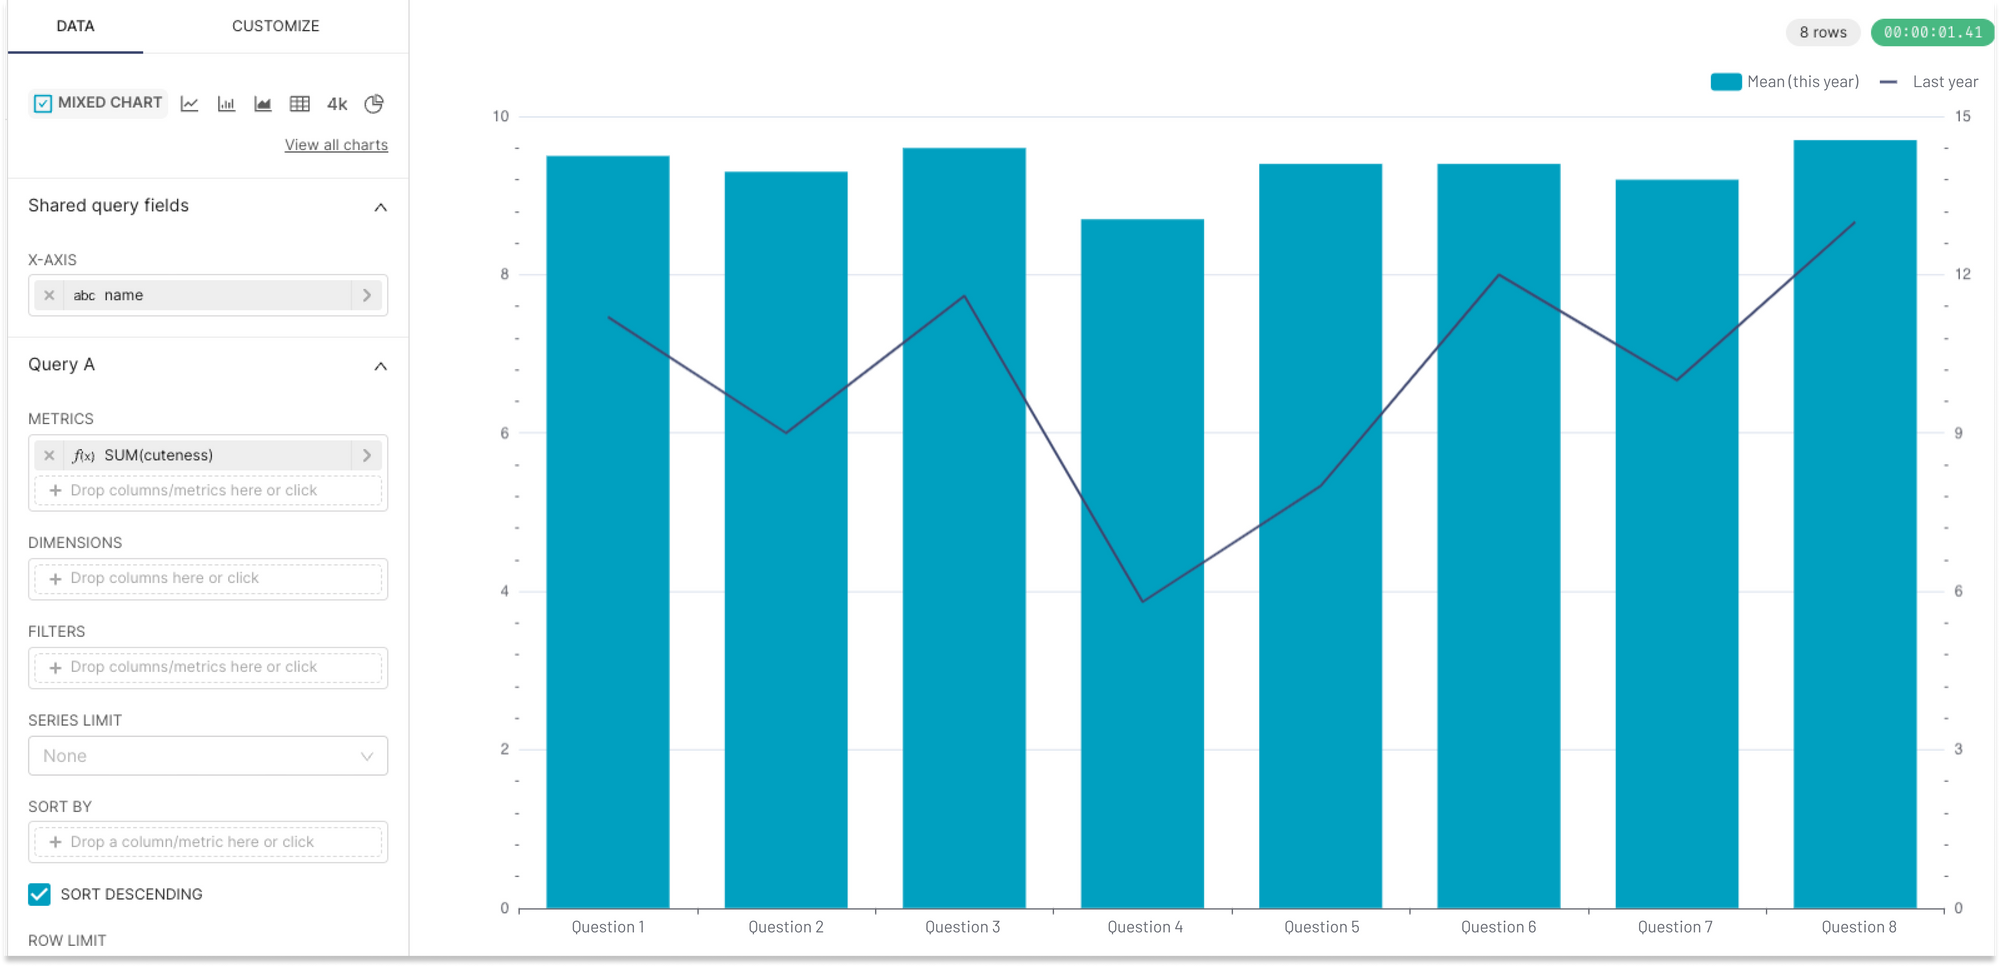
- Non-temporal X-axis is now generally available (GA). The updated X-axis allows you to visualize trends and patterns over variables beyond temporal dimensions in Preset charts (formally known as time-series charts). This feature was in beta and is generally available (GA), with chart names and the Chart Builder interactions updated. Read our blog to discover what's changed in detail.
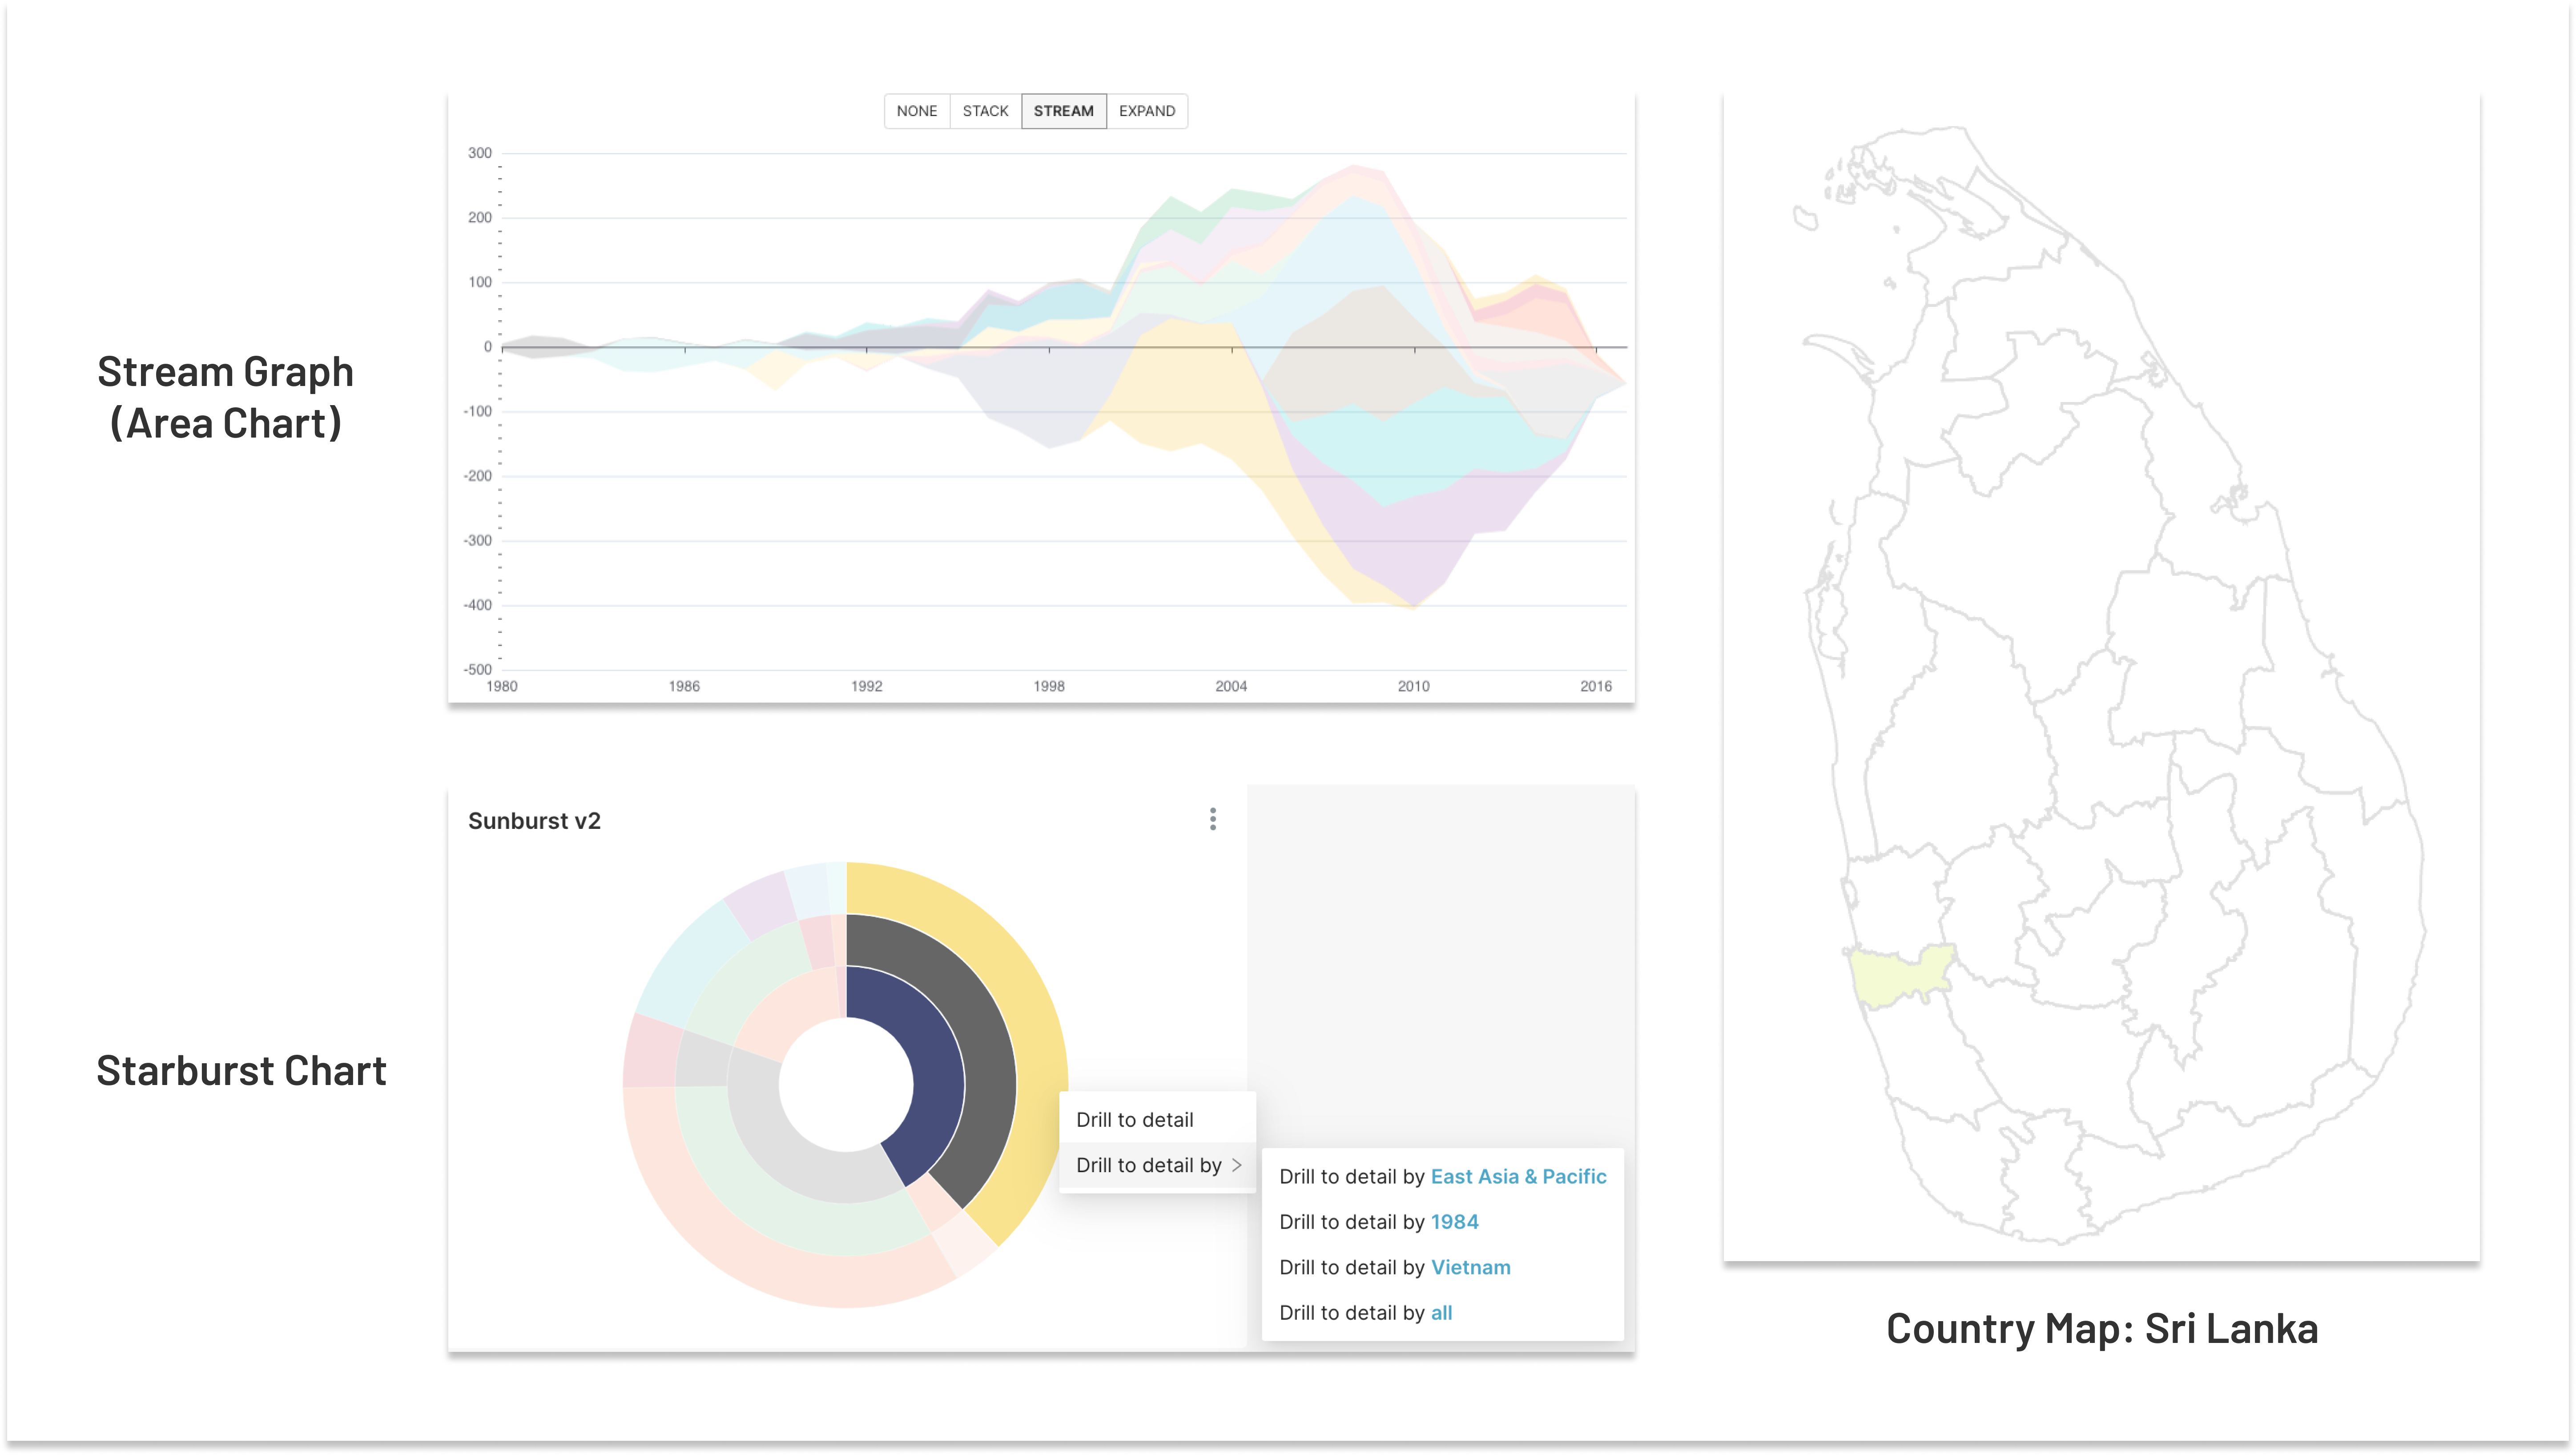
- Explore your data with new visualization options: Preset’s pre-installed chart library now offers Apache EChart’s Sunburst Chart, stream graphs (via Preset’s area and bar charts), and the Sri Lanka country map. Stream graphs are especially useful for identifying trends over time across various categories.
- Dive into specific series values using the Legend Selector: The "Legend Selector" feature in Preset charts allows you to zoom into specific series values by selecting or inverting the selection of legend items. This provides greater flexibility and is particularly useful when you want to compare a few series values among many.
Dashboard Customization and Theming
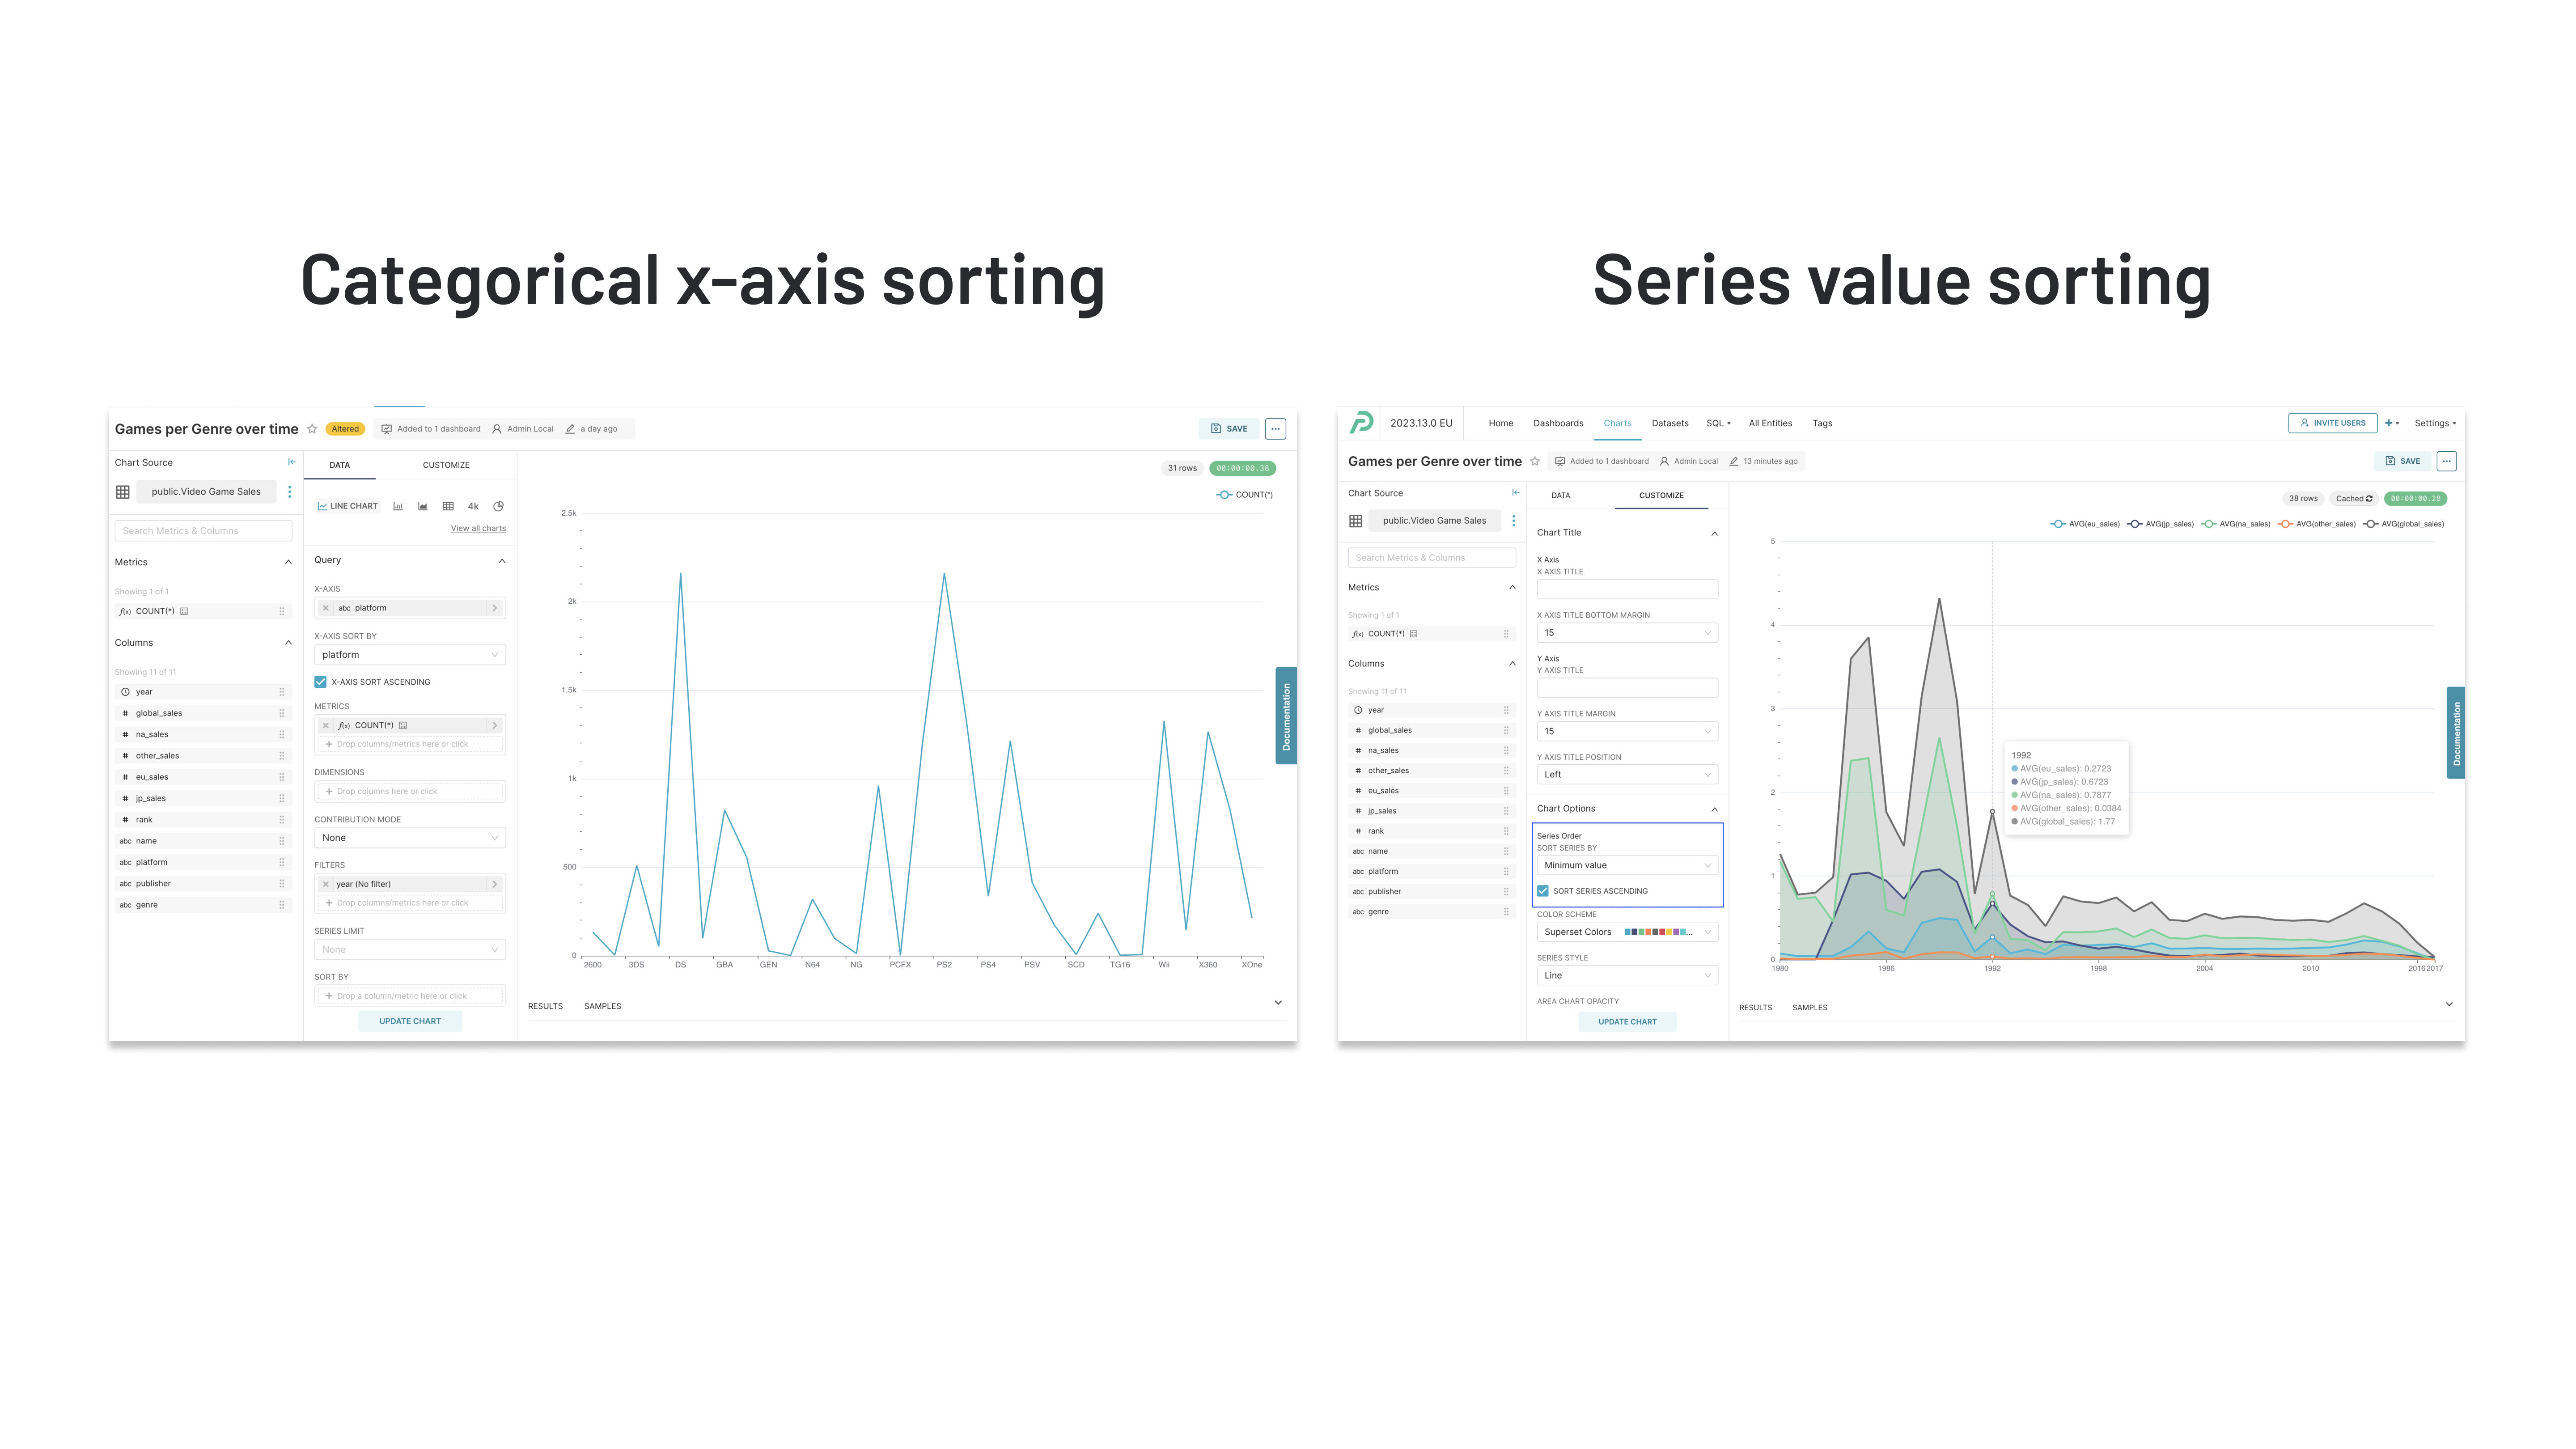
- Customize your charts with more sorting options: Additional sorting features are now available in Chart Builder to help you visualize your data in the way you want. The new sorting configuration options include:
- The categorical x-axis can now be sorted in Bar Charts, Line Charts, Area Charts, Scatter Plots, Smooth Line Plots, and Stepped Line Charts.
- Series values can be sorted by "minimum", "maximum", "total", and "average".
- The sorting order can be switched between ascending and descending orders.
Database Connection
- Use Preset with CSV files without database connection: Sometimes waiting for your data team to connect a database to Preset can get in the way of using Preset. Now, anyone can create charts and dashboards immediately upon account sign-up by uploading CSV files (without connecting to a database first).
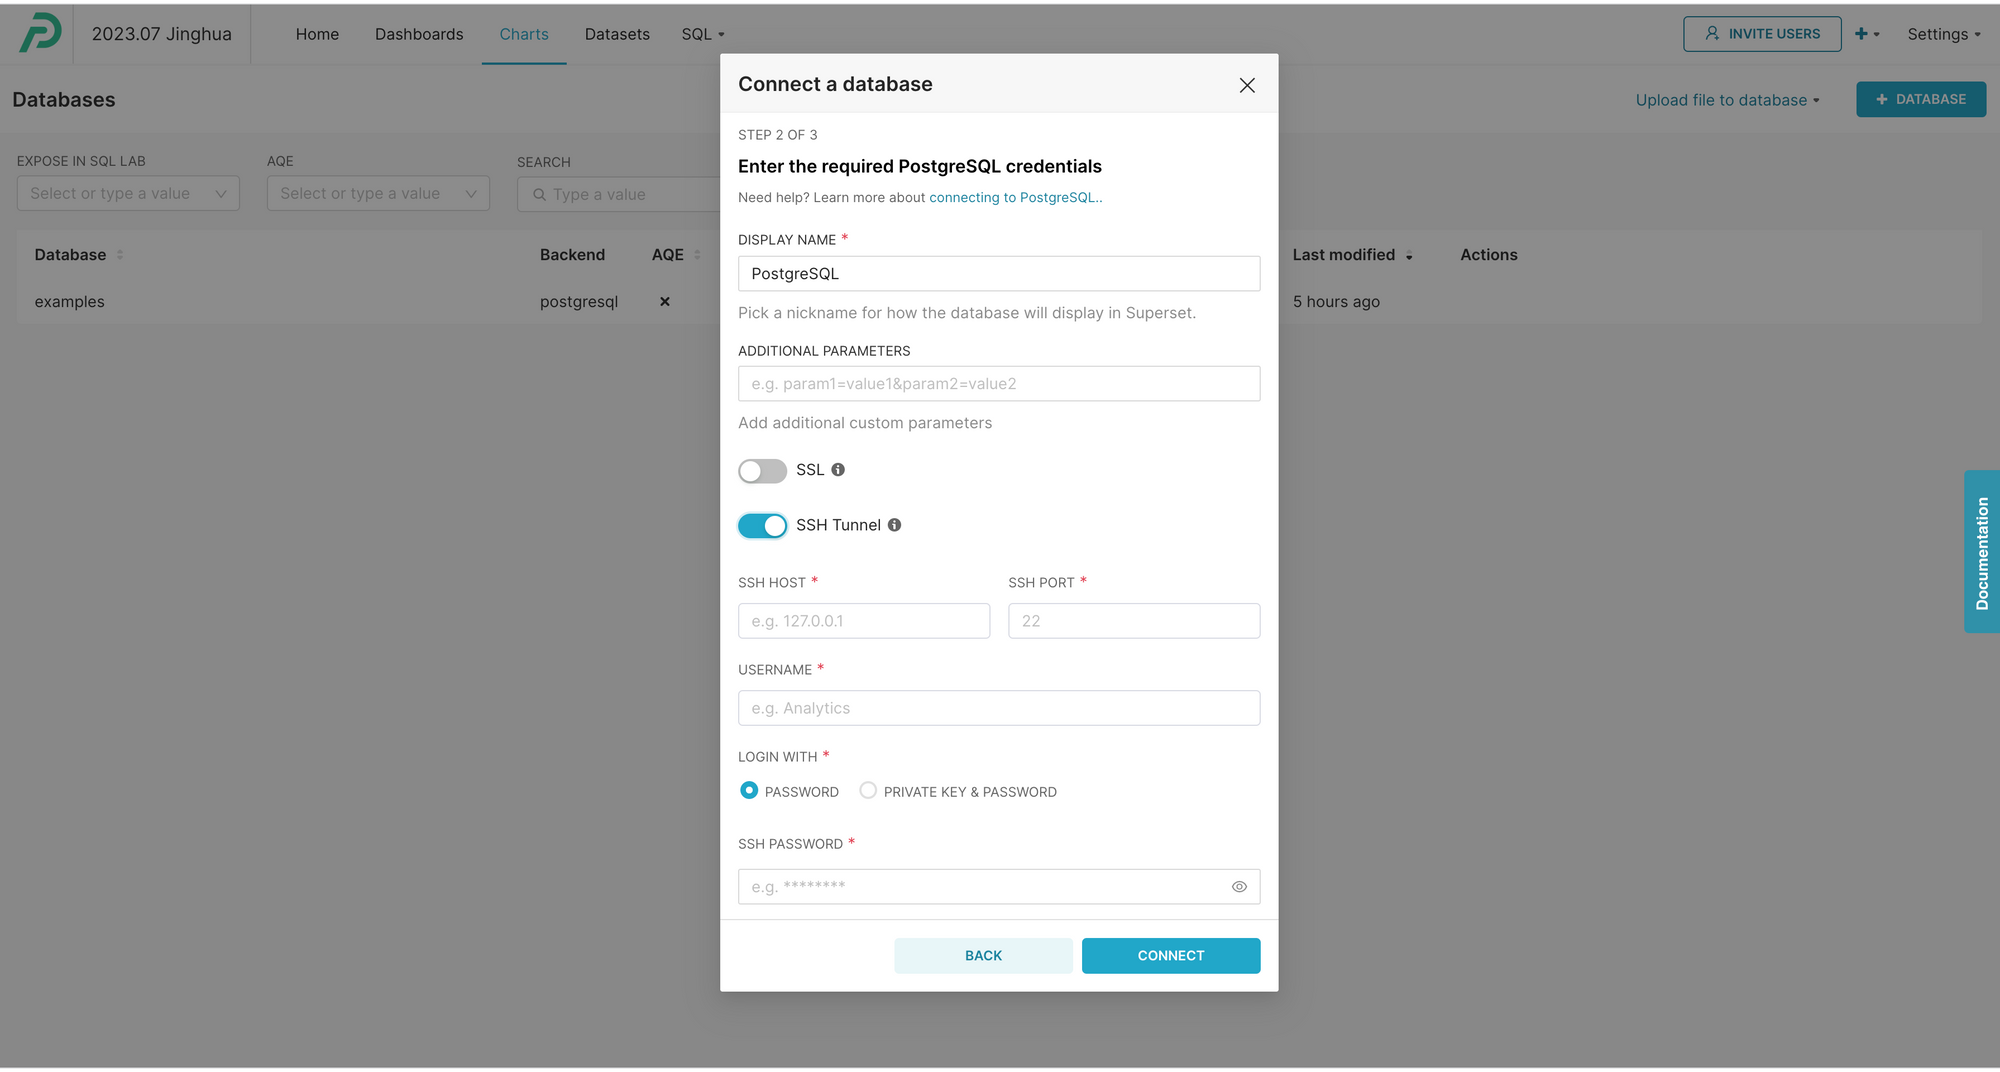
- Simpler, UI-based secure database connection via SSH tunnels1: Setting up secure connections via SSH Tunneling is made easier. In addition to the API or SQL Alchemy forms announced earlier, you can now connect your database and Preset via an SSH tunnel using a dynamic form. SSH tunneling provides an additional layer of security by directing data traffic to flow inside an encrypted SSH connection, acting as an alternative to native data encryption.
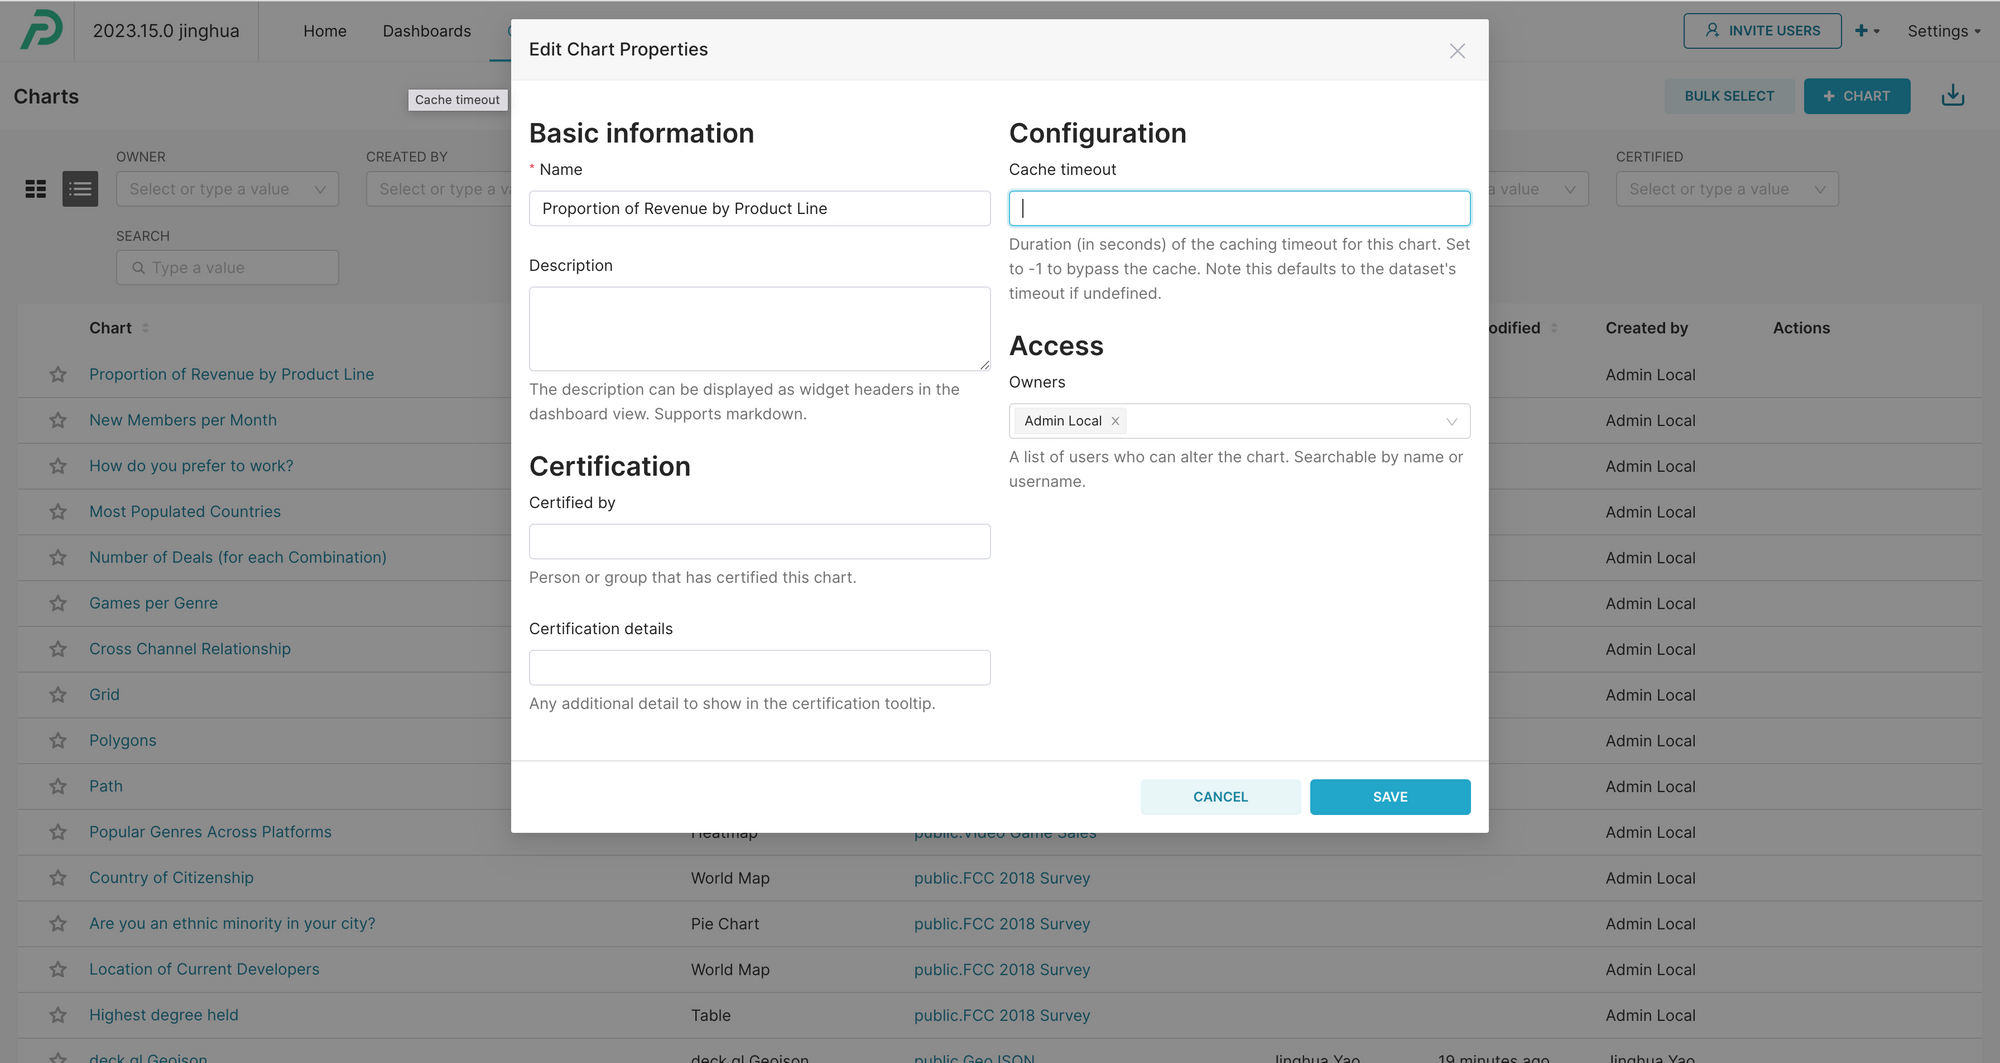
- Disable data caching for specific charts: You can disable caching for specific charts by setting the chart’s "cache timeout" value to
-1. With this new feature, you can globally disable caching by default but still enable or disable caching on a per-database, per-dataset, or per-chart basis. You can also disable caching by default for a specific database, dataset, or chart without affecting chart data caching globally.
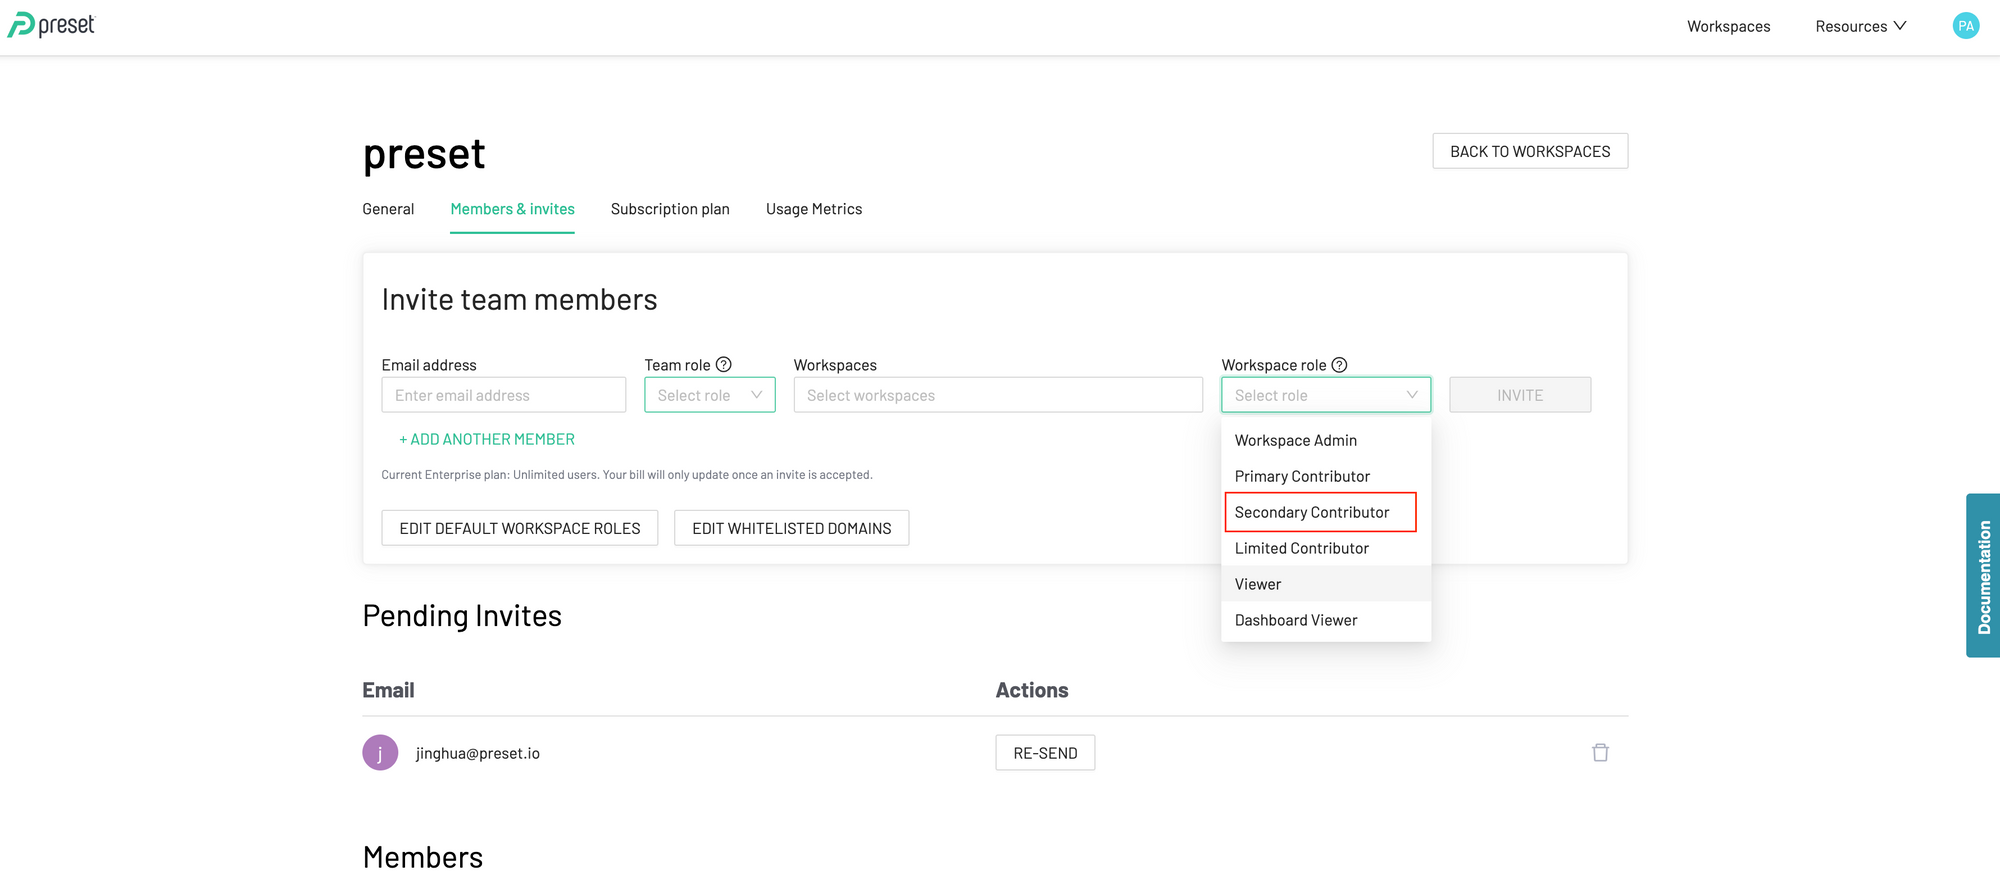
User Access and Role Permissions
- Grant dataset editing permissions with a new workspace role2: The "Secondary Contributor" role is now available, enabling users to have most of the workspace functionalities, including dataset creation and editing, while adhering to data access restrictions set by the admins. Unlike the “Limited Contributors”, the Secondary Contributors can create and data physical datasets.
User Experience and Workflow Improvements
- More intuitive workflow for creating datasets: The new workflow for creating datasets allows users to have a better understanding of the hierarchy of a database, schema, and tables. Users can create a new dataset from a table that has no associated dataset, and they will be prompted to view the existing dataset if it has already been created for the table.
More Features and Enhancements
Bookmark Preset’s changelog to keep track of all enhancements and fixes. Below are just a few selected updates from the last quarter.
- (General) The “Explore” view has been renamed as the “Chart Builder” view to better reflect its functionality.
- (Chart) You can now define up to 1,000 annotations in Chart Builder, giving teams more flexibility in how they add context to a chart.
- (Dashboard) The time and numerical dashboard filters now support cascading, allowing the filter options to be dependent on the values selected in other filters.
- (Dashboard) Column names are human-readable and easier to read in dashboard cross-filters.
- (SQL Lab) You can use the
dataset()macro in Preset, which allows for querying physical and virtual datasets in SQL Lab. The macro is useful if you have defined computed columns and metrics on your datasets and want to reuse the definition in ad-hoc SQL Lab queries. - (Database) You can edit the SSH tunneling setting for existing databases connected to Preset using the dynamic form1.
- (RBAC) The data access role, Database Access, lets you see all dashboards, charts, and datasets associated with the databases you have access permissions for in their list views2.
Excited to try out these features? Head over to your Preset workspace now and get started!
1 Available on the Preset Enterprise plan only.
2 Available on the Preset Professional and Enterprise plans only.
