


Exploring Trends Over Non-Temporal Dimensions in Superset and Preset


Time series charts, such as line charts, scatter plots, and area charts, are commonly used to display how variables change over time. However, in some cases, it is necessary to explore trends and patterns over categorical dimensions. We are excited to announce that non-temporal X-axes are now available for general availability (GA) in many of Preset's charts, which were formerly known as the time-series charts. In Apache Superset, you can continue to access the non-temporal x-axes through the feature flag, GENERIC_CHART_AXES.
This blog post explains the 3 key updates that have been made to the time-series charts and time-filter interactions using the Preset interface.
Motivation
Teams frequently want the ability to use bar charts, line charts, and other types of charts with non-temporal x-axes to carry out analyses such as:
- Evaluating correlations between variables (e.g., the correlation between revenue and subscriber growth)
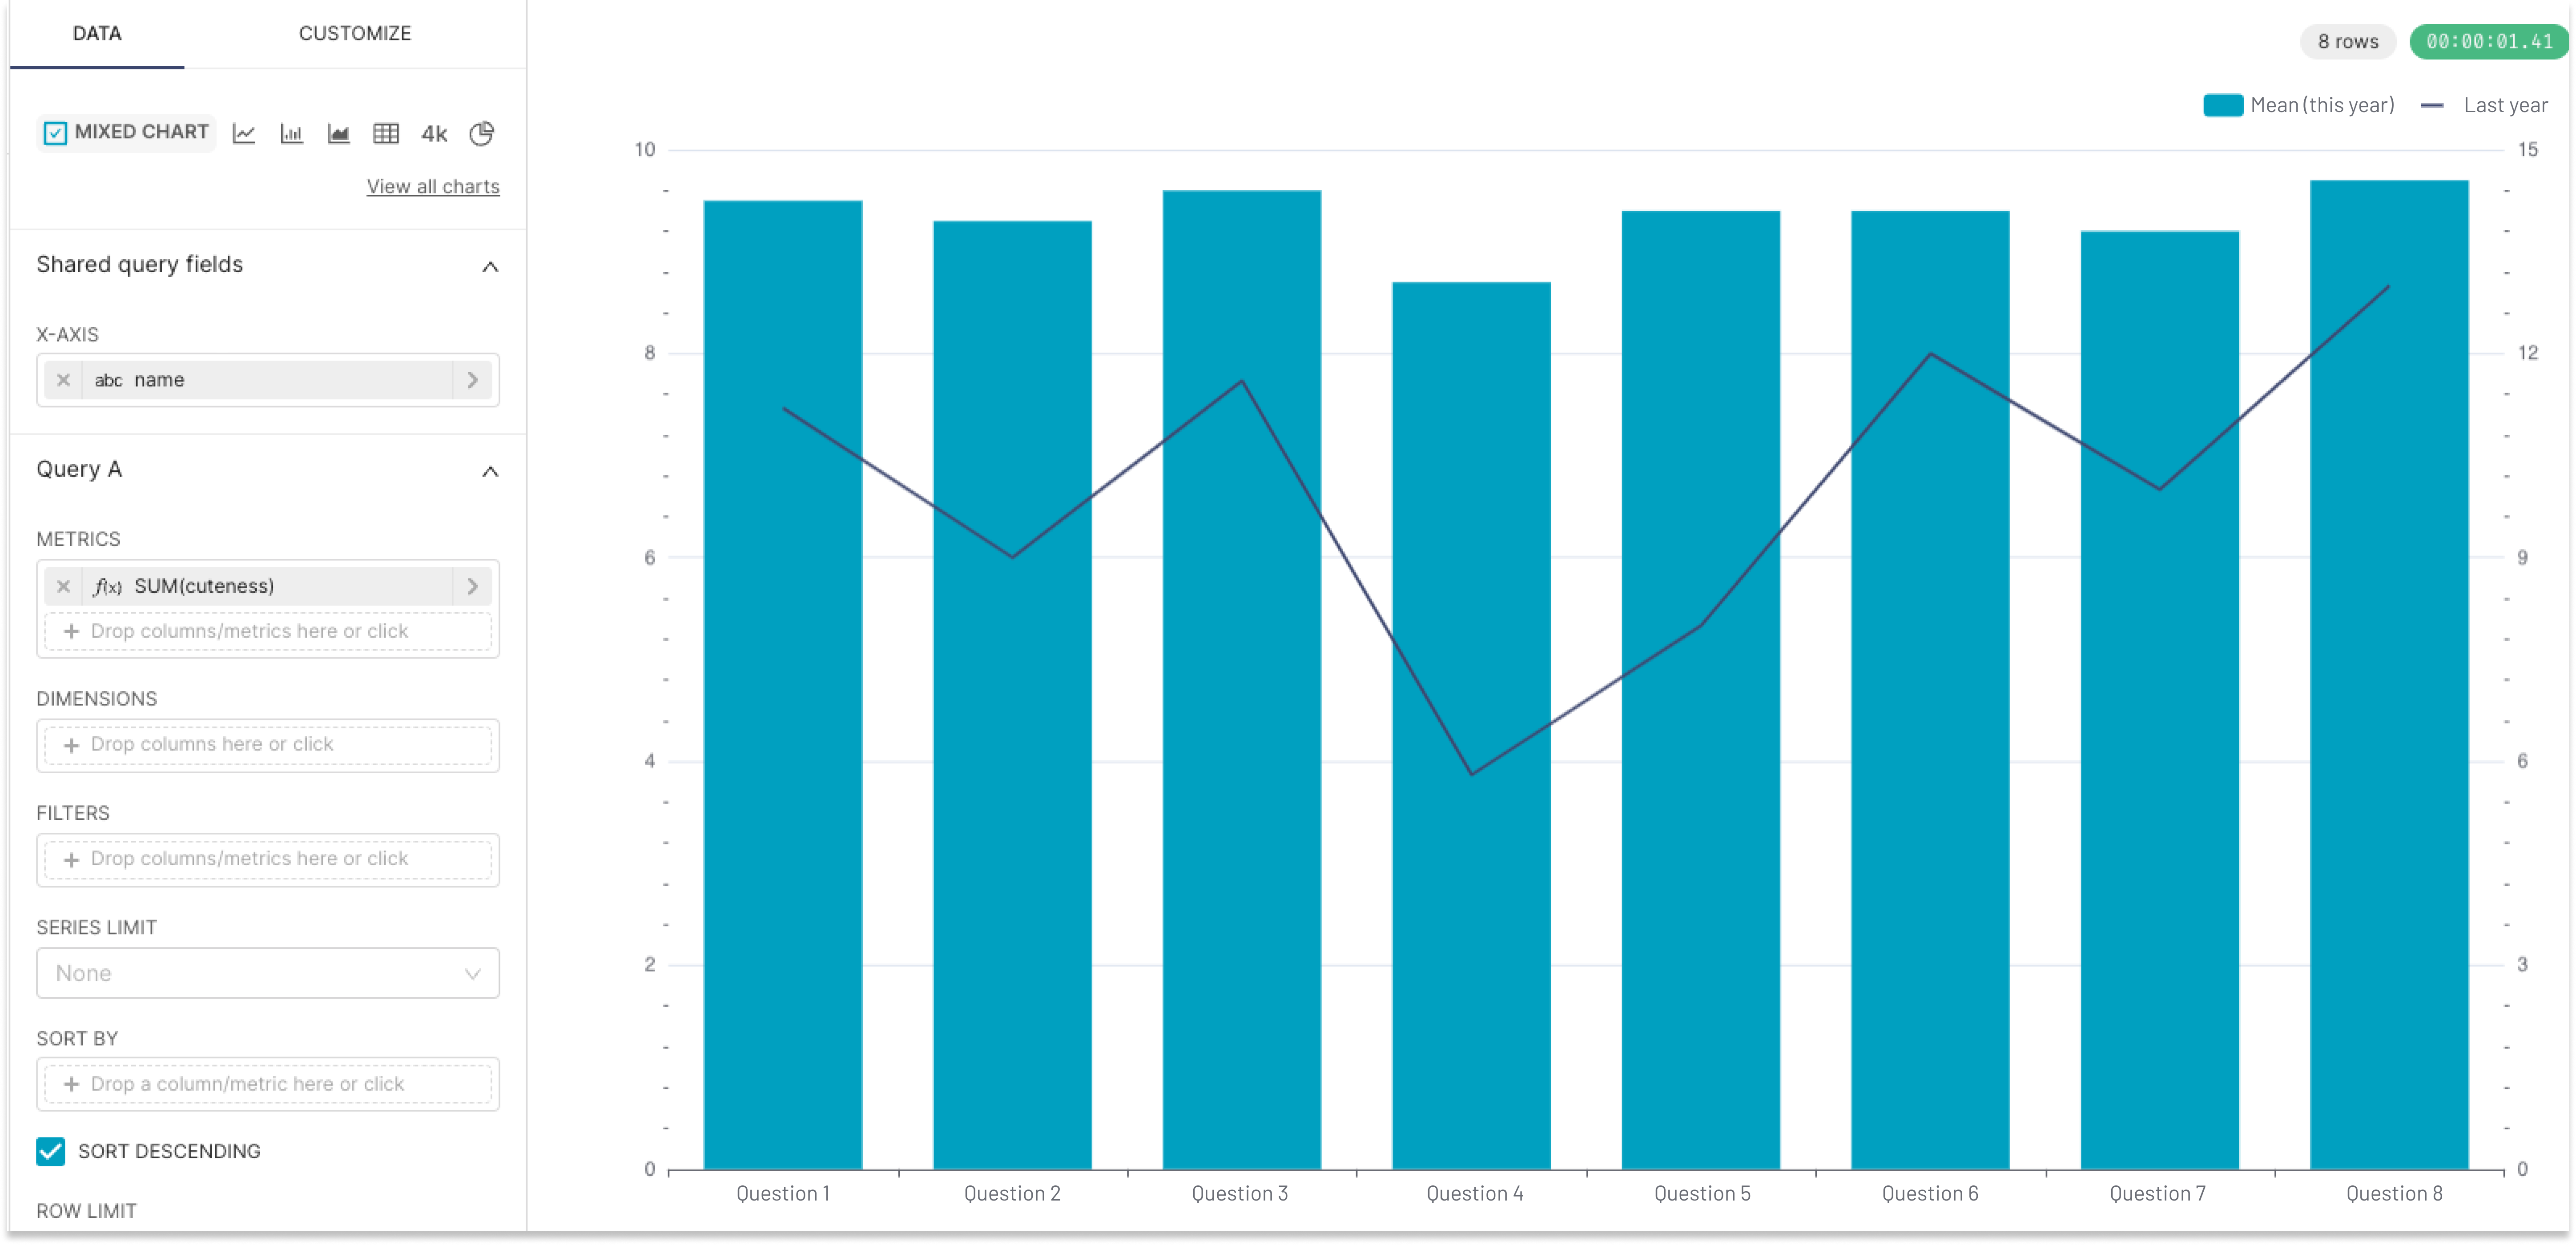
- Quantifying user research data (e.g., evaluating mean scores across survey questions)
- Measuring business and functional performance metrics (e.g., customer acquisition cost by channel)
X-axes that support both temporal and non-temporal dimensions have been available in beta in both Superset and Preset for some time, but we have recently released them for GA in Preset.
1. Chart names
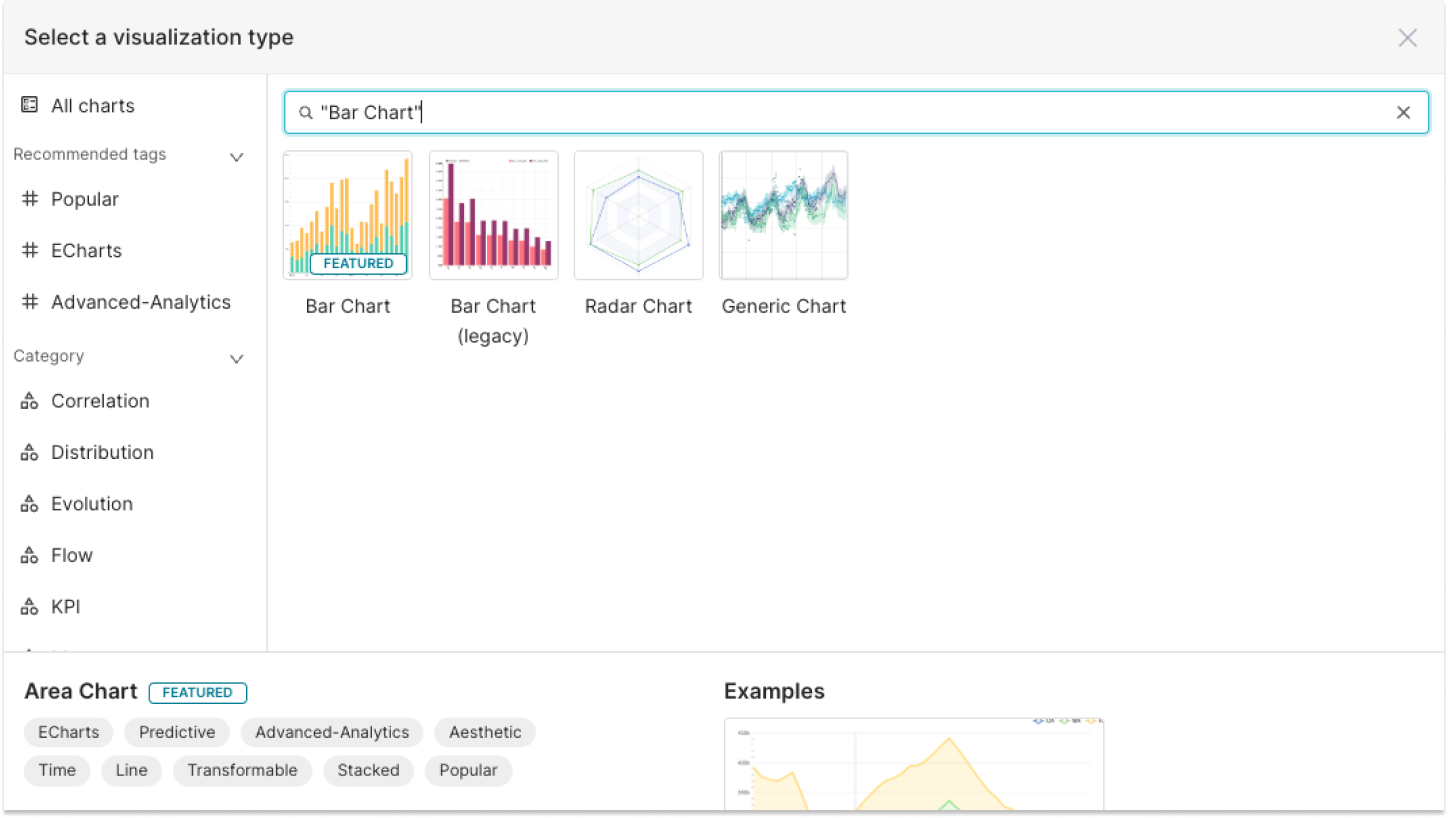
The time-series charts have been renamed to reflect their support of non-temporal dimensions. The visualization picker in Preset (or Superset) and documentation have been updated to reflect these changes.
| Previous name | New name |
|---|---|
| Time-series bar chart | Bar chart |
| Bar chart | Bar chart (legacy) |
| Time-series scatter plot | Scatter plot |
| Time-series area chart | Area chart |
| Time-series line chart | Line chart |
| Time-series chart | Generic chart |
| Mixed times-series chart | Mixed chart |
| Time-series smooth line chart | Smooth line chart |
| Time-series stepped line chart | Stepped line chart |
Preset’s visualization picker
2. Creating charts
We have made improvements to the drag & drop "Chart Builder" interface to provide an intuitive chart configuration experience. These improvements include:
- The ability to specify the x-axis dimension in the "Query" panel (the former "time filter" panel is displaced).
- The "Time Grain" field will only appear when a temporal column is selected as the X-axis variable.
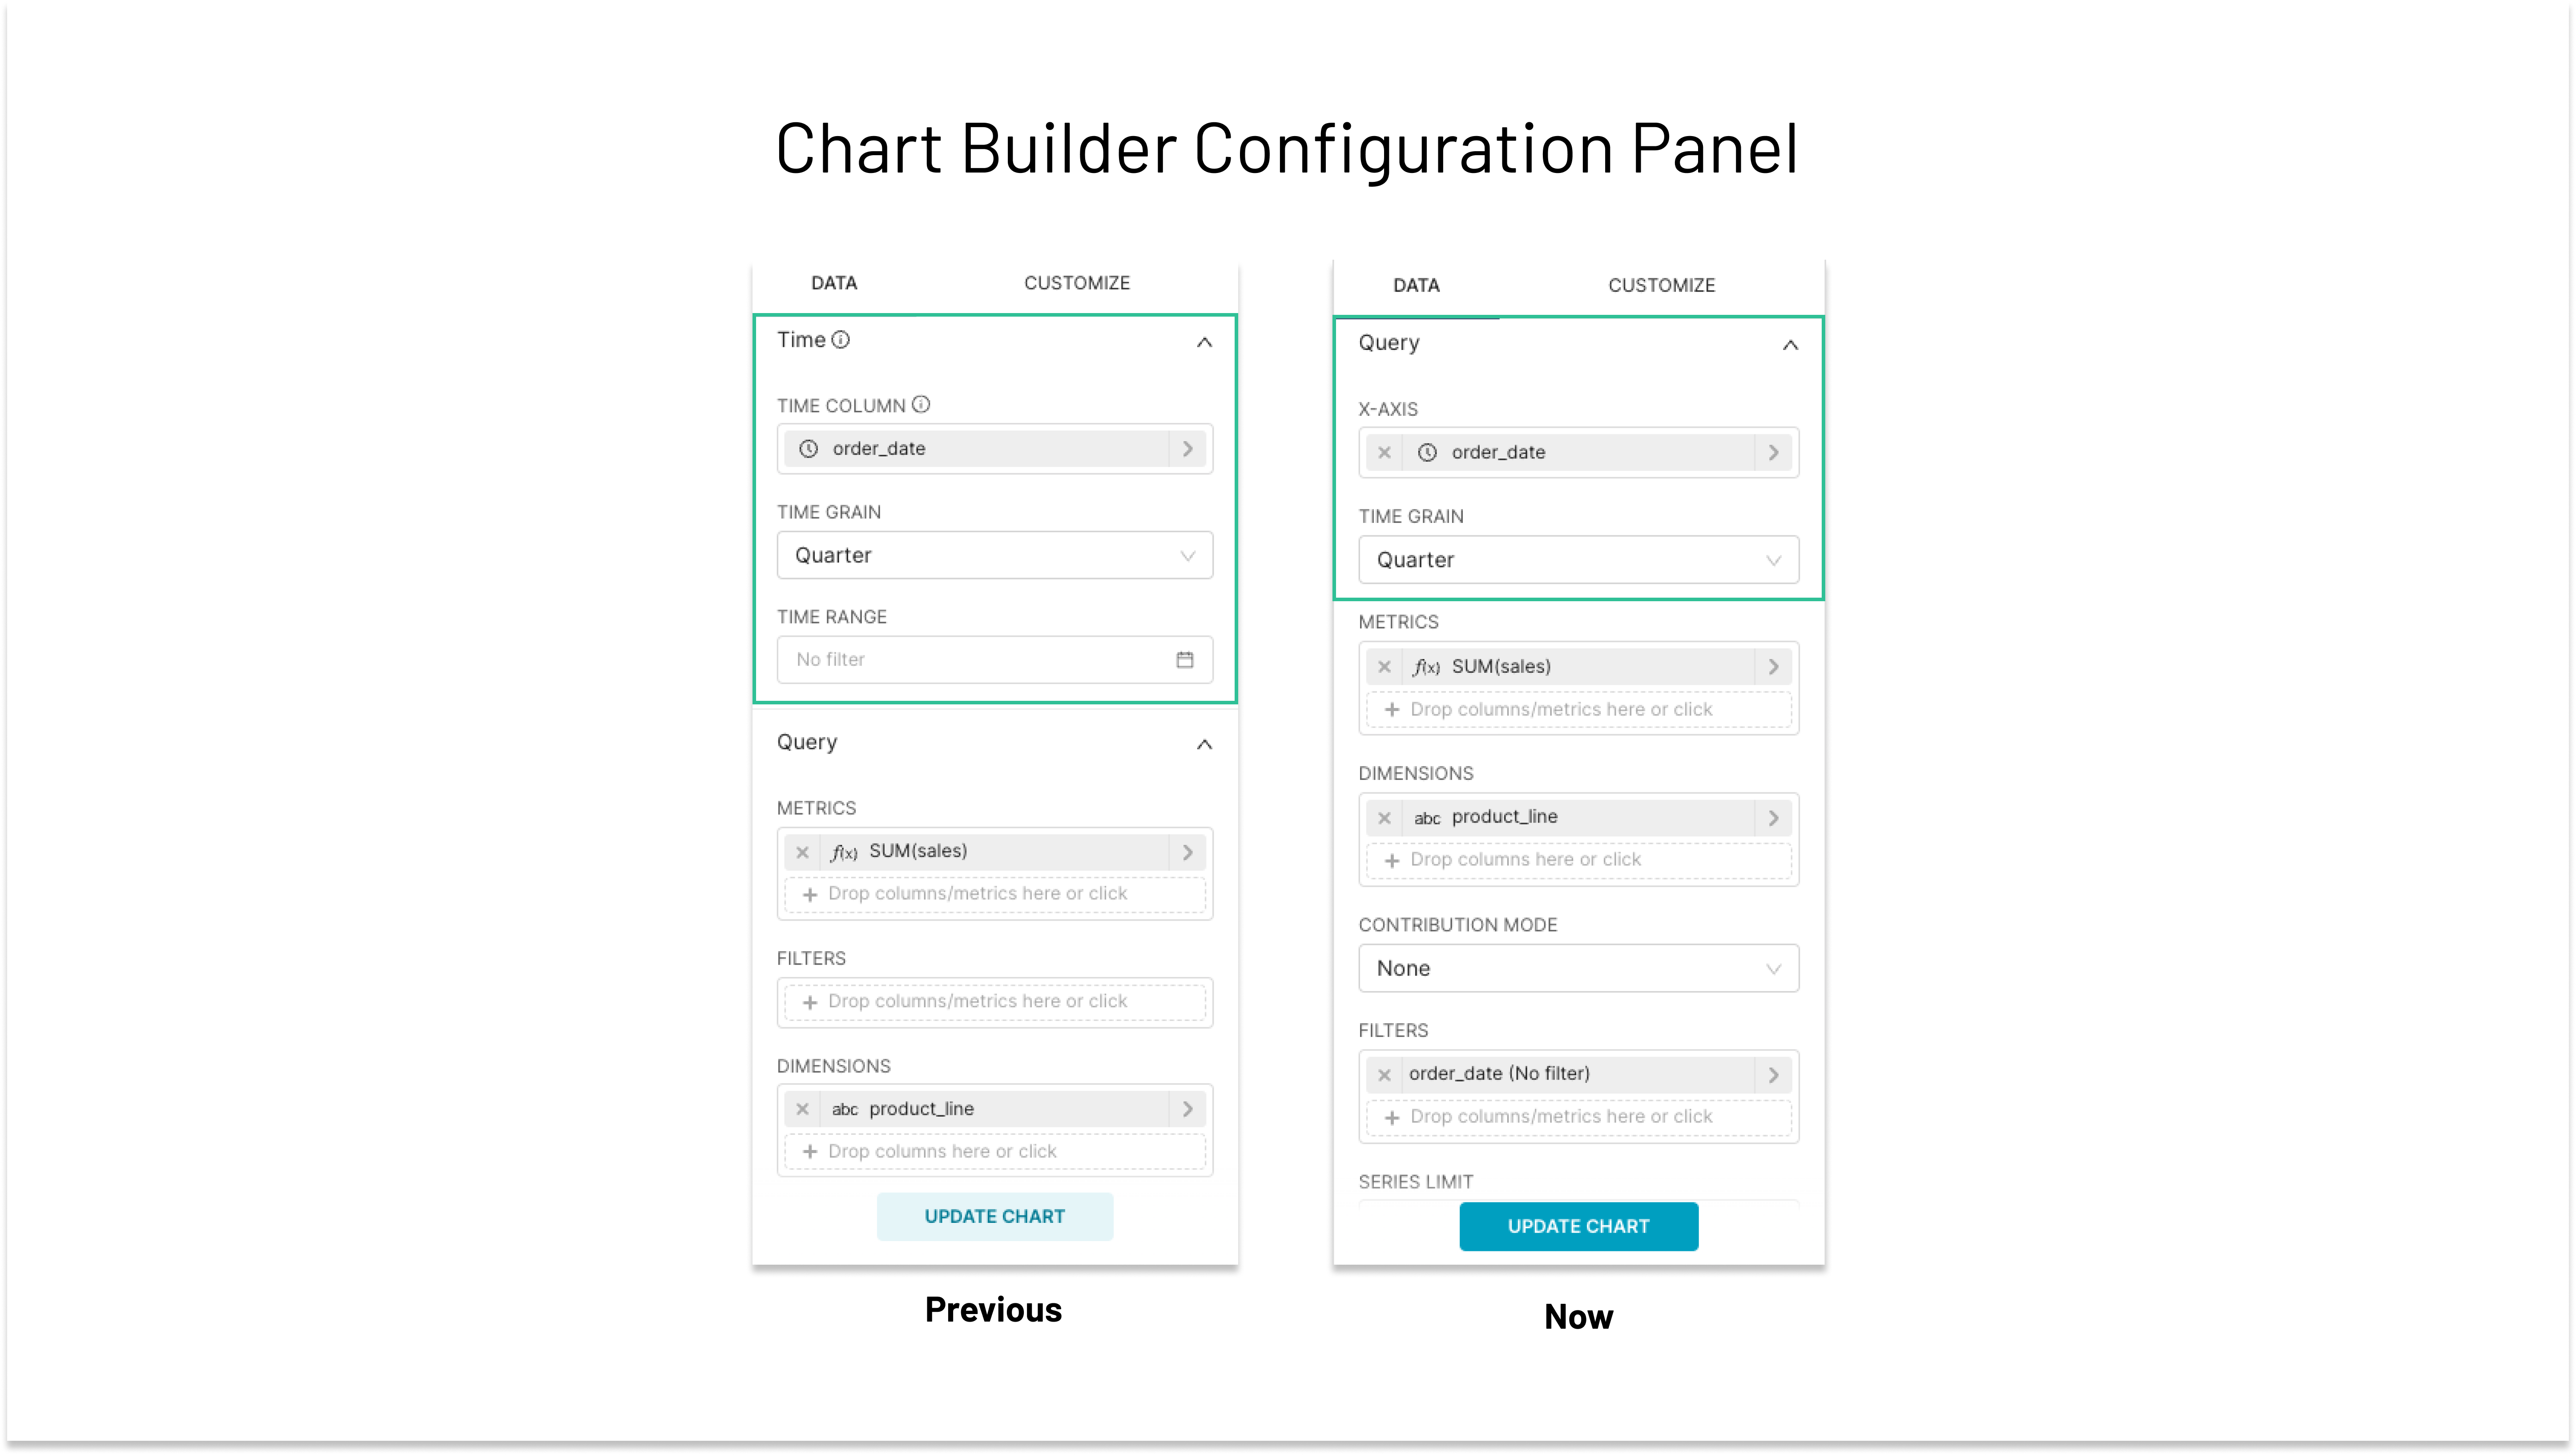
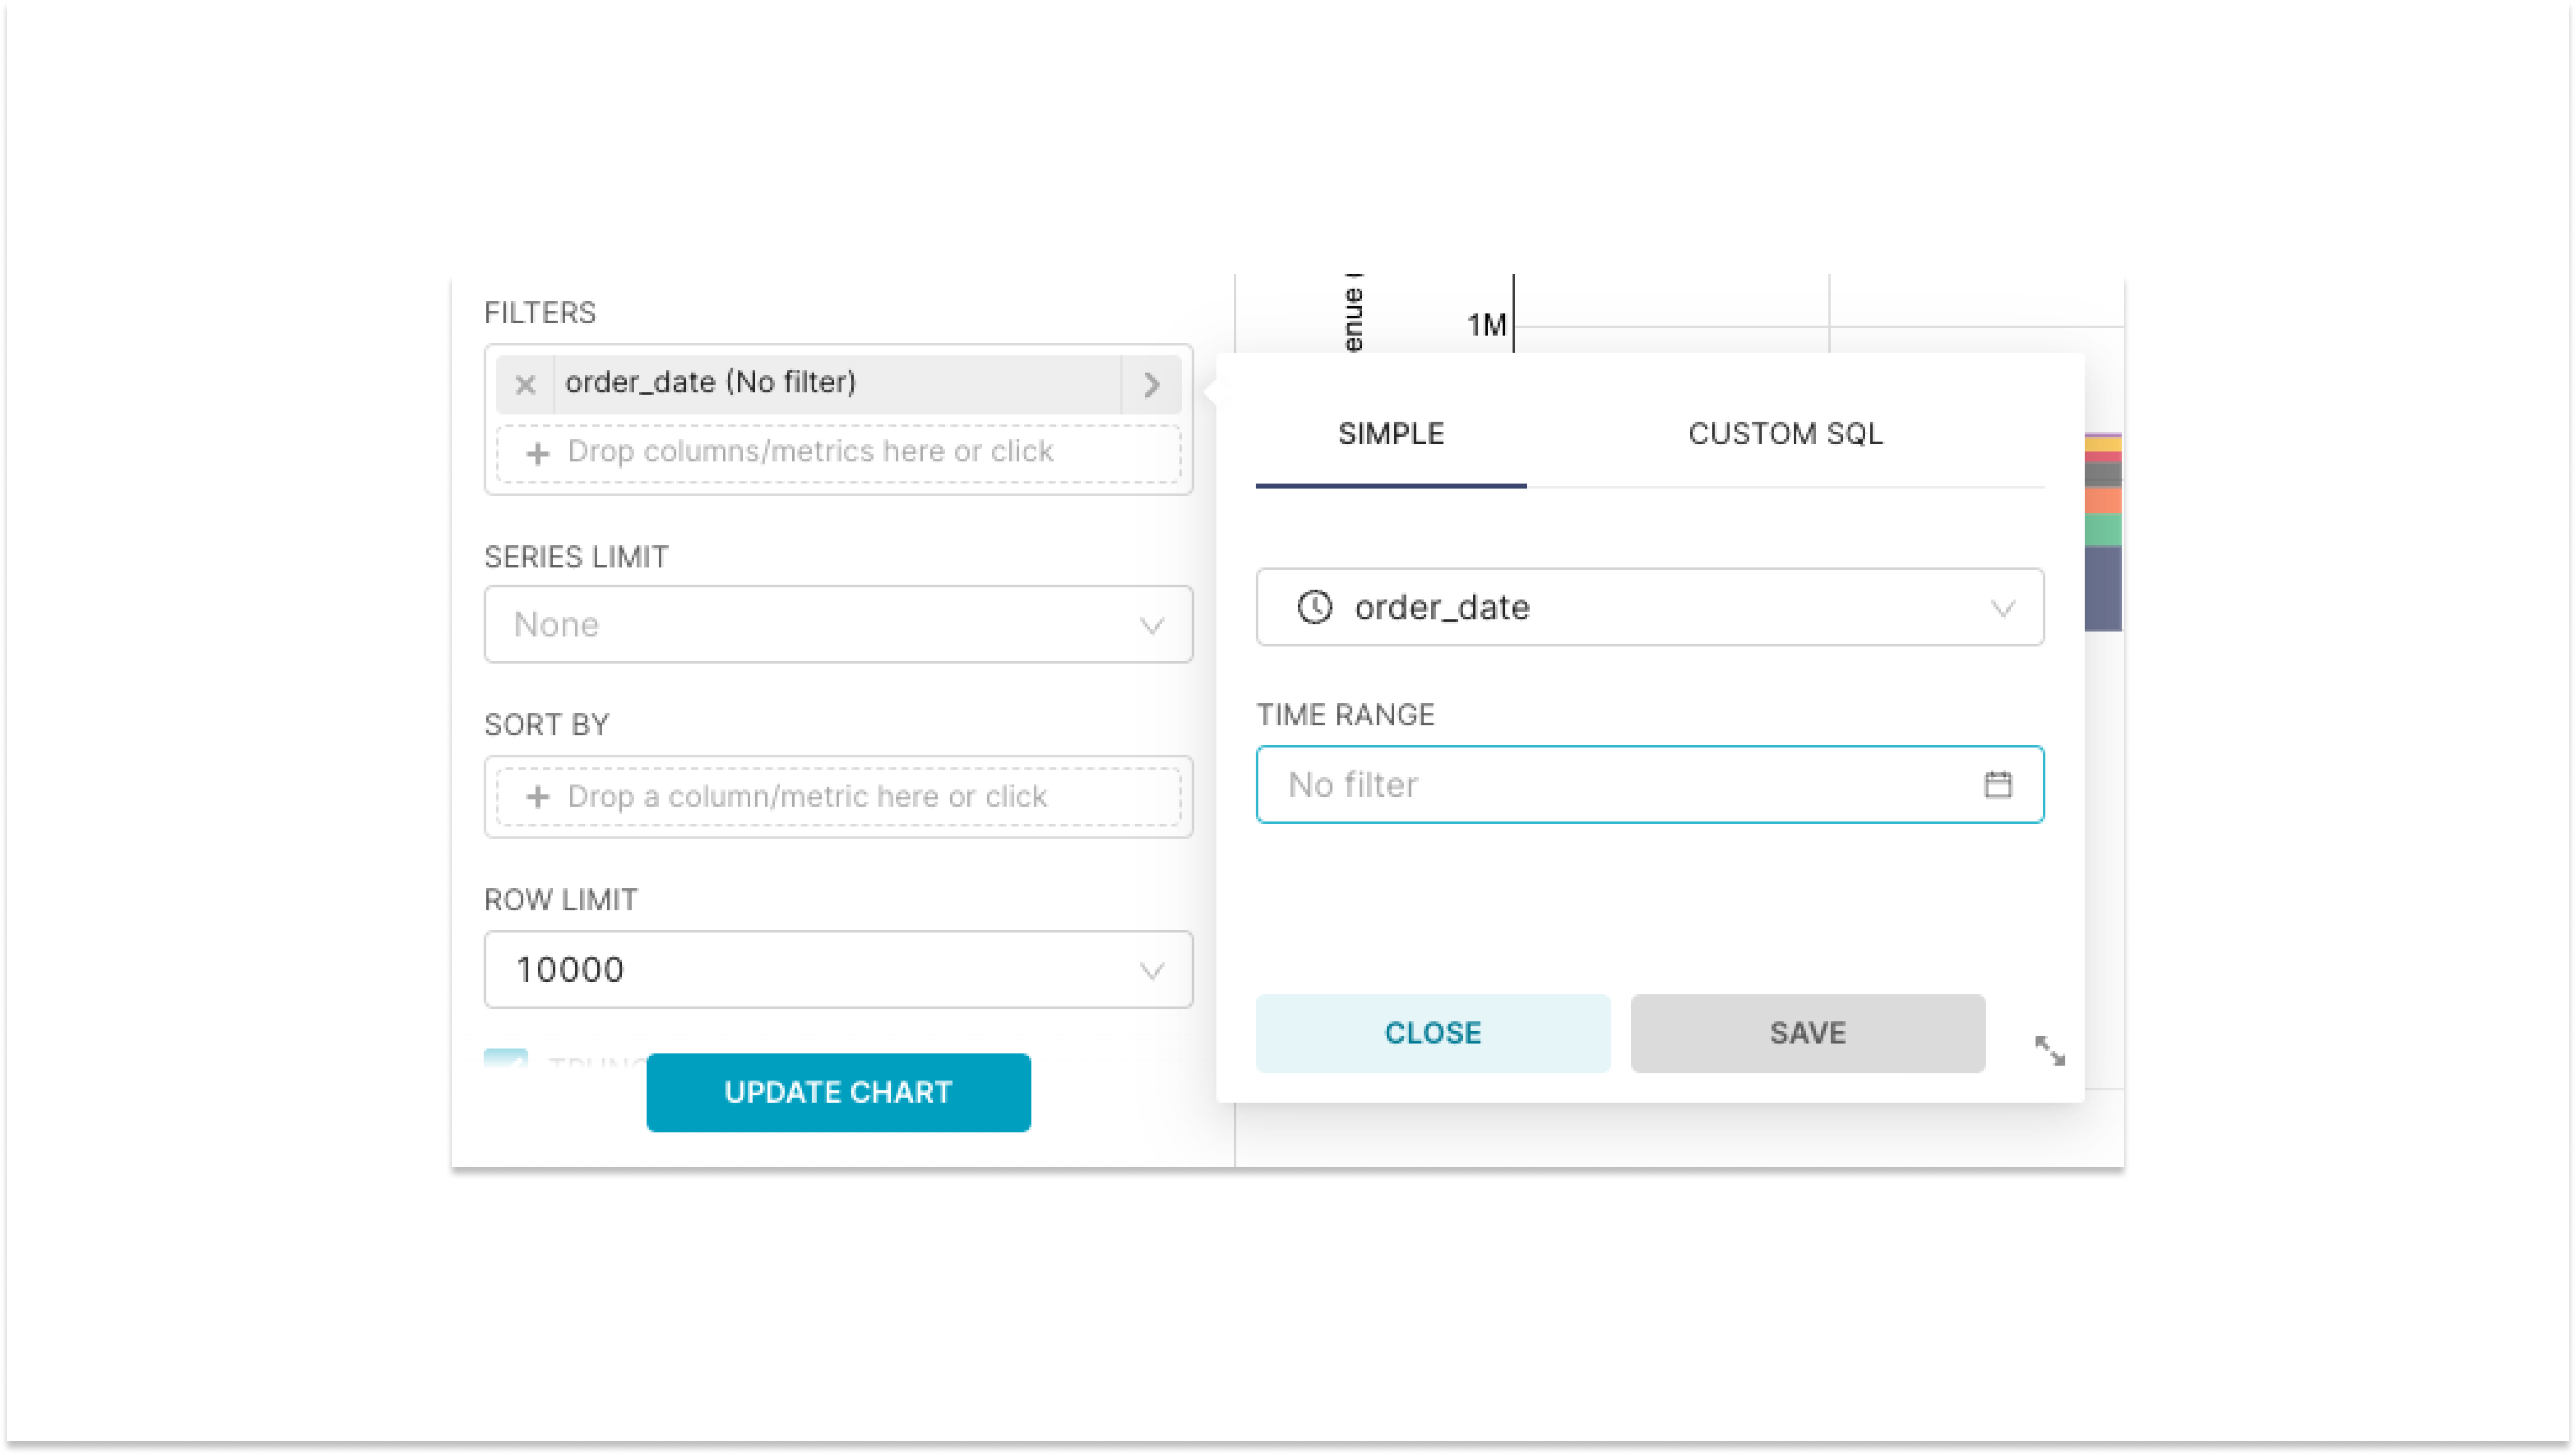
Time-based filters are now configured in the "Filters" section of the Query panel. Since Superset and Preset dashboards use charts’ time filters as their dashboard filters, at least one time filter must be selected to create or update a chart. By default, a time filter with No Filter value will be applied to a chart. Multiple time filters can be added if desired.
3. Exploring charts in dashboards
In the “Dashboard” view, you can dive into segments of your visualizations using dashboard filters or cross-filters. Time filters you set up during chart creation are available for dashboard filter configuration.
Note that even if a chart contains multiple time-based filters, you can only specify one time range for all filters in the dashboard view. In other words, if you set up a time range for ‘last week,’ all of the chart’s time filters are set to ‘last week.’
Try it yourself in Superset / Preset
Create your charts with more versatile x-axes in Superset or Preset. Our documentation provides detailed instructions for how you can create and customize your charts. If you are new, create an account in just a few steps. Preset’s Starter plan gives you access to the hosted version of the open-source Superset for free forever.
