Using Superset to Understand Superset Usage
This post was originally publised on the HomeToGo Engineering blog.
Introduction
This article walks you through a potential approach to monitor your Superset usage directly within Superset leveraging the internal metadata database.
At HomeToGo, we are always looking for opportunities to further streamline our Data Tech Stack. Naturally, one of the most important components is the reporting environment that allows our teams to easily explore, interact and create insights of our data. Historically, we were using multiple tools for this purpose, namely Tableau, Redash and QlikView which:
- have different usage workflows and pre-requirements:
- For Redash, one needs to be able to write SQL to produce the initial data to explore
- For Tableau, the workflow is more user-friendly for non-technical users but it's not as easily maintainable with a programmatic approach on a more flexible and granular level
- cause an overhead to manage and keep the environments aligned
Over the summer of 2021, we looked at different solutions to unify these environments and ended up running a Proof of Concept with Apache Superset. We ultimately decided to use it as our main reporting tool.
If you monitor the reporting space closely, you have probably already heard of Apache Superset. If you haven’t, we highly recommend checking out the Preset blog to see how it matured in 2021. While there is still areas for improvement the below Superset advantages stood out for us:
- The data exploring process is more visual for non-technical users but also provides capability for custom SQL (via SQLLab)
- All business logic is available in SQL
- API-first approach to manage most object types (datasets, metrics, access, etc.)
- An RBAC model for granular data access
- Open source license with active community and experience in building strong OSS
- Advanced chart types with option to easily contribute with own developed charts
- Advanced chart functionality, e.g. time sliders, date grain selector out of the box YoY calculations
- Python post-processing like Facebook's prophet forecasting, advanced filters and Jinja templating functionality
Two weeks ago, we made our Superset environment (self hosted) public to our stakeholders and started our migration from Redash.
To closely monitor our user adoption rate and general usage patterns of Superset, we made this a project for our monthly hackathon events and looked into Superset's internal PostgreSQL metadata database.
Keep reading for our step by step approach and what we’ve learned so far. On top, we released all the bits and bytes you need to replicate the results of this article here.
Step 1 - Connect to the PostgreSQL Metadata Database
For the sake of the hackathon, we went with a simple approach by connecting the Superset metadata base directly to Superset — reporting in real time has never been easier. 🙂 And of course, insert your favorite inception joke here.

Fun aside, there are other ways to integrate the metadata into Superset, especially if you want to:
- Avoid exposing the production database to Superset directly
- Connect it to other data sources (i.e. the query performance statistics that is provided by your DWH)
- Start parsing out information from the json fields in the different tables
A more reliable solution could incorporate the following steps:
- Import the content of the metadata database via Airbyte into your data warehouse
- Create your dbt model(s)
- Add the datasets via your usual data warehouse connection
Step 2 - Explore the Data Model
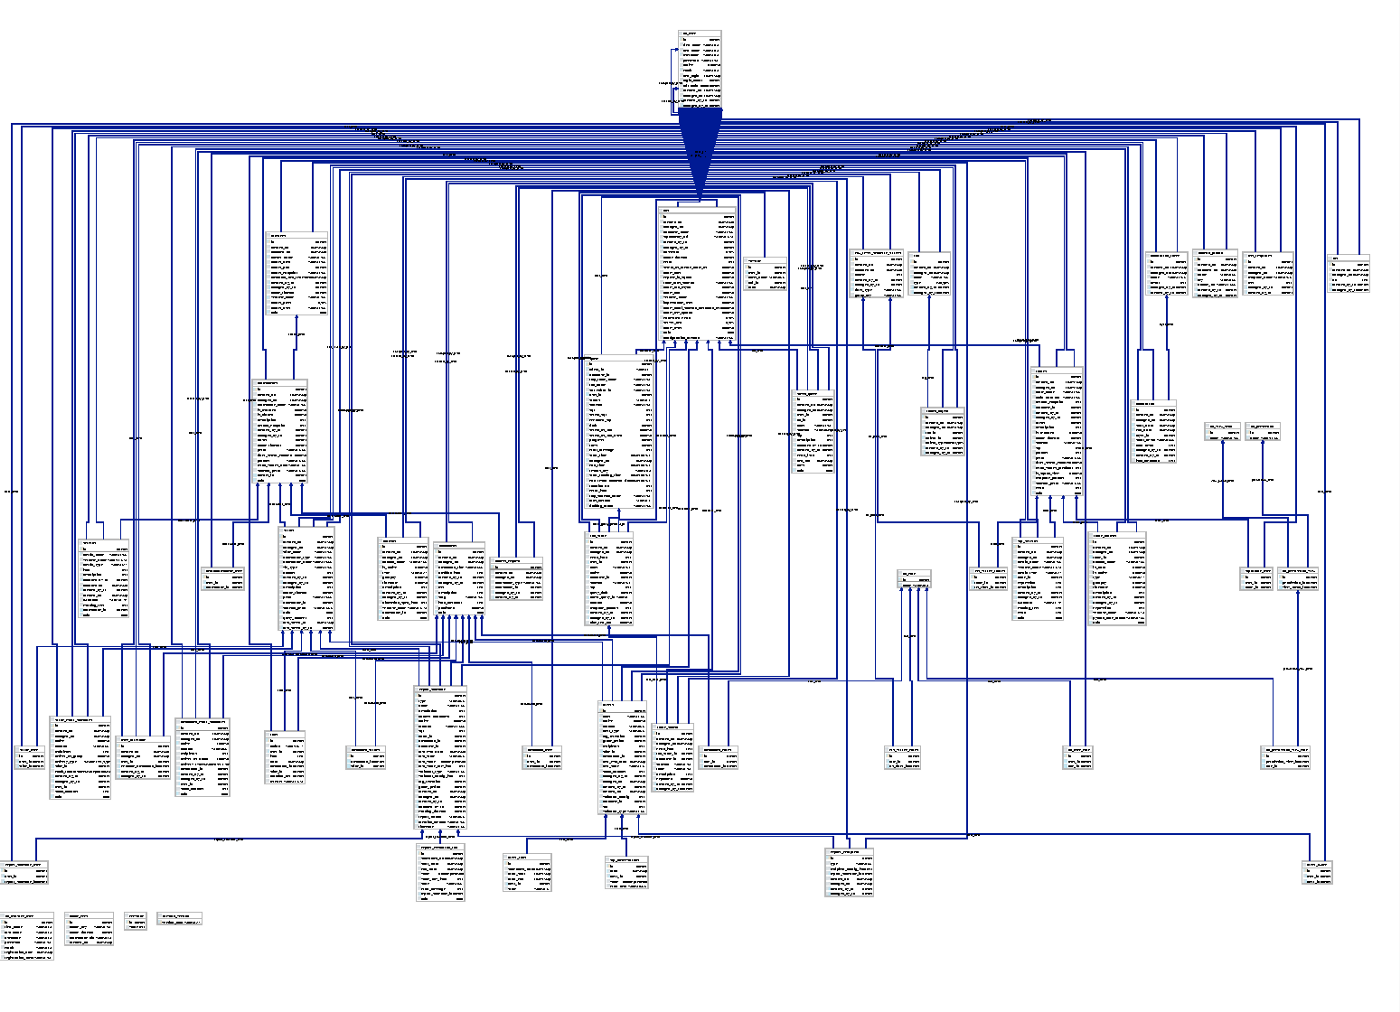
Once connected, you are welcomed by 55 tables that are (more or less) used by Superset internally. As there is not much documentation around this topic (yet), we started to explore and “reverse engineer” our way into a better understanding by drawing an UML diagram first.
From there it was quite easy to derive the tables that are of interest for our use case, namely:

As you can see, we created two custom datasets on top that are:
- Connecting master data from dashboards, charts, etc. to the log data itself
- Aggregating different master data into one view
For reference, you can find the SQL code for the virtualized data sets at the bottom of this article or in this repository.
Step 3 — Know what you want to accomplish
After gaining a good understanding of the base tables, we developed the areas where we wanted to derive insights. For the scope of the hackathon, we therefore focused on the following questions:
User Adoption Rate
We treat our internal stakeholders as customers — we are always interested in master data (e.g. how many registered users do we have) but are more focused on:
- How many active users we have
- Which dashboards/datasets are used the most
To surface these findings, we had to connect the master data to the log table, which we accomplished with a virtualized dataset. The reasons for this are manyfold — just envision a view of dashboards/datasets which are not used at all and could provide valuable feedback for the data owners.
Chart Types
Knowing which chart types are used the most provides insights into:
- If we need special testing before updating Superset in case the chart type was changed
- Encouraging users to use certain chart types for feature parity (e.g. use the echarts time series line chart instead of the simple line chart)
Entity Naming Conventions
Unfortunately, Superset does not support proper tagging of elements like datasets, charts or dashboards. In our opinion, this causes struggles in navigating the content when > 50 users are producing content. To avoid this, we ask our users to follow a very simple naming convention that makes their content easily searchable and allows us to parse tags going forward:
[tag1_tag2_…_tagn].[element name]Where the tag section would follow the snake_case guidelines. Examples are marketing_sem.Performance Dashboard or monitoring.Superset Dashboard.
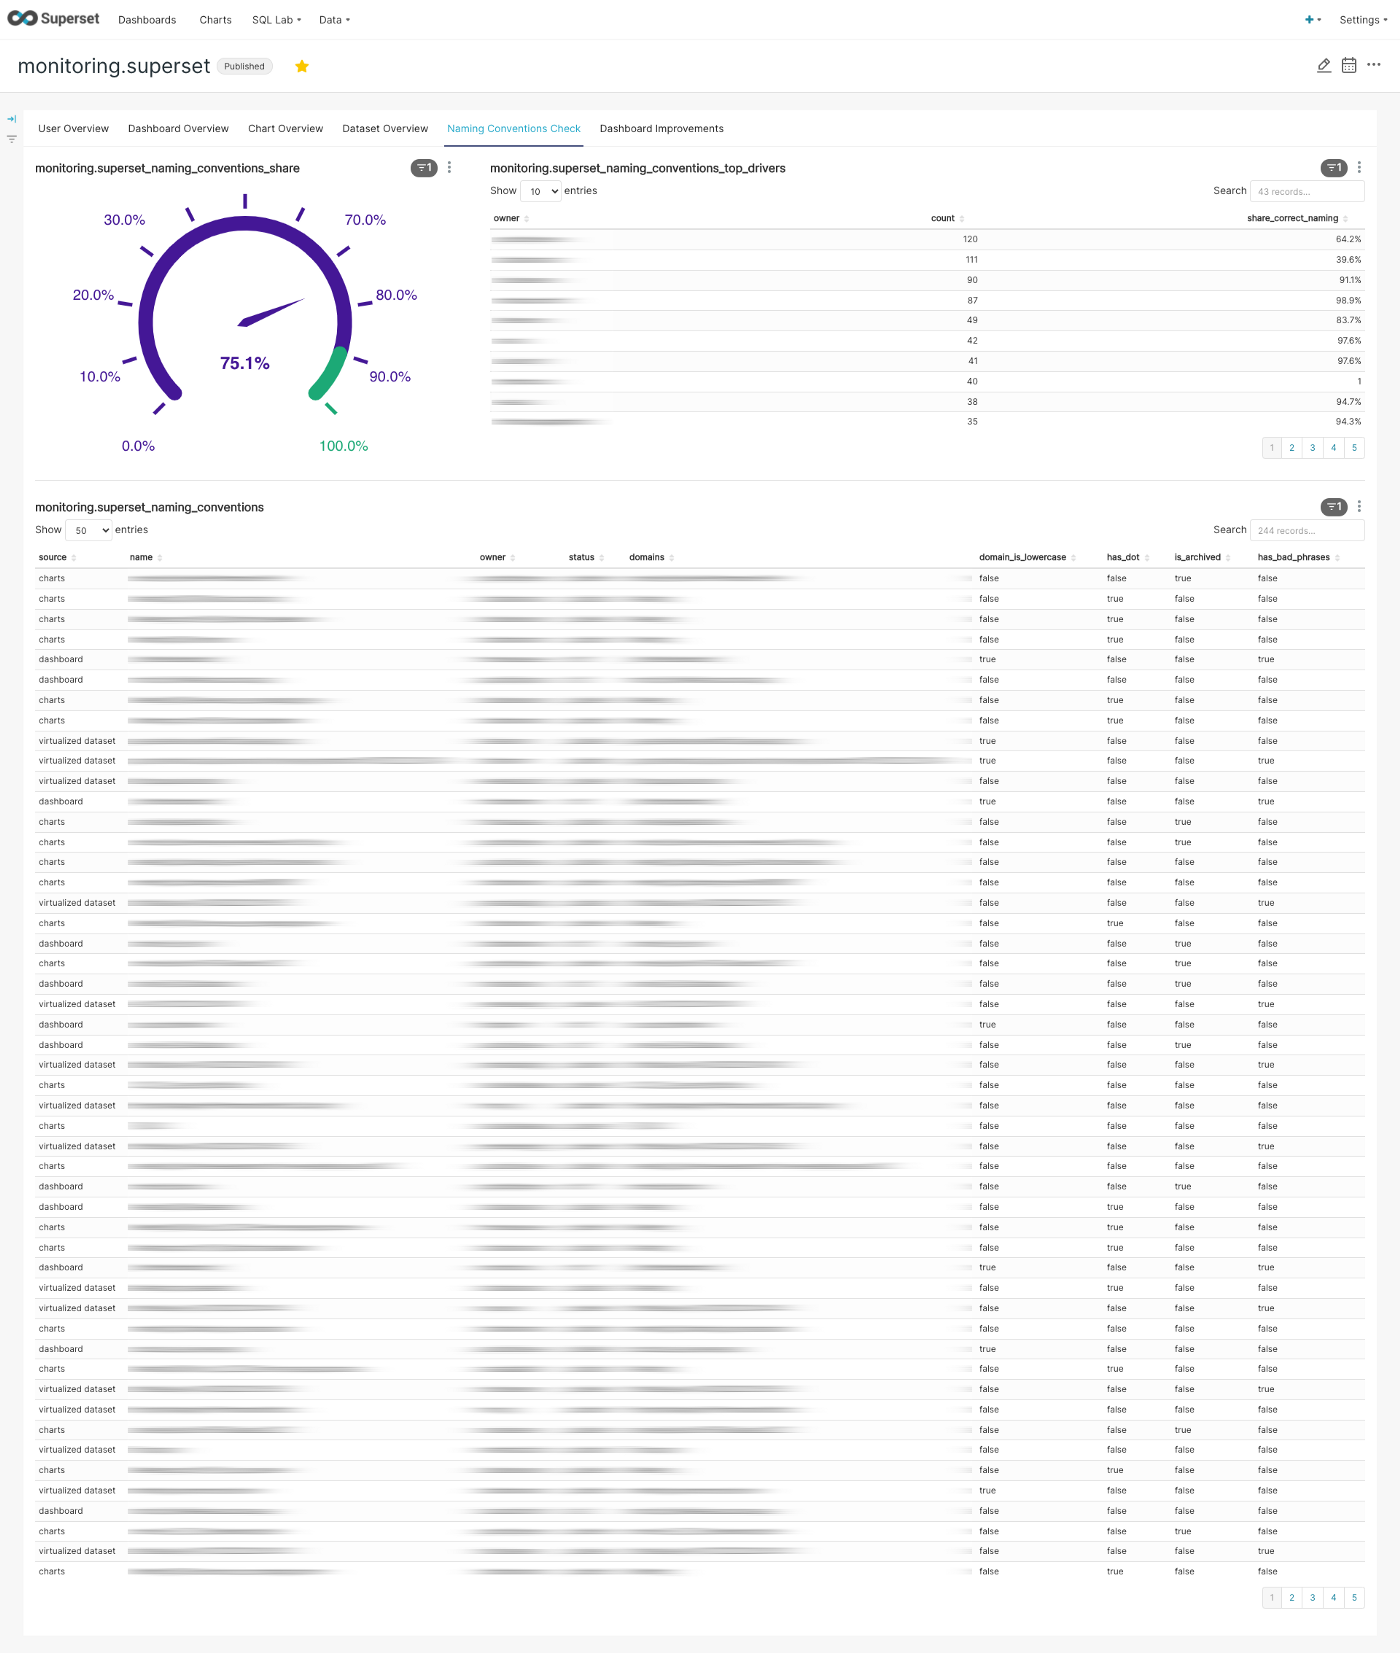
As naming things is hard, we wanted to build a simple monitor showing us the naming convention adoption rate. We are now able to give a friendly ping to users whom we don’t see following the naming convention. 😉
Development of Virtualized Datasets
Virtualized datasets are a great way to allow customers to connect different data sources and build customisations. However, we want to be mindful about what are valid use cases as extensive use could potentially clutter our provided datasets that are coming out of dbt.
Valid use cases for virtualized datasets would include joins, unions and more complex logics with window functions that are not available via Charts directly.
Use cases we want to learn from are when people only use one data set with additional case when or renaming columns. This feedback loop will allow us to improve our dbt data models directly and keep our environments tidy.
Step 4 — Build the Dashboard
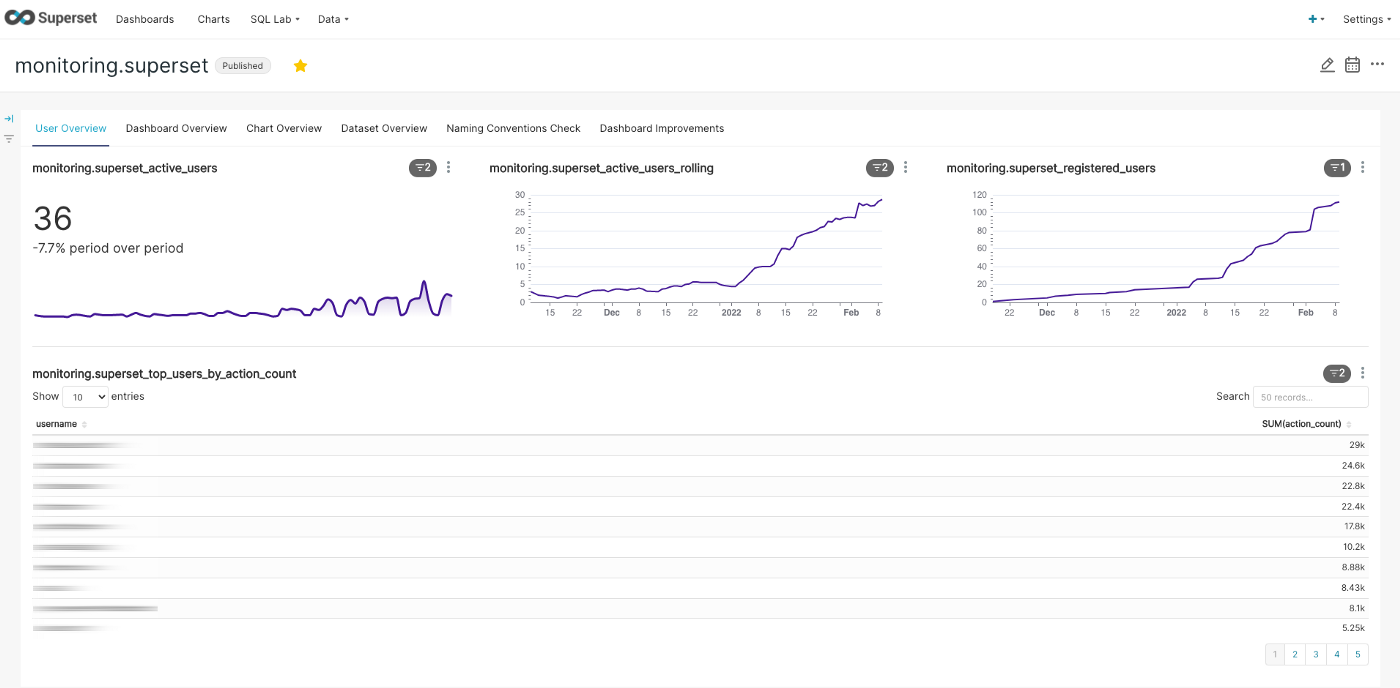
Now on to the fun part! Once the datasets were ready for action, we jumped directly into creating charts and gathering them into a dashboard with minimal filter settings (only for Time Range, Time Grain, Dashboard Status). If you want to follow our approach, you can download our exported dashboard soon here. (Link updated in CW 8), otherwise you can find some examples below.
User development and user activity
Datasets development and showing users with the most virtualized datasets
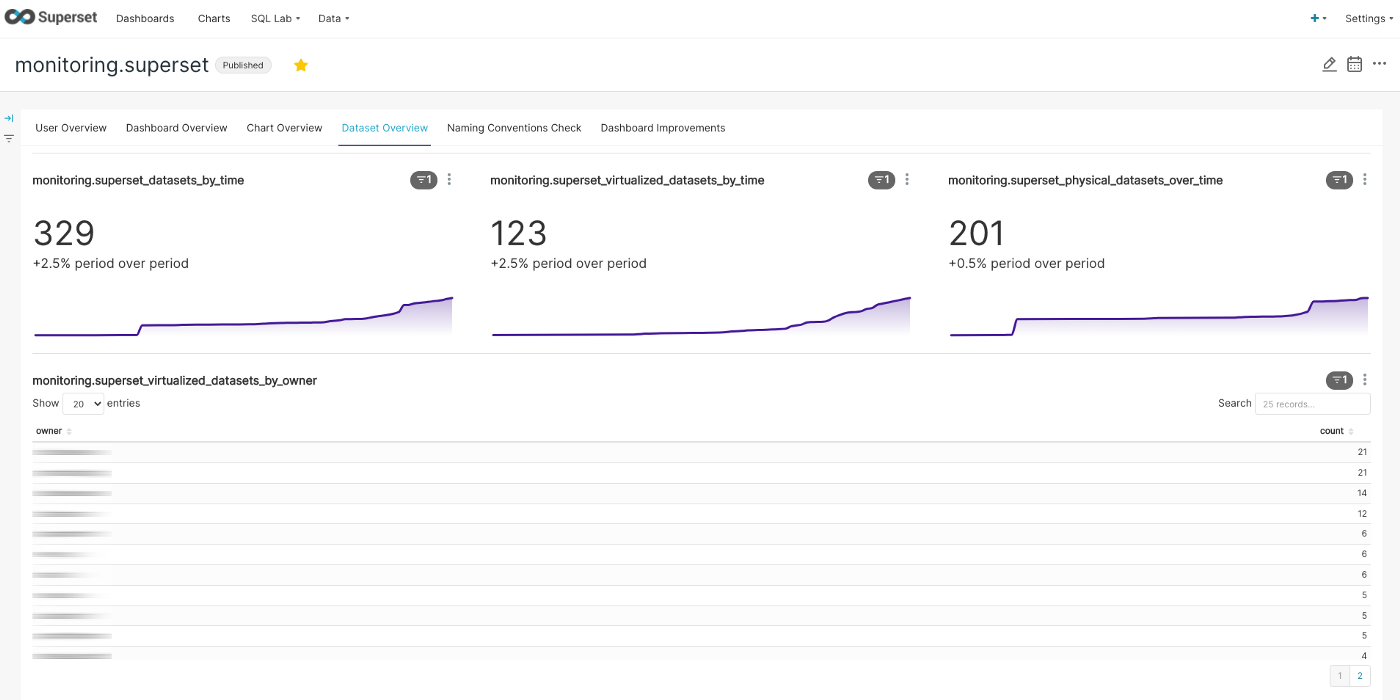
Chart development and most prominent selection (using a treemap to make it look fancy)

Our internal naming conventions check — the gauge chart is a great way to incentivize
What is Next
While we are already pleased with the insights we derived by the first iteration of the dashboard, there are a couple of topics we want to continue working on:
Further Classification of Activity
There is definitely room for improvement in classifying the events that are logged in the action column to get the most of the logs table. At the moment, there are 104 different actions defined in our db including things like:
welcome(logged when a user sees the front page)annotation*(if users are working with annotation layers)- several
get/listAPI calls - internal actions like
explore_json
There are also several other actions you may not want to count overall (as they are happening indirectly in the background) compared to things like creation/changing/viewing of superset elements such as:
queries(if a query was executed from SQLLab)ChartRestApi.data(if data was loaded by a chart component)count(if a dashboard got viewed)
We assume that parsing the json entries for action ='log’ will provide you with even more granular information for further action classification.
Add Performance Perspective
As of now, we have not found a great way to create a performance view that includes query execution time as well as the impact of the internal Superset cache. While the first can be derived by parsing the Data Warehouse tables (e.g. on Snowflake via SNOWFLAKE.ACCOUNT_USAGE.QUERY_HISTORY) this does not include the cache perspective. We experimented with the column duration_ms of the log table but frankly we are not sure about the reliability.
If you have more detailed knowledge on the above topics, or simply want to join us on this effort to build the next iterations of this dashboard, please reach out directly in the Superset Slack Community.
A big thank you goes out to our Superset team Agustin Figueroa and Donatas Jocas, as well as Ilayda Tangor and Sung Pham, for working on this as their hackathon project. In case you are interested in other areas we are working on, you can find more data tech stack related articles in our HomeToGo publication.
Appendix
SQL code for monitoring.superset_action_log dataset:
select
date_trunc('day', l.dttm) as action_date,
case
 when lower(l.action) = 'queries' then 'query from sqllab'
 when lower(l.action) = 'chartrestapi.data' then 'query from charts'
 when lower(l.action) = 'count' then 'dashboard view'
 when lower(l.action) like 'annotation%' then 'annotations'
 when lower(l.action) like 'css%' then 'css'
 else lower(l.action)
end as action,
l.user_id,
u.user_name,
u.created_on as user_registration_date,
l.dashboard_id,
d.dashboard_title,
case
 when d.published = true then 'published'
 else 'draft'
end as dashboard_status,
l.slice_id,
s.slice_name,
s.datasource_type,
s.datasource_name,
s.datasource_id,
count(1) as action_count
from logs as l
left join ab_user as u on u.id = l.user_id
left join dashboards as d on d.id = l.dashboard_id
left join slices as s on s.id = l.slice_id
where 1=1
and l.action != 'log'
group by 1,2,3,4,5,6,7,8,9,10,11,12,13
SQL code for monitoring.superset_naming_conventions dataset:
with cte_names as (
 select
 table_name as name,
 'virtualized dataset' as source,
 'published' as status,
 created_by_fk as created_by_user_id
 from tables
 where 1=1
 and is_sqllab_view = true

 union

 select
 dashboard_title as name,
 'dashboard' as source,
 case
 when d.published = true then 'published'
 else 'draft'
 end as status,
 du.user_id as created_by_user_id
 from dashboards as d
 left join dashboard_user as du on d.id=du.dashboard_id

 union

 select
 slice_name as name,
 'charts' as source,
 'published' as status,
 su.user_id as created_by_user_id
 from slices as s
 left join slice_user as su on s.id=su.slice_id
),
cte_names_with_properties as (
select
name,
source,
u.username as owner,
status,
case
 when lower(split_part(name,'.', 1)) = split_part(name,'.', 1) then true
 else false
end as domain_is_lowercase,
case
 when lower(name) like '%.%' then true
 else false
end as has_dot,
case
 when lower(name) like 'archived%' then true
 else false
end as is_archived,
split_part(name,’.’, 1) as domains,
case
 when lower(name) like '%untitled%' then true
 when lower(name) ~ '\d{2}\/\d{2}\/\d{4}' then true
 else false
end as has_bad_phrases
from cte_names as tmp
left join ab_user as u on tmp.created_by_user_id = u.id
)
select
*,
case
 when domain_is_lowercase is true
 and has_dot is true
 and has_bad_phrases is false
 and is_archived is false
 then true
 else false
end as is_valid
from cte_names_with_properties