


How Prophet Enables Time-Series Forecasting in Apache Superset


As a data engineer with a background in scientific data analysis, one of the things that excites me most in Superset's future is an ever-increasing array of sophisticated analysis options integrated into my visualization workflow. It all boils down to what makes data analysis fun to begin with: moments of discovery and insight that, for me, often arise from visualization.
Time-series analysis happens to be close to my heart from past scientific work, and I recently wrote a blog on setting up Apache Druid, Prophet, and Superset to work together in a time-series analysis workflow. In that blog, we:
- set up a druid cluster from scratch with the required authentication extensions and other components
- added the Prophet package to Superset's python environment
- connected Druid to Superset
I also wrote about Druid's ingestion workflow and created a simple time-series visualization in Superset. There, we:
- ingested some Wikipedia tutorial using Druid's web GUI
- created a new dataset in Superset
- visualized that data with a simple time-series chart
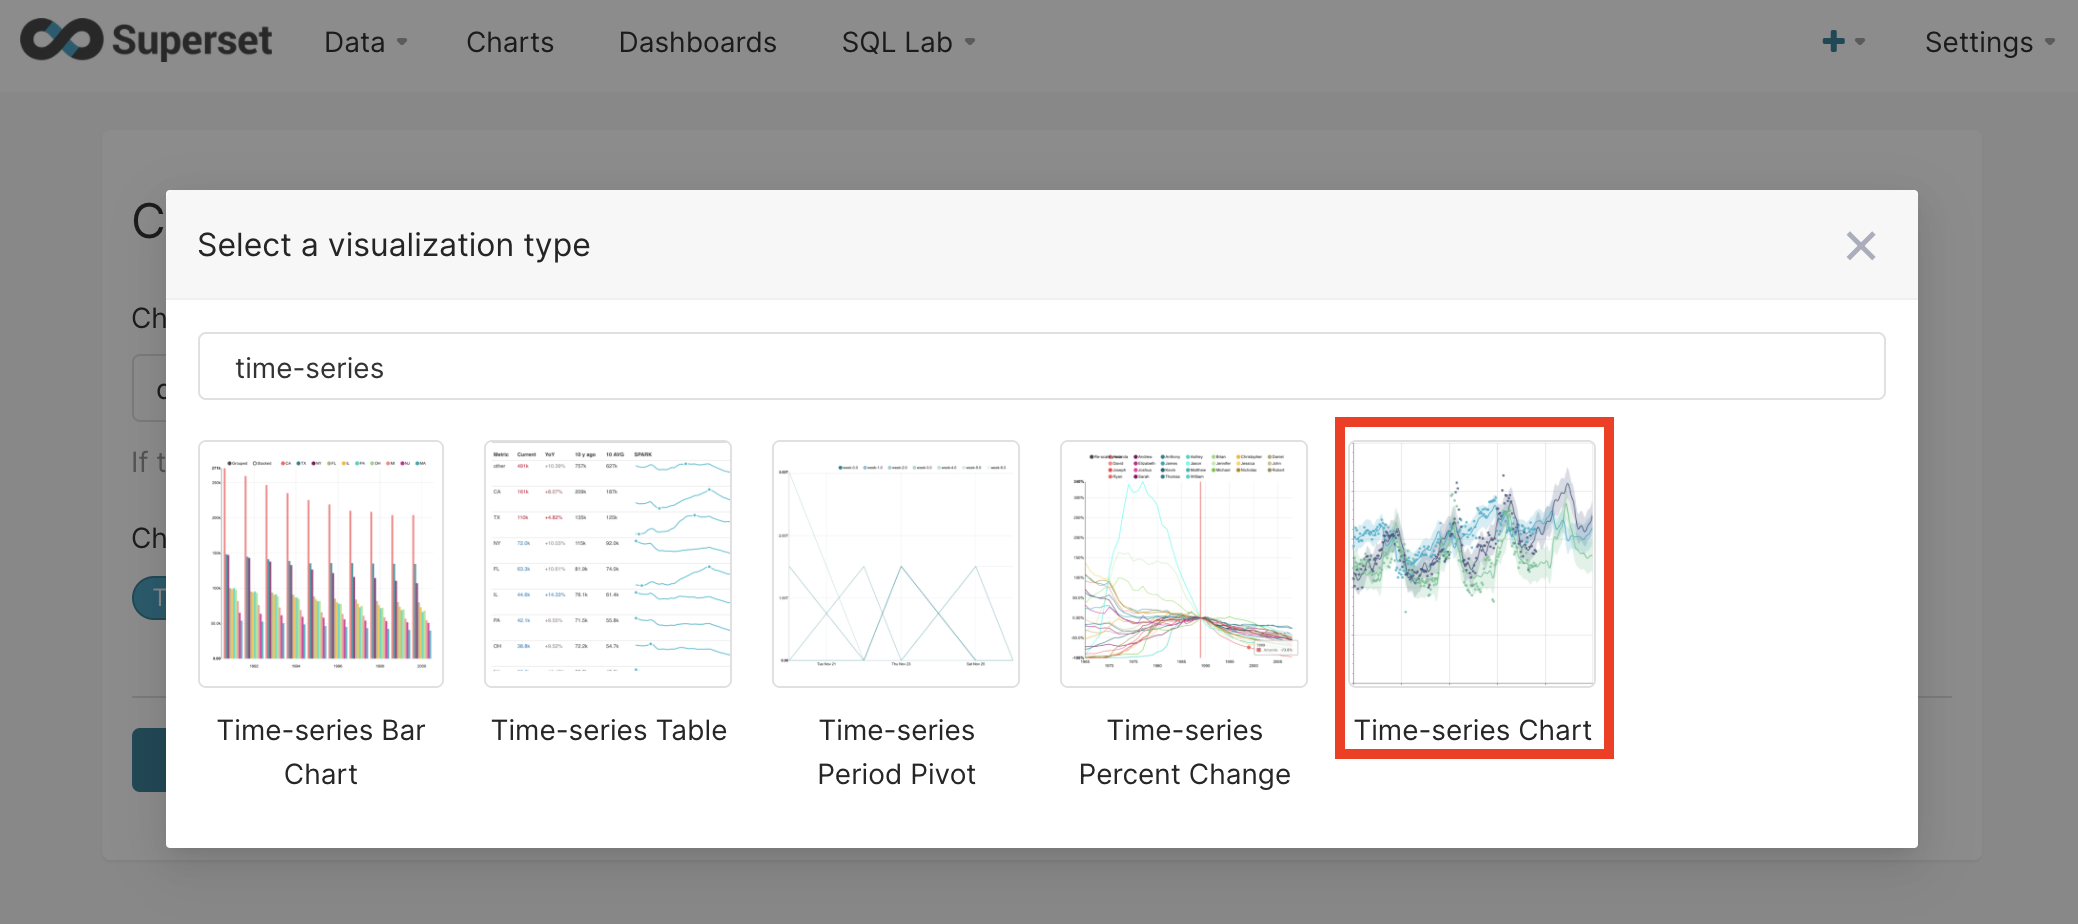
Forecasting with Prophet
In this blog, I will cover the time-series chart visualization type in more detail, and showcase the ad hoc analysis that can be performed with Prophet.
Create a new time-series chart and choose a time-series dataset. If following along with my previous blogs and your Druid cluster is running, the druid.wikipedia dataset should be available.
The chart controls are presented as a vertically scrollable bar on the left side. To the left of that, information about the dataset is displayed. Minimize that information to get more room to work with.
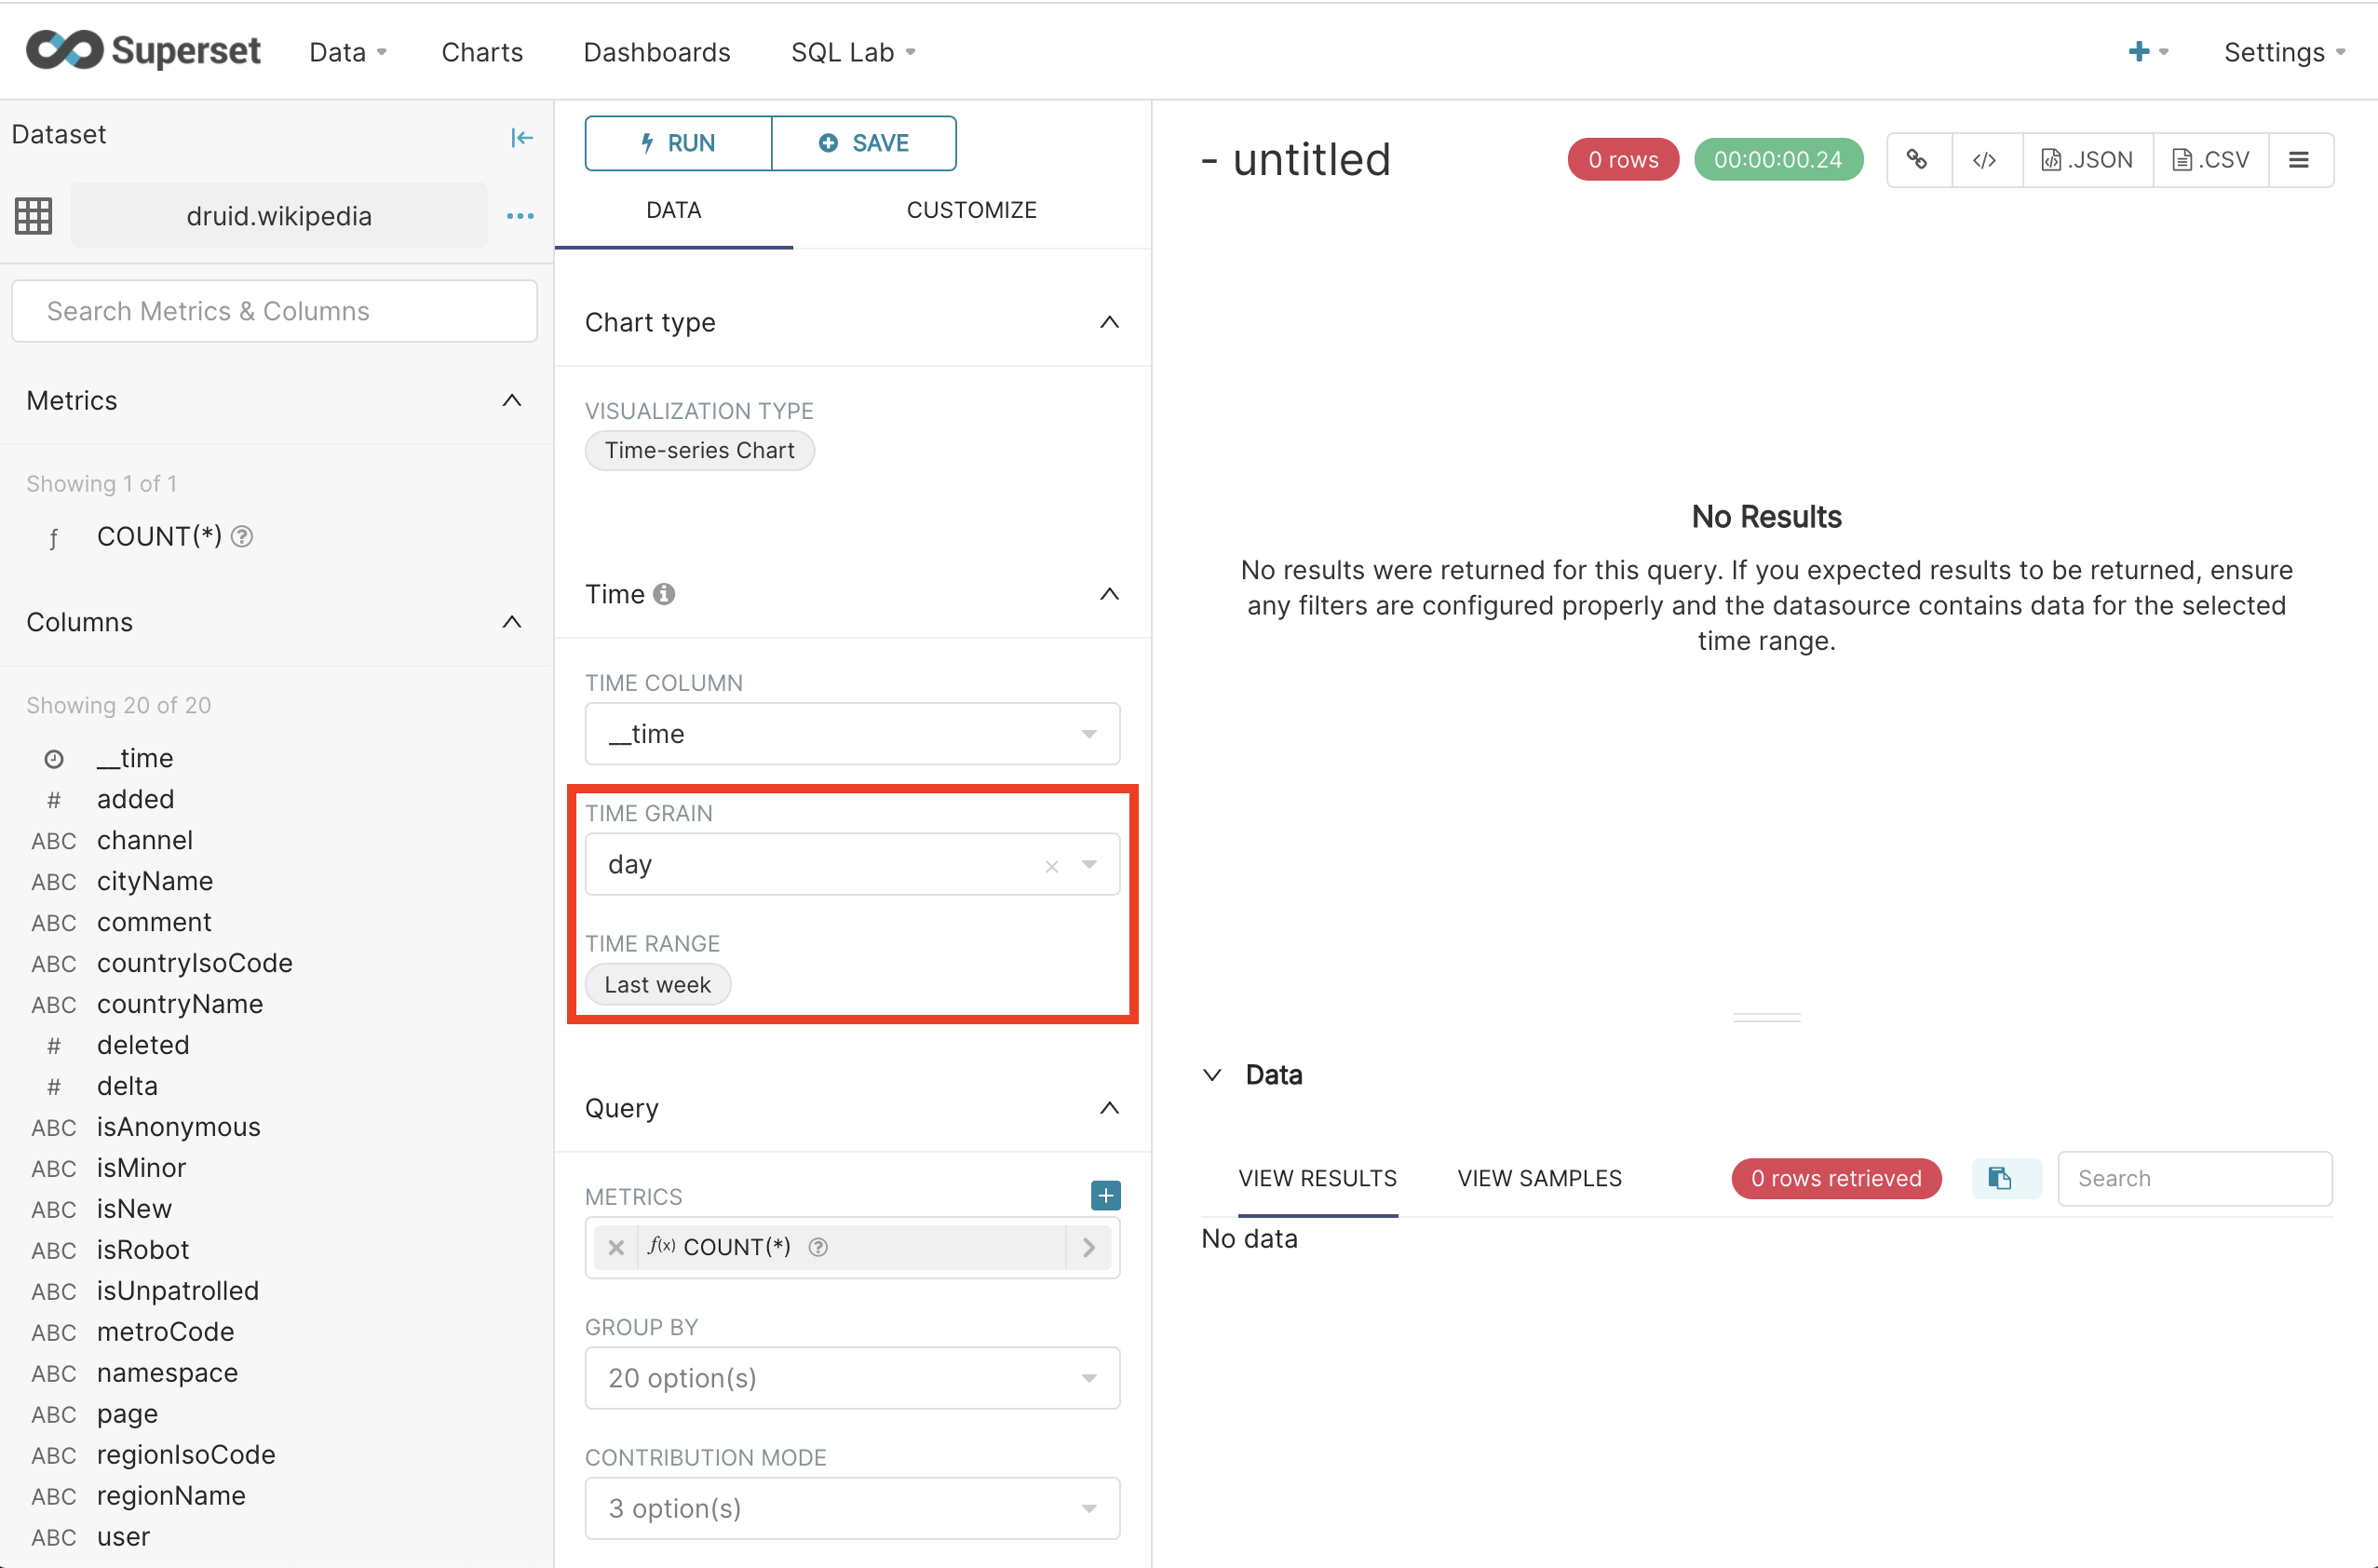
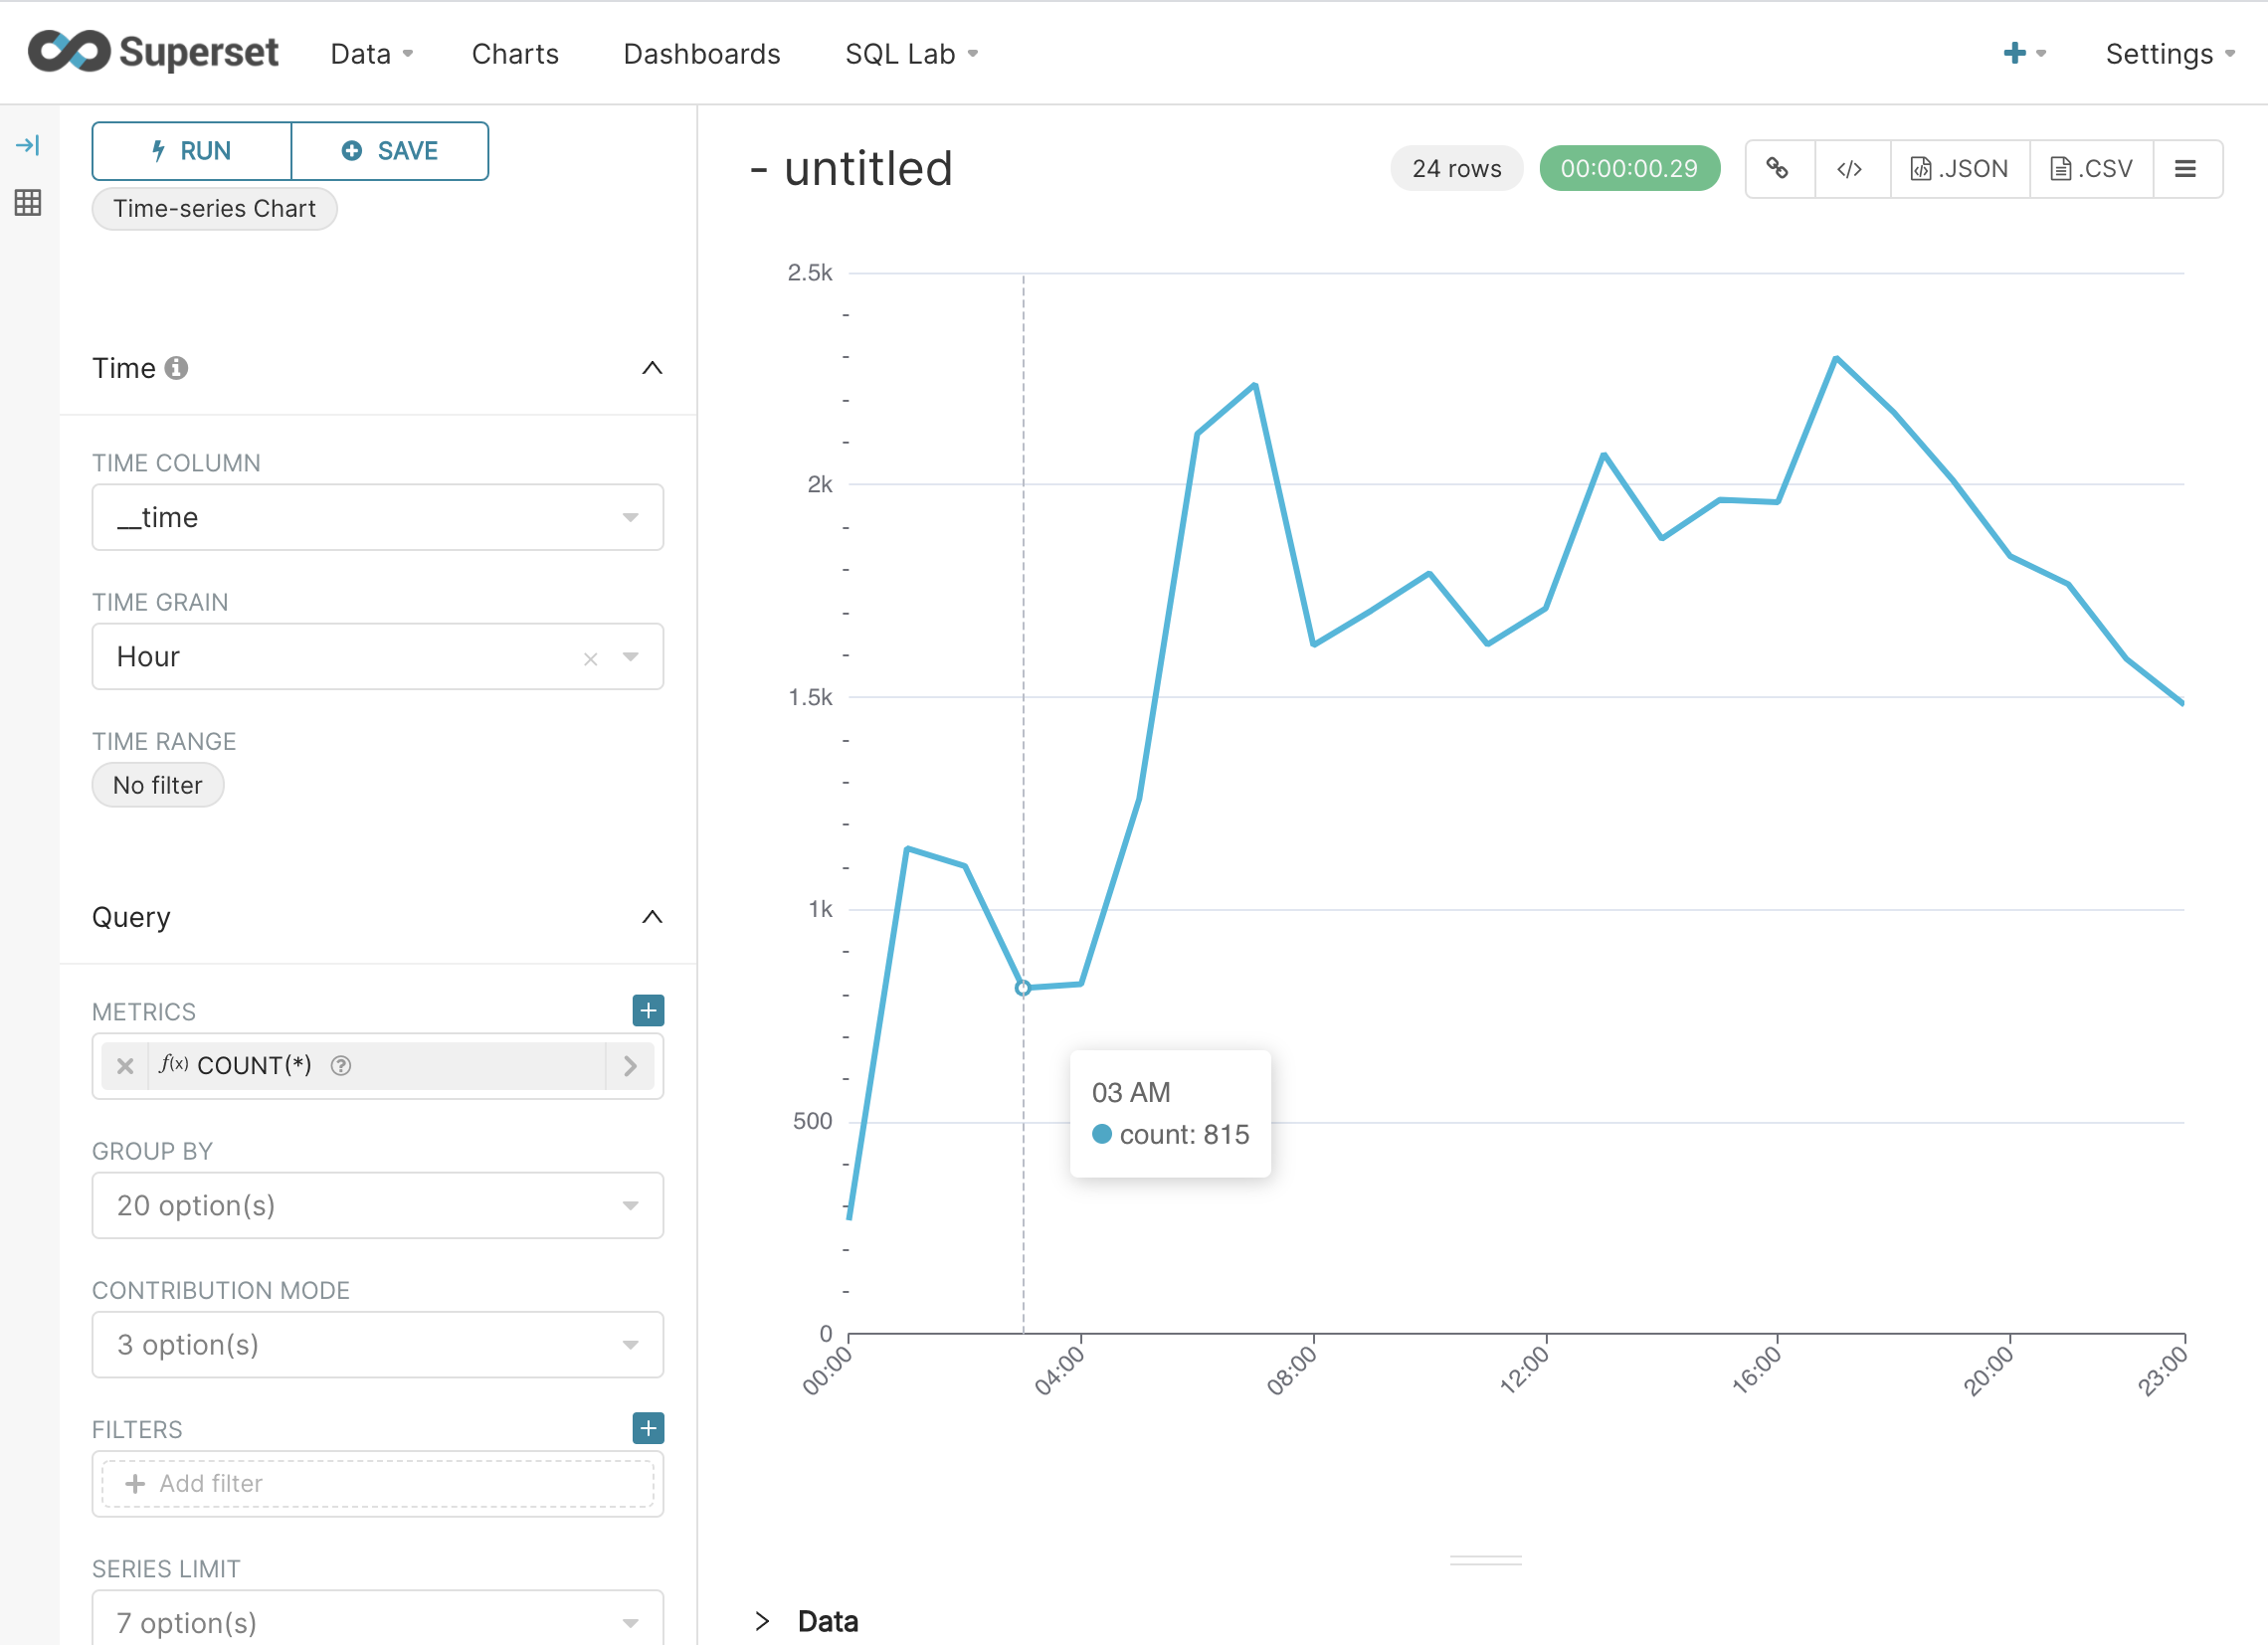
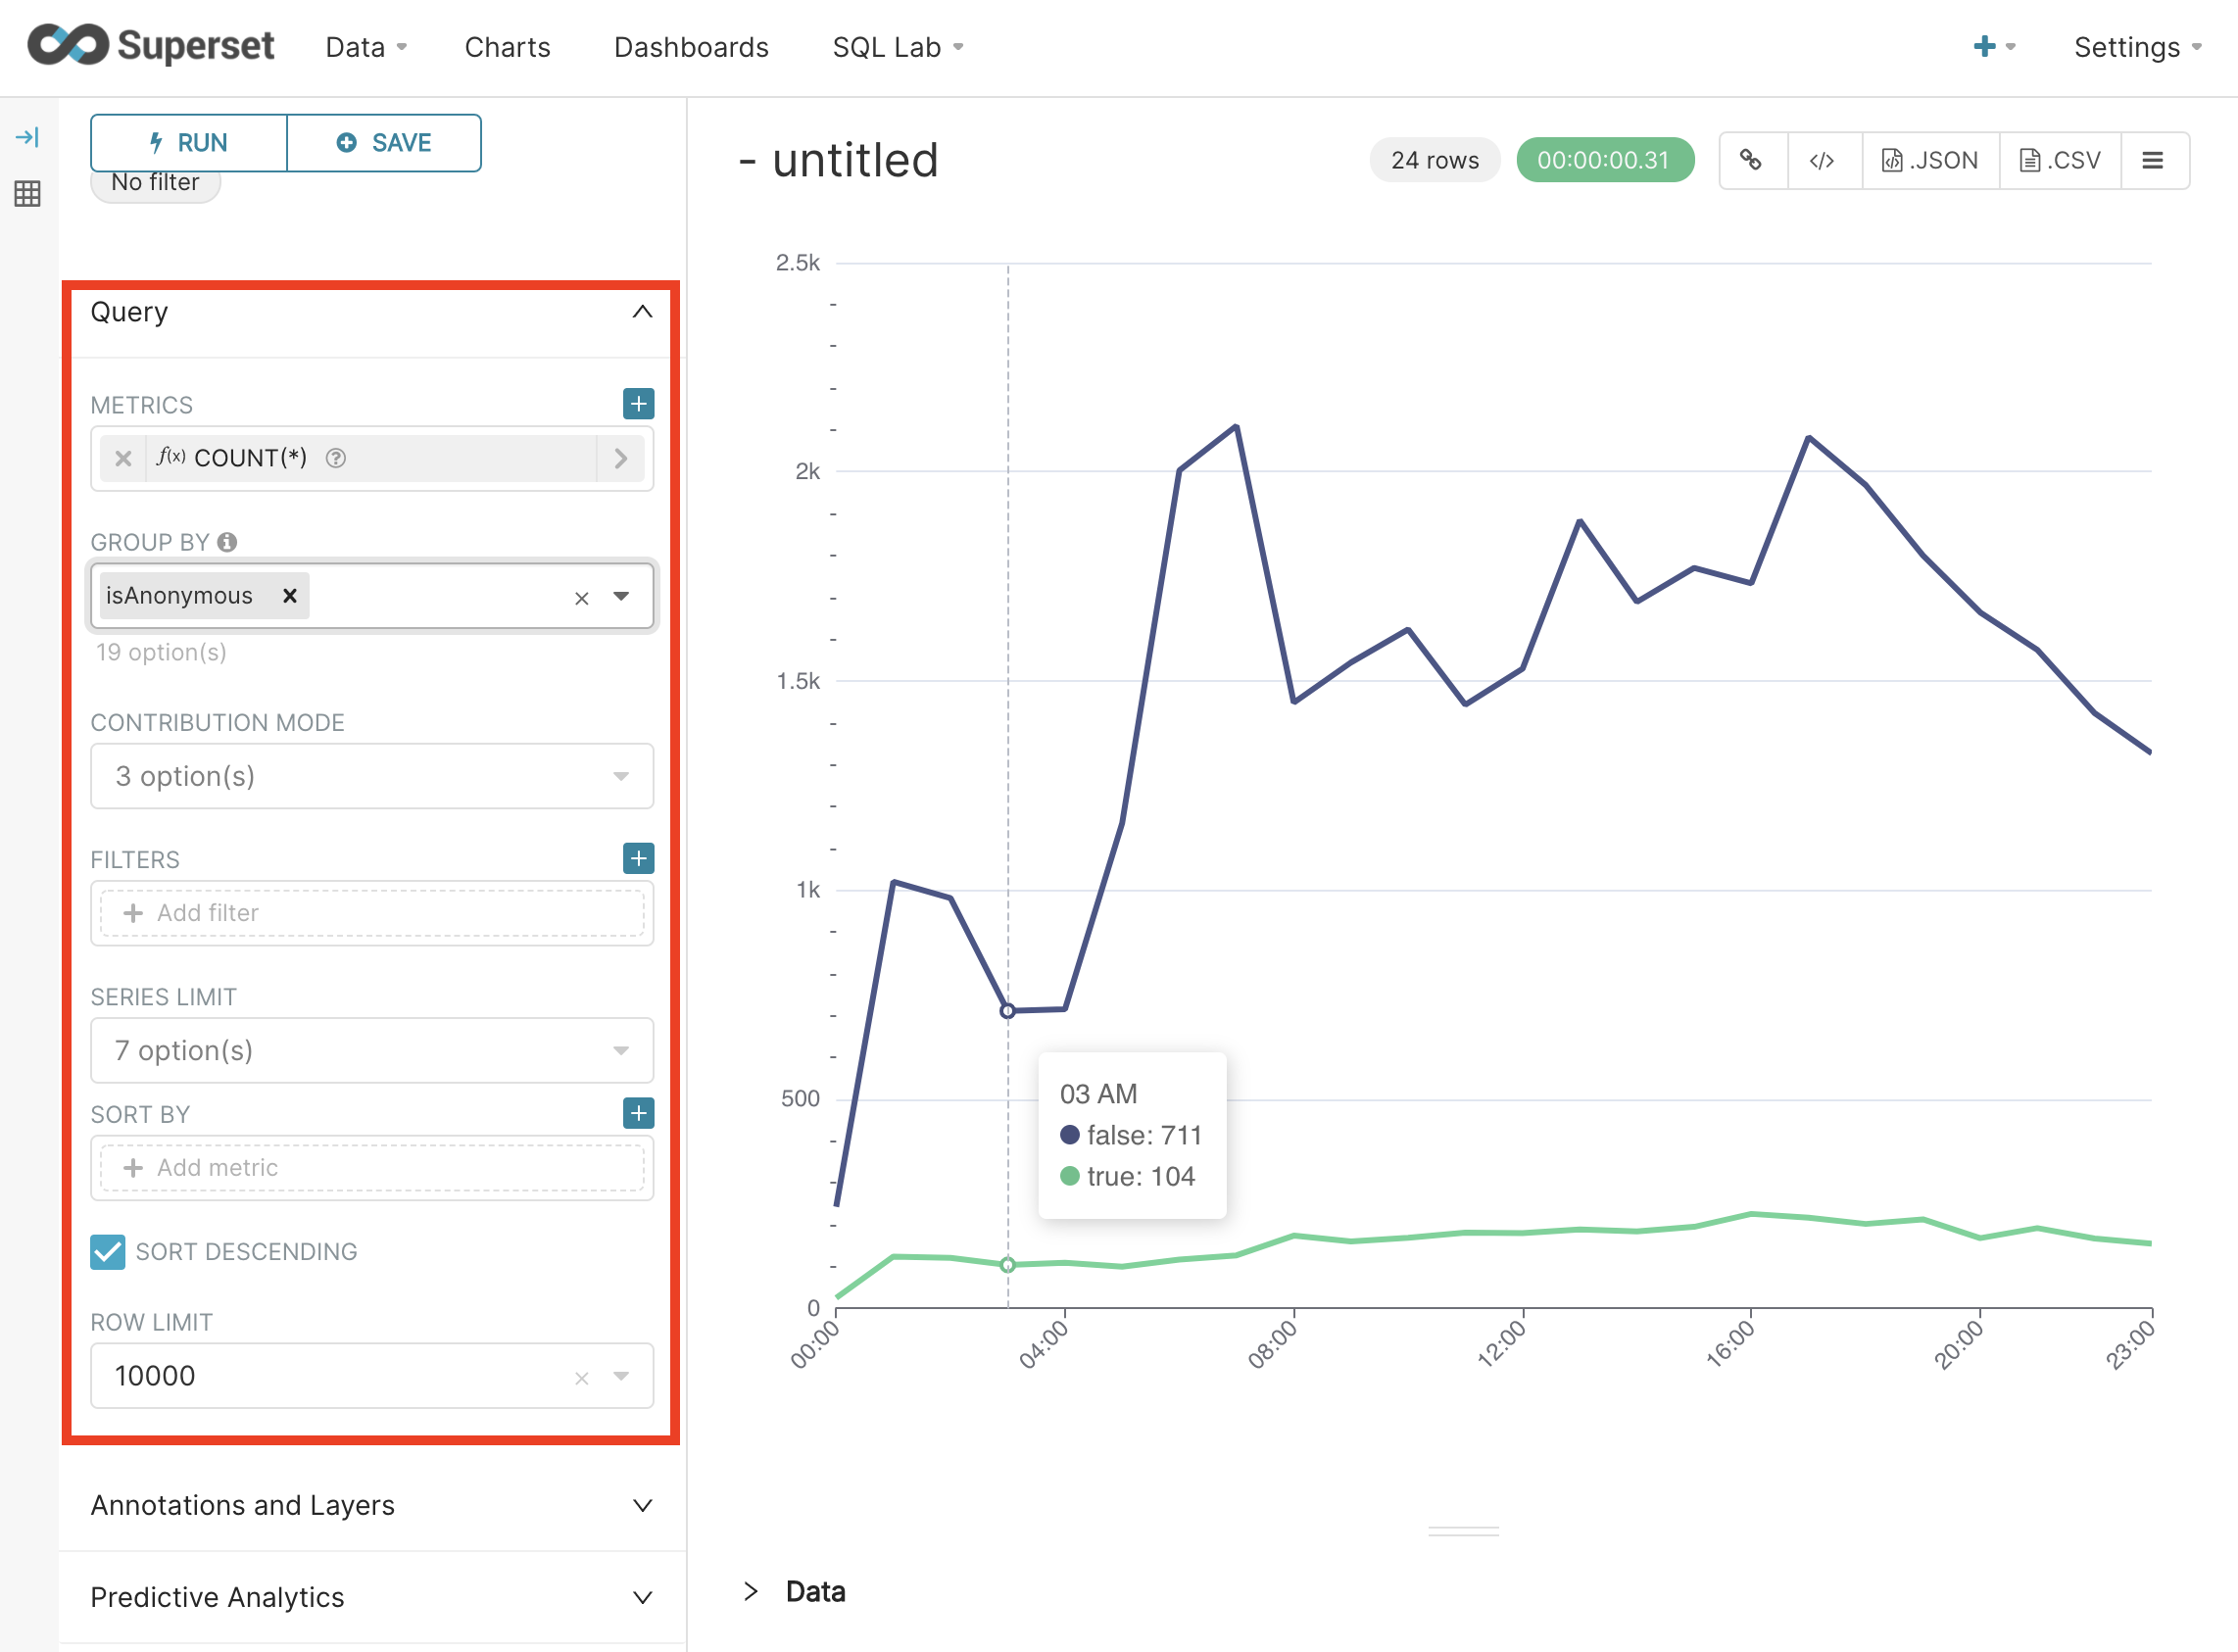
Below Chart type are the Time controls. TIME COLUMN specifies which column in the table contains the time domain. TIME GRAIN can be used to display the data with more or less granularity. Select Hour.
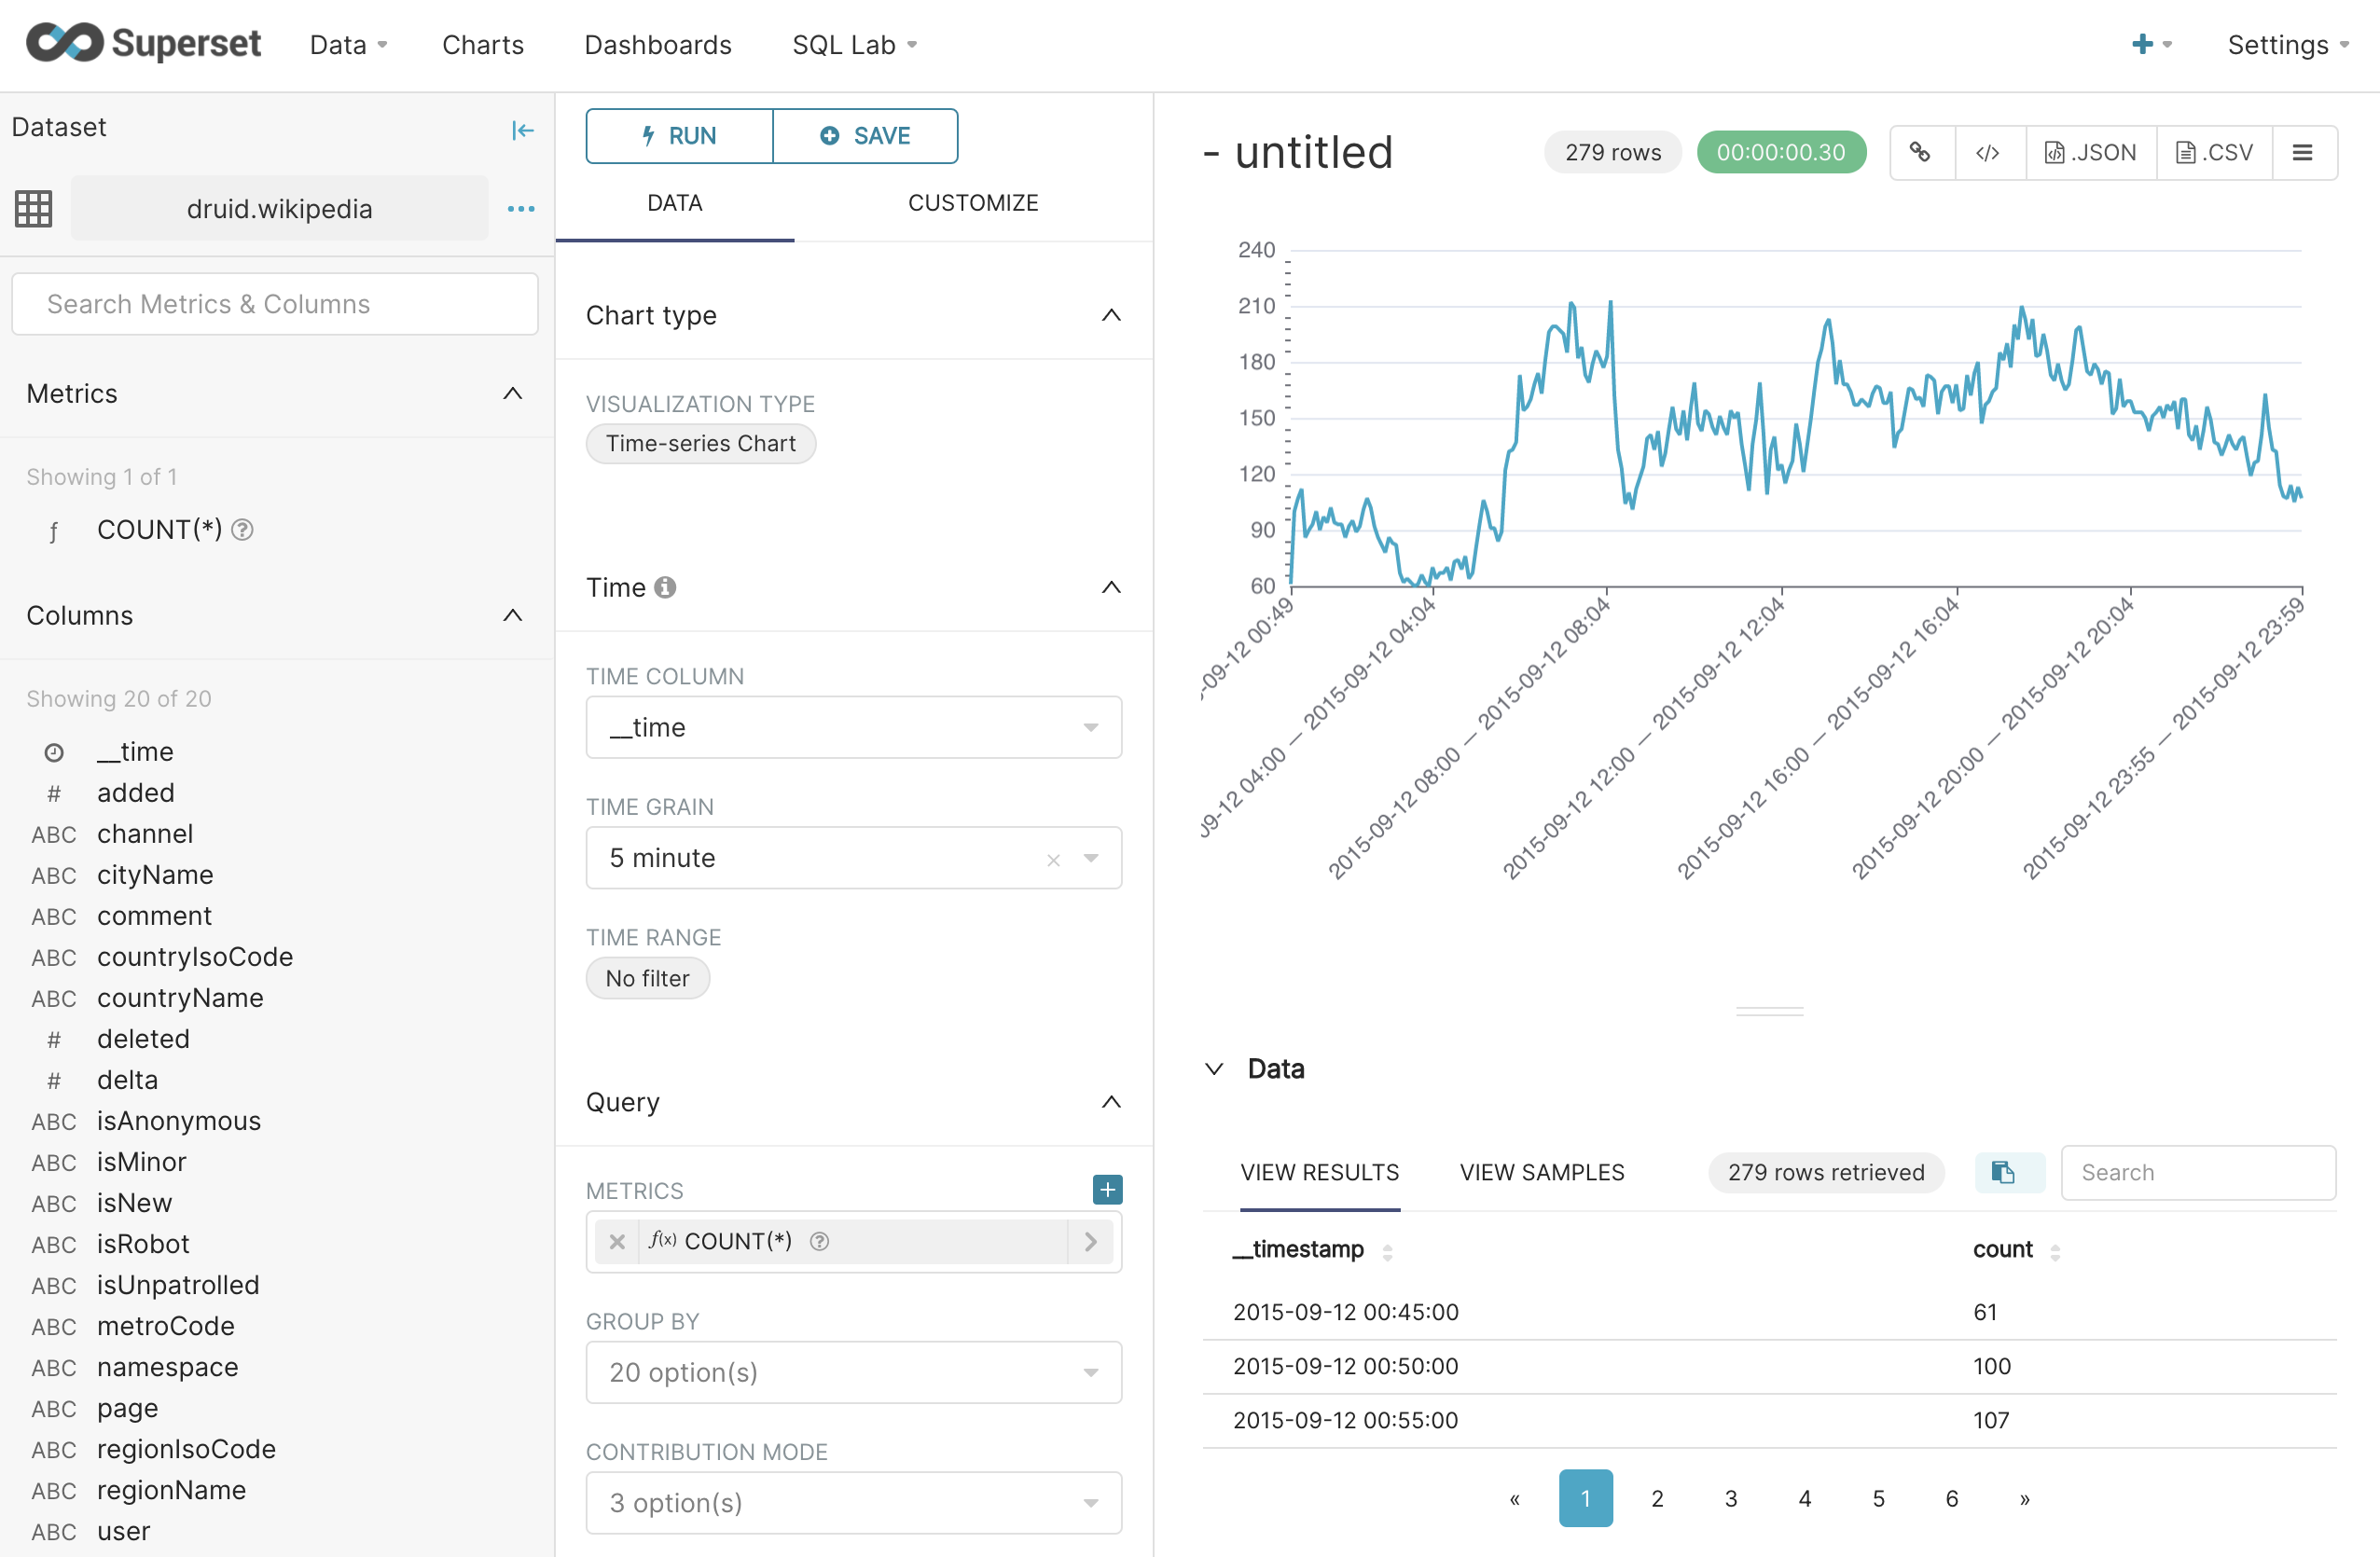
The TIME FILTER specifies what time ranges to exclude from the displayed data. In this case, we should click on and remove the default filter to allow the chart choose a time window that matches the data. Click Run query to re-generate the chart.
Below the Time controls are the Query controls, each of which provides a way of altering the underlying query in familiar ways.
- METRICS allows us to choose which aggregation are displayed on the chart.
- GROUP BY allows data to be summarized by certain properties. In this dataset,
isAnonymousis a boolean value that indicates if the edit was made anonymously. - CONTRIBUTION MODE, when turned on, shows each group's contribution to either total or the series as a percent.
- FILTERS allows us to include or exclude data by applying logical operators to specified columns, or write custom SQL queries to do the same.
- If the underlying table contains high cardinality dimensions, a common feature of many real-world time-series datasets, setting a SERIES LIMIT can improve the performance of the query.
- SORT BY and SORT DESCENDING controls which METRIC is used to order the data in the chart.
Below the query controls are the standard options for defining annotation layers, great for marking up a chart for presentation. Now we finally get to the good stuff.
Expand the Predictive Analytics panel. To enable Prophet, check the ENABLE FORECAST box. There are some further options below that.
- FORECASTING PERIODS lets us select how far into the future to predict. In general for real-world data, more distant predictions are often less likely to be accurate.
- CONFIDENCE INTERVAL specifies what level of statistical confidence to apply to the prediction. This same level is also applied to the part of the time-series for which we have data.
Important enough to deserve its own paragraph, SEASONALITY is a periodic oscillation in the underlying distribution that is often an important feature of many real-world time-series. For example, hourly temperatures rise and fall each day with the movement of the sun.Assumptions about seasonality and can be input on yearly, weekly, or daily periods. It is important to communicate the right assumptions about seasonality to Prophet, and in general Prophet is known for handling the complexity that seasonality introduces without much further tuning.
To increase the number of datapoints and improve the forecast at the expense of compute time, turn the time-grain down to 10 minutes. Assuming your data is not too noisy, using a finer time grain will improve Prophet's predictions (as a general principle).
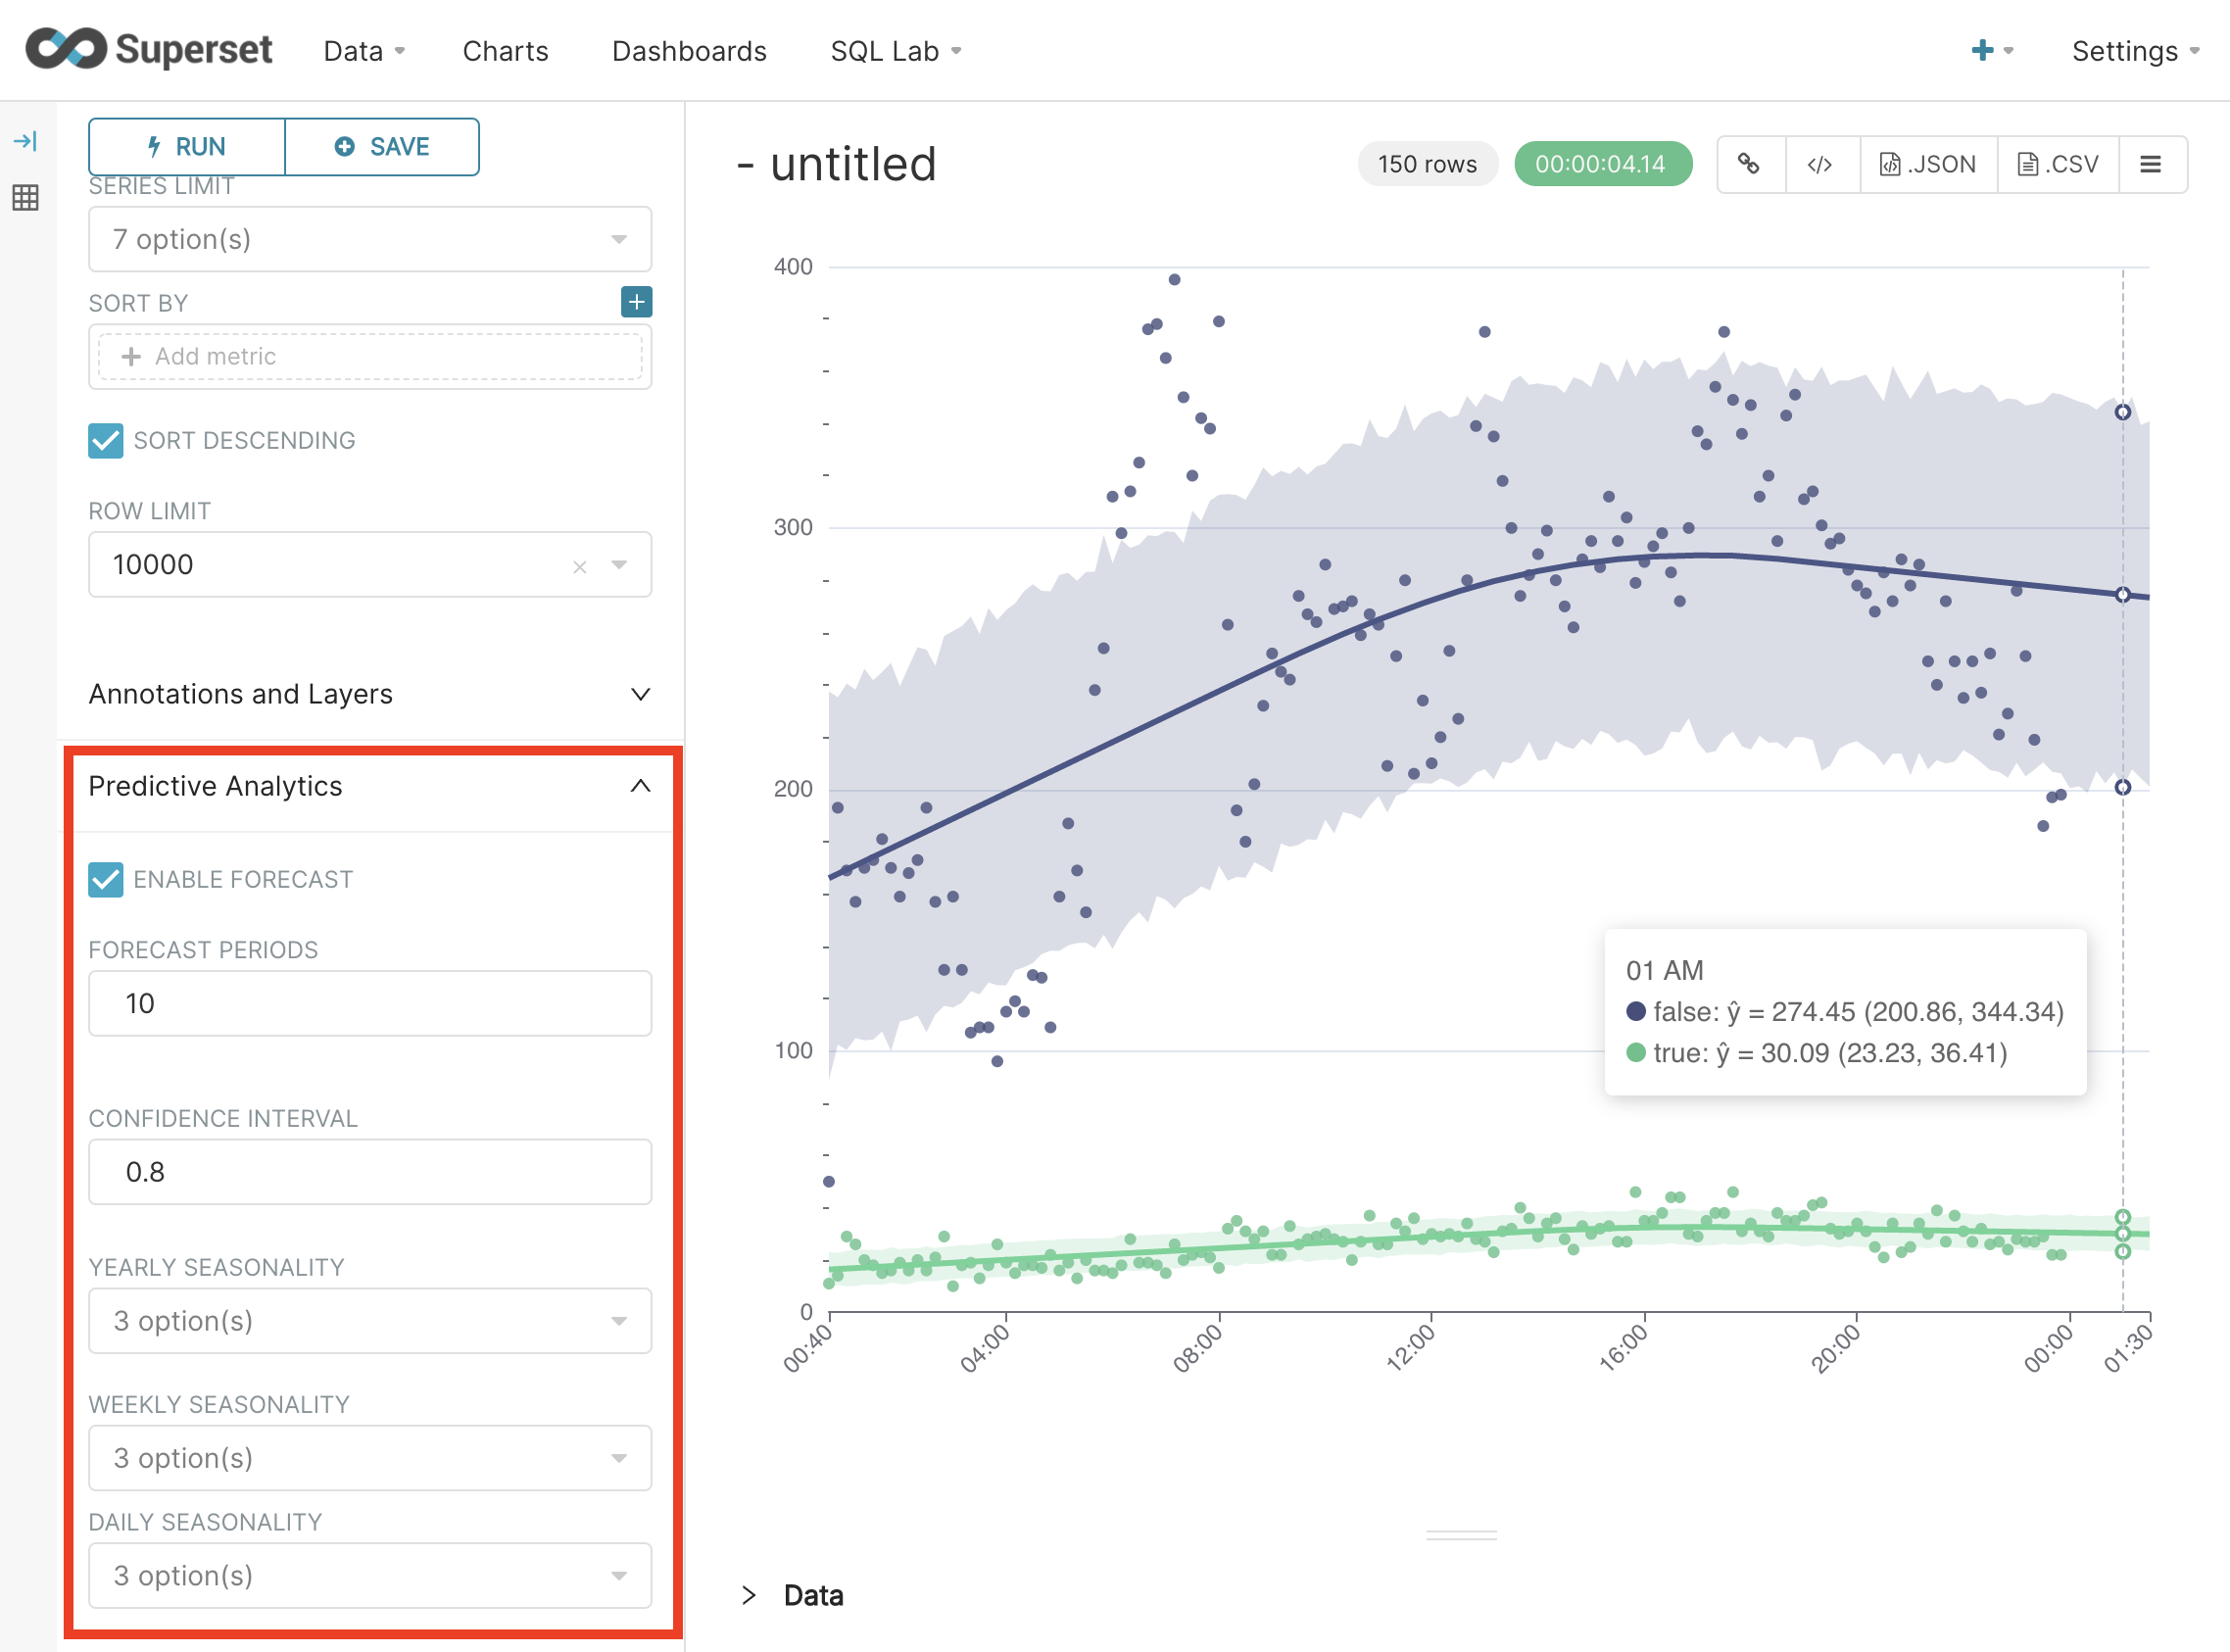
We can see Prophet's guess at the distribution, and its prediction for 10 periods into the future (100 minutes) at the end. A separate prediction is generated for each selected group. While there appears to be some periodic influence on the data, it doesn't fall clearly into daily, weekly, or yearly seasonality.
Give the chart a nice name and save it to a dashboard if you like!
The future of ad hoc analytics in Superset
Although the 'time-series chart' is the only chart that currently has Prophet, every time-series visualization in Superset has its own in-chart analytics drawn from other packages. I recently had the chance to talk with one of Preset's engineers (and distinguished contributor to the Superset project) Ville Brofeldt about this topic.
How did the idea to include Prophet at the chart layer emerge?
I had needed to do similar analytics in my previous role, and back then it occurred to me that the majority of time-series forecasting use cases seemed to have fairly minimal modeling requirements and fit well within the realm of BI.
What additional functionality would you like to see brought in from Prophet.
At least public holidays and additional regressors (I have a 50% done branch somewhere that adds support for additional regressors). Also Neural Prophet, as it’s a drop-in replacement.
What other analytics packages are planned (beyond Prophet and pandas)? What would you like to see?
Pluggable models beyond just TS, and non just-in-time models with proper serialization. You could periodically retrain models outside Superset and then just call predict on them in Superset. (love it)
How can someone from the community best contribute to this effort? What is the current low-hanging fruit in this area?
Someone with good typical Python Data Science-type skills who has a clear understanding of a few use cases within a corporate setting would be optimal. I think the next step would be to introduce support for custom models that can be called in the post_processing step in the chart data API.
In my opinion, ad hoc analytics is an area that Superset really shines as open source software. The ability of users to implement their own models expands what is possible for an data analyst to do without involving data engineers upstream.
Join us on the community slack, visit Superset on Github, and get involved!
