


Using Preset as a Data Access Layer for Other Data Applications


Preset Cloud is a modern, self-serve business intelligence tool that empowers all teams to use data to answer their questions. Users can build interactive dashboards with powerful filters that allows data to be explored quickly and easily. Despite that flexibility, there are cases where we still need bespoke applications for data visualization, with custom interactions that are hard or impossible to build with the Superset widgets.
For situations like this, the applications can still benefit from Preset, using it as a data access layer. Developers can delegate database connectivity, authorization, and caching to Superset, focusing instead on how to present the data and how to build the best experience for their users.
In this blog post, I'll showcase:
- how to use Preset’s APIs to load data from a connected database
- how to use a CLI tool to run queries interactively and programmatically
- and how to use a Python SDK to run queries on databases and datasets.
We’ll be using the Preset CLI that we introduced in a recent blog post, so check the post to learn how to install it and authenticate with it.
💡 Note that the Preset CLI requires API access to Preset, which is available in our Enterprise plan.
Querying databases interactively
The easiest way to access data via Superset is running the Preset CLI in REPL (read-evaluate-print loop) mode. First, let’s install the Preset CLI:
% pip install "git+https://github.com/preset-io/backend-sdk.git"The command above should preferably be run in a virtual environment; there are different ways to do that, my personal favorite being using pyenv. Once we have it installed we can generate and store credentials with:
% preset-cli auth
Please generate a new token at https://manage.app.preset.io/app/user if you don't have one already
API token: 35dac901-c775-43ff-8eb4-816edc061487
API secret: [will not echo]
Credentials stored in /Users/beto/Library/Application Support/preset-cli/credentials.yaml
After authenticating we can start a SQL interpreter with:
% preset-cli superset sqlIf we have more than one Preset workspace we will be prompted for a selection:
Choose one or more workspaces (eg: 1-3,5,8-):

# Team 1 #
✅ (1) The Data Lab
🚧 (2) New workspace

# Dev #
⤴️ (3) Test workspace
(Note that you can select multiple workspaces (eg, 1,3 to select 1 and 3), but if you do that the interpreter will first run on a workspace, and after exiting it will run again on the next workspace.)
We can also specify a workspace using the --workspaces flag and passing its URL, eg:
% preset-cli --workspaces=https://abcdef12.region.app.preset.io/ superset sqlSimilar to workspaces, if we have multiple databases in a workspace we should be prompted to select one or more database IDs:
https://abcdef12.region.app.preset.io/
Choose the ID of a database to connect to:
(2) Google Sheets
(4) BigQuery Sandbox (Ephemeral)
(5) BigQuery Production
After making a selection we should be able to run queries against that database. Queries can span multiple lines, and should terminate in a semi-colon. For example, let’s select database ID 2 (Google Sheets):
> 2
Google Sheets> SELECT * FROM country_cnt;
country      cnt
---------  -----
BR             2
BR             4
ZA             7
CR            11
CR            11
FR           100
FR             1
FR             1
FR             1
FR             1
FR             1
FR             1
FR             1
FR             1
FR            42
Google Sheets>
If we don’t want to be prompted we can pass the --database-id flag to specify a database from the command line; we can also specify a default schema with the --schema flag:
% preset-cli --workspaces=https://abcdef12.region.app.preset.io/ \
> superset sql --database-id=1 --schema=default
Finally, we also have the option to pass the SQL directly, skipping the REPL completely:
% preset-cli --workspaces=https://abcdef12.region.app.preset.io/ \
> superset sql --database-id=1 --schema=default \
> -e "SELECT 42 AS answer"
Technically the last example is not interactive, but programmatic. Let’s look at other ways in which we can run queries against databases programmatically.
Querying databases programmatically
The Preset CLI is written in Python, which means that we can easily call functions from a Python application or Jupyter notebook to run arbitrary queries in Superset. Here’s a simple script that runs a query in a given Preset workspace and returns a Pandas dataframe:
# example_script.py
from preset_cli.api.clients.superset import SupersetClient
from preset_cli.auth.jwt import JWTAuth

# load the credentials that were stored with `preset-cli auth`
auth = JWTAuth.from_stored_credentials()

workspace_url = "https://abcdef12.region.app.preset.io/"
client = SupersetClient(workspace_url, auth)

df = client.run_query(
    database_id=1,
    schema=None,
    sql="SELECT 42 AS answer",
    limit=1,
)
print(df)
Running the script will print:
% python example_script.py
answer
0      42
As a more complex example, let’s reproduce one of the charts that comes with Superset, “Games per Genre over time”:
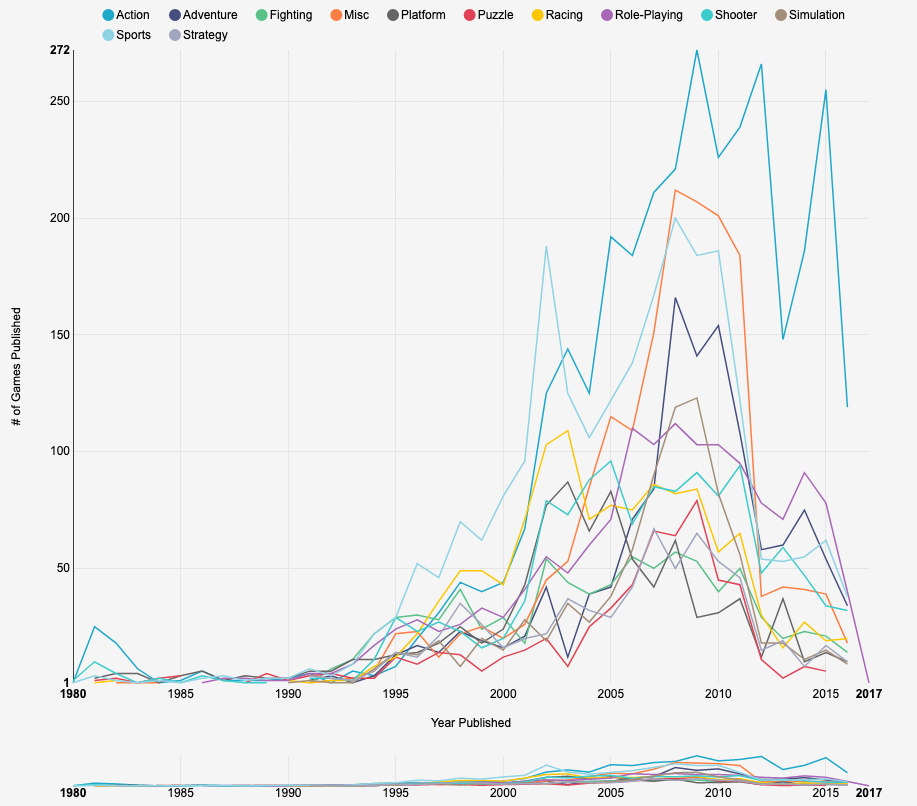
We can reproduce it quickly with this script:
from preset_cli.api.clients.superset import SupersetClient
from preset_cli.auth.jwt import JWTAuth

sql = """
SELECT year AS __timestamp,
               genre AS genre,
               COUNT(*) AS count
FROM public."Video Game Sales"
GROUP BY genre,
         year
ORDER BY __timestamp DESC
"""

auth = JWTAuth.from_stored_credentials()
workspace_url = "https://abcdef12.region.app.preset.io/"
client = SupersetClient(workspace_url, auth)

df = client.run_query(
    database_id=1,
    schema=None,
    sql=sql,
)

df.set_index('__timestamp', inplace=True)
_ = df.groupby('genre')['count'].plot(legend=True)
We can then easily plot the chart using a Jupyter notebook with:
df.set_index('__timestamp', inplace=True)
df.groupby('genre')['count'].plot(legend=True)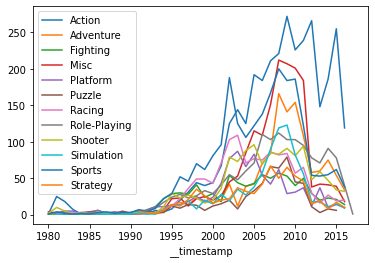
Authenticating
If we don’t want to store the credentials in a file we can pass the JWT token or the Preset token/secret pair explicitly to the JWTAuth class:
from preset_cli.auth.lib import get_access_token

preset_url = 'https://manage.app.preset.io/'
jwt_token = get_access_token(preset_url, api_token, api_secret)
auth = JWTAuth(jwt_token)
client = SupersetClient(workspace_url, auth)
Querying datasets programmatically
In addition to running SQL, Superset also offers a dimensional query API based on datasets. This API allows users to enrich data using the Superset dataset-centric semantic layer, and then query these objects from Python. Instead of using SQL, the API basically takes into consideration metrics, dimensions, and filters.
Here’s a simple example, again using Python:
from preset_cli.api.clients.superset import SupersetClient
from preset_cli.auth.jwt import JWTAuth

auth = JWTAuth.from_stored_credentials()
workspace_url = "https://abcdef12.region.app.preset.io/"
client = SupersetClient(workspace_url, auth)

# the "World Bank Health Data" dataset
dataset_id = 1

df = client.get_data(
    dataset_id=dataset_id,
    metrics=['SUM("SP_POP_TOTL")'],
    columns=["country_name"],
    order_by=['SUM("SP_POP_TOTL")'],
    order_desc=True,
    row_limit=10,
)
print(df)
The query above will return the sum of total population (SUM(”SP_POP_TOTL”) for the top 10 countries, since it limits the results to 10 rows and sort them in descending order according to the main metric.
We can also use the API to run queries involving timeseries. Here’s the video game sales example, but for the period between 2000 and 2010:
from datetime import datetime

df = client.get_data(
    dataset_id=dataset_id,
    metrics=["COUNT(*)"],
    columns=["genre"],
    is_timeseries=True,
    time_column="year",
    start=datetime(2000, 1, 1),
    end=datetime(2010, 1, 1),
    order_by=["year"],
)

# plot with Jupyter notebook
df.set_index('__timestamp', inplace=True)
_ = df.groupby('genre')['COUNT(*)'].plot(legend=True)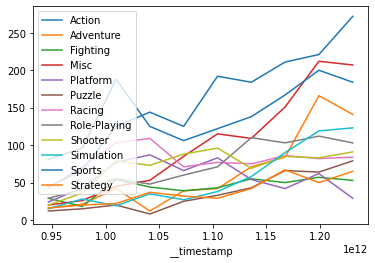
In the query above we’re defining an ad-hoc metric (COUNT(*)), but we can also reference by name any metrics that are already defined in the dataset. We can use our client to get a list of metric names in a given dataset:
print([
    metric['metric_name']
    for metric in client.get_dataset(dataset_id)['result']['metrics']
])
This is way it’s easy to separate the responsibilities of building datasets in Superset (e.g., by a data engineer that knows the data and relevant metrics well) and exploring them in a Jupyter notebook or bespoke web application.
Final words
In this blog post we explored how to use Superset as a data access layer, running SQL and querying datasets in different ways. This allows us to build custom data visualization applications that leverage Superset for database connectivity, authorization, and caching, permitting developers to focus only on displaying the data.
This is a deep subject, of which we barely touched only the surface. There’s a lot more that can be done here:
- embedding Superset charts as native components in React applications
- building interactive applications which filter the data based on user events
This post is the first in a series of posts, so stay tuned and subscribe for future posts!
