


Entity-Centric Data Modeling for Analytics Teams


Context
In this blog post, I am introducing entity-centric data modeling (ECM), a new approach to data modeling for analytics that elevates the core idea of an “entity” (ie: user, customer, product, business unit, ad campaign, etc) at the very top of things. Many of the ideas here are not new and are inspired by combining concepts from dimensional modeling and feature engineering - pushing to anchor on “entities” and to actively bring metrics and more complex data structures inside dimensions.
Innovation in data modeling is as important as it is abstract. Providing the right methodologies and abstractions for data consumption is critical as it accelerates self-service, data democratization and ultimately enables more people to make data-driven decisions faster.
Before going deep into it, note that this blog post is somewhat abstract and assumes foundational knowledge in data modeling for analytical workloads, some familiarity with dimensional modeling, feature engineering, an understanding of data normalization/denormalization, and analytics in general.
At a high level, this approach pushes towards denormalizing key metrics, events, and related entity attributes into entity tables to best support entity-bound analysis with simple queries (without having to use JOIN , UNION ALL, or subqueries).
Now, let’s jump in!
P.S., riding the data engineering-inspired art in the post is AI-generated by Midjourney!
The Case for Elevating Entities
In business analytics, we are often more interested in approaching a specific analysis while thinking about entities rather than facts. We are interested in better understanding our users and their behavior, our products and how they flow, comparing and fine-tuning ad campaigns and their performance, comparing how different business units are evolving, and so on.
In predictive analytics and machine learning (ML) in general, feature engineering is generally heavily centered around entities because it is designed to capture the relevant information in the data that is most predictive of the outcome variable. For example, if we want to predict the likelihood of a customer churning, we would be interested in all of the “features” or attributes of the customers that may predict churn. Logically, on top of your categorical attributes like demographics, the features that best predict an outcome are often behavioral, numerical, and time-bound. Metrics around usage frequency, recent engagement decrease, and negative support interactions - along with demographics - may help churn prediction models perform well.
Across the data landscape, the case for centering on entities for data modeling is strong: most analyses are heavily anchored around a specific entity, so enriching entity datasets with more attributes, metrics, and information from neighboring entities is immediately useful. What is also important is the fact that people’s mental model of data is also entity-centric: everyone intuitively understands how tabular datasets work (think spreadsheet), especially when it provides the guarantee that every row is an instance of an entity. Knowing this, the more important an entity is to your organization, the more it makes sense to enrich it with all sorts of useful metrics and data structures, right next to its attributes.
Dimensional modeling does a great job at capturing, summarizing, and simplifying the underlying logical model with its fact and dimension tables approach, and makes it really natural to do a multi-dimensional analysis of facts. Where it comes short is while doing multi-factual analysis of entities, which I argue is not only a common pattern but a more common one that is more tightly aligned with modern analytics needs and workloads — more on dimensional modeling in the next section of this blog post.
To perform such analysis, the process of assembling various facts around a specific entity can be cumbersome, scrambling around many fact tables while handling the time dimension and merging these facts around the entity of interest.
In contrast, an entity-focussed wide dataset (ie: user, customer, ad campaign, …), with a large though clearly labeled set of columns, is highly intuitive and easy to use for everyone.
This blog post is about enriching your datasets to be more entity-centric and making it easier for users to analyze specific entities (such as users, customers, products, and campaigns) by collecting facts and metrics related to growth, engagement, performance, activity, and more. The idea is that by including more useful metrics within entity tables, it becomes easier to perform powerful analyses such as segmentation, cohort creation, and complex classification without the need for writing complex queries.
Also note that in the past, I’ve spoken and written about “The Case for Dataset-Centric visualization”, the idea being that visualizations/BI tools work best with simple tabular datasets as opposed to complex semantic layers or sets of more normalized datasets. The entity-centric approach builds upon these ideas and pushes them further in a more prescribed way. Entity-centric is a category or methodology that expands onto the dataset-centric approach and embodies its principles.
How Does This Relate to Dimensional Modeling?

As a Ralph Kimball disciple, I have been building star schemas and practicing dimensional modeling for more than two decades now. The techniques and ideas here are well documented and make for a very decent abstraction to support analytics.
A lot has been written about “dimensional modeling” but ChatGPT summarizes it well:
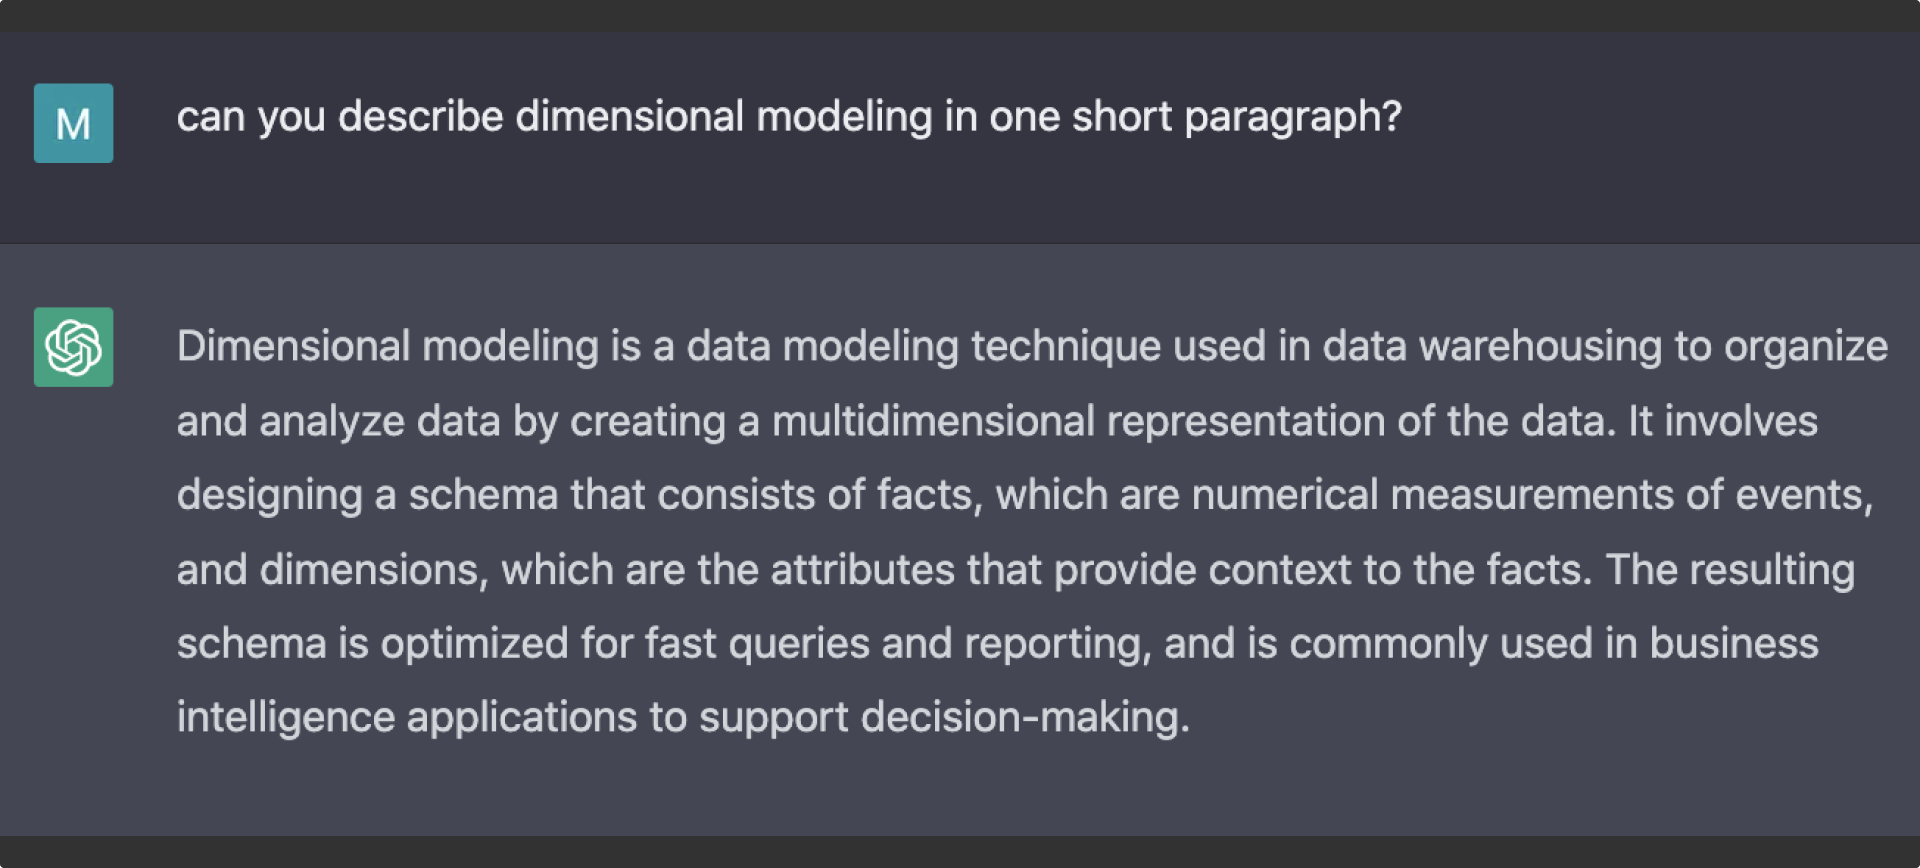
Dimensional modeling as a methodology is sound and constitutes a solid set of practices around data modeling and data warehousing. The idea behind the entity-centric model is to push it further by enriching those dimensions with metrics and data structures.
With ECM, we are addressing the fact that bringing a collection of metrics alongside an entity while using a dimensional model is tricky. Here’s Kimball’s take on performing these types of queries:
Multipass SQL to Avoid Fact-to-Fact Table Joins
A BI application must never issue SQL that joins two fact tables together across the fact table’s foreign keys. It is impossible to control the cardinality of the answer set of such a join in a relational database, and incorrect results will be returned to the BI tool. For instance, if two fact tables contain customer’s product shipments and returns, these two fact tables must not be joined directly across the customer and product foreign keys. Instead, the technique of drilling across two fact tables should be used, where the answer sets from shipments and returns are separately created, and the results sort-merged on the common row header attribute values to produce the correct result.
Kimball’s statement here talks about the complexity of issuing multiple SQL statements and merging the results, and he defers on the BI tool to address this complexity. To me, this clearly highlights the fact that multi-fact analysis on a given entity is challenging while using dimensional models.
To address this, ECM recommends enriching your dimension datasets with key metrics and data structures (more on how to actually do this later), reducing the need to run more complex queries. To be clear, ECM aligns closely with dimensional modeling as it is entity-centric in many ways and supports the existence of fact tables; it just considers that metrics can also live in the dimension tables.
In summary, where Ralph Kimball would frown upon bringing many metrics in dimension tables (to him, metrics strictly belong in fact tables) and would not have considered using more complex data structures as they were not common practice in his era, the entity-centric approach actually prescribes doing this and offers methodologies as to how to do this well - more on that later on.
How Does This Relate to Feature Engineering?

Feature engineering is the process of extracting meaningful features from raw data that can be used to train machine learning models. In practice, feature repositories — where features are engineered, materialized, documented, and shared — are typically heavily entity-centric. Most features are anchored on specific entities and defined for each instance of such entities, and it's common to have metrics and time window aggregation of those metrics. In practice, feature engineering often involves denormalizing every facet of an entity as a feature.
The needs to support ML use cases are intricately similar to the need to support analytics use cases, but they are also intricately different. One of the main differences is in the discovery nature of ML, where we often do not know what feature will be useful or picked up by the model and tend to cast a very large net. Note that despite recent advances in feature engineering practices and innovation around feature repository infrastructure, these are not widely adopted. If your organization has invested in that area, it's likely that there's a set of entities and related features that are "core" to your organization and shared across ML and analytics use cases. Having features centralized, computed, and documented from a piece of infrastructure seems like a virtuous thing to do, assuming the data engineers and data scientists in your organization can agree on how to do things.
Having a "feature mindset", which involves thinking about the data in an entity-centric, flat, and wide way, is extremely common in data science, and this mindset is powerful. For example, thinking of "user visits" as a set of features in the user table, like "7d visits", "28d visits", and "total visits since account creation", allows us to think in terms of cohorts and distributions, such as "users who visited more than 14 out of the past 28 days are significantly more likely to use feature X". The idea behind ECM is to bring that mindset and the power that comes with it to the analytics and data warehousing side of the fence. In other words, the goal is to take the entity-centric thinking and flat, wide data modeling techniques that are commonly used in feature engineering and apply them to analytics and data warehousing. More could be written about this mental model and why it's powerful, but that will have to wait for a future blog post.
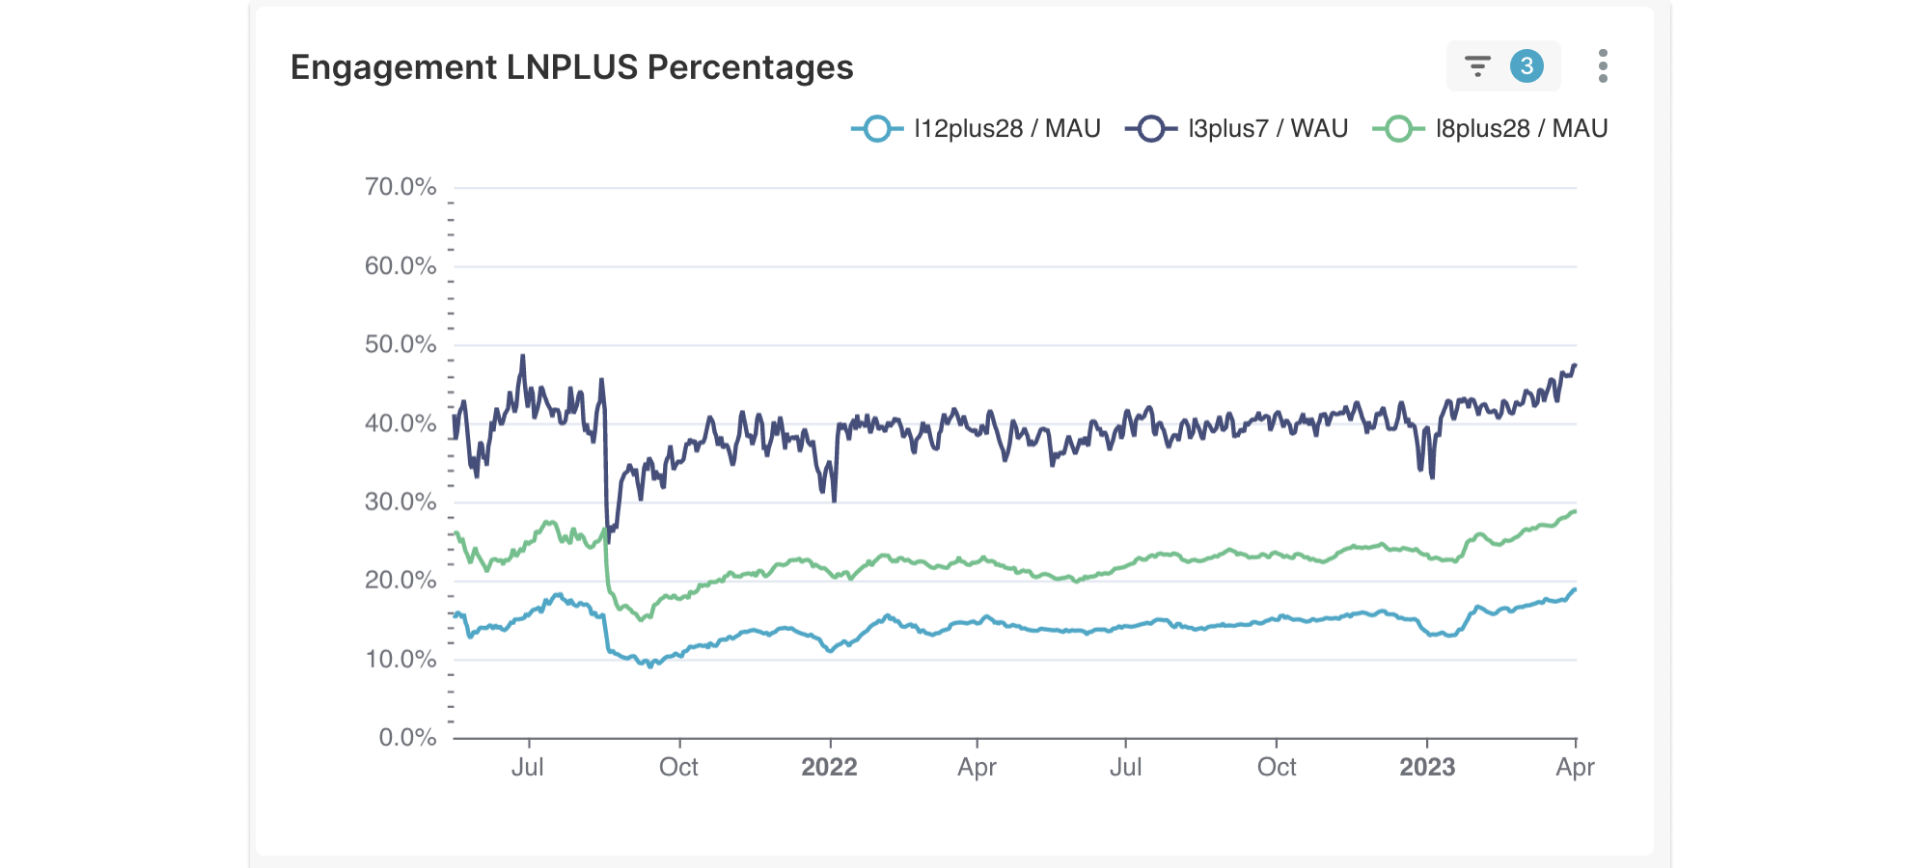
Figure 1: An example chart looking at a distribution of 7D visits. This counts the number of users who visit 1,2,…,7 days out of the past 7 days. It’s effectively a breakdown of Weekly Active Users WAU by over a decent proxy for engagement. Having 7D visits handy in the user entity table makes it easy an simple to create this type of chart.
Approaching Entity-Centric Modeling (ECM)
Time Management

One of the main arguments against including metrics in dimensions is the need for flexibility around time series analysis. However, we can overcome this challenge in two ways:
1. Using time-bound metrics
To address the time constraint, we can pivot a metric given a key or arbitrary time interval, such as 7d_visits, 28d_visits, 96d_visits, and total_visits for the metric "user visits". For example, we can bring current Annual Recurring Revenue (ARR) in a customer table and also bring arr_90d_ago and arr_1y_ago to easily derive 90d and 1Y expansion, contraction, churn, new customers, and infer Net Revenue Retention (NRR).
Timeframes tend to be multiple of 7 to prevent weekly patterns, insuring each day of the week is equally represented over time. 7, 28, 84, 168, 364 seem to be very common.
More generally, it is important to focus on the key metrics and meaningful timeframes that best characterize the entity to be analyzed. Progressive adoption of this dimensional metric enrichment approach is also key to avoiding overly wide tables.
2. Dimensional snapshot
In the functional data engineering methodology post, I recommended “snapshotting” your dimensions for a variety of reasons, and for reasons that are not immediately related to this entity-centric approach. The practice can be described as keeping a full snapshot of your dimension, for every single day in the past. This is a lazy alternative to slowly changing dimension modeling techniques that offer the following benefits/tradeoffs:
- [+] Easy to manage and maintain, minimizing mutations and fitting the functional approach to data engineering
- [+] Easy point-in-time querying / comparisons
- [+] Easy time-series analysis on how entities are evolving over time
- [-] Increased, super redundant storage of information - but who cares in the infinite cheap storage/compute world, especially given dimensions being relatively small in relation to facts
It is important to recognize that the latest partition is most useful as it represents the current state. It is common to use table partitioning techniques and to set a view to point to the latest partition for easy/optimal access. We recommend having clear naming conventions around this, as in core.user_history and core.user.
It is also common perform incremental loads every day, and to issue predicate queries based on time; as such, partitioning by day is common practice for these snapshot tables.
Maintaining these tables using a functional data engineering approach is beyond the scope of this blog post, but is likely to be the topic of a follow-up blog.
Note that snapshotted dimensions can be combined with time-bound metrics to run complex analyses. For example, we can determine the percentage of weekly_active_users (WAU) who have visited 3 or more days out of the past 7 days (visits.7d >= 3) and how that has been evolving over the past year, and then break it down by demographics. Another example is to examine how many users who visited more than 14 out of the past 28 days performed action X.
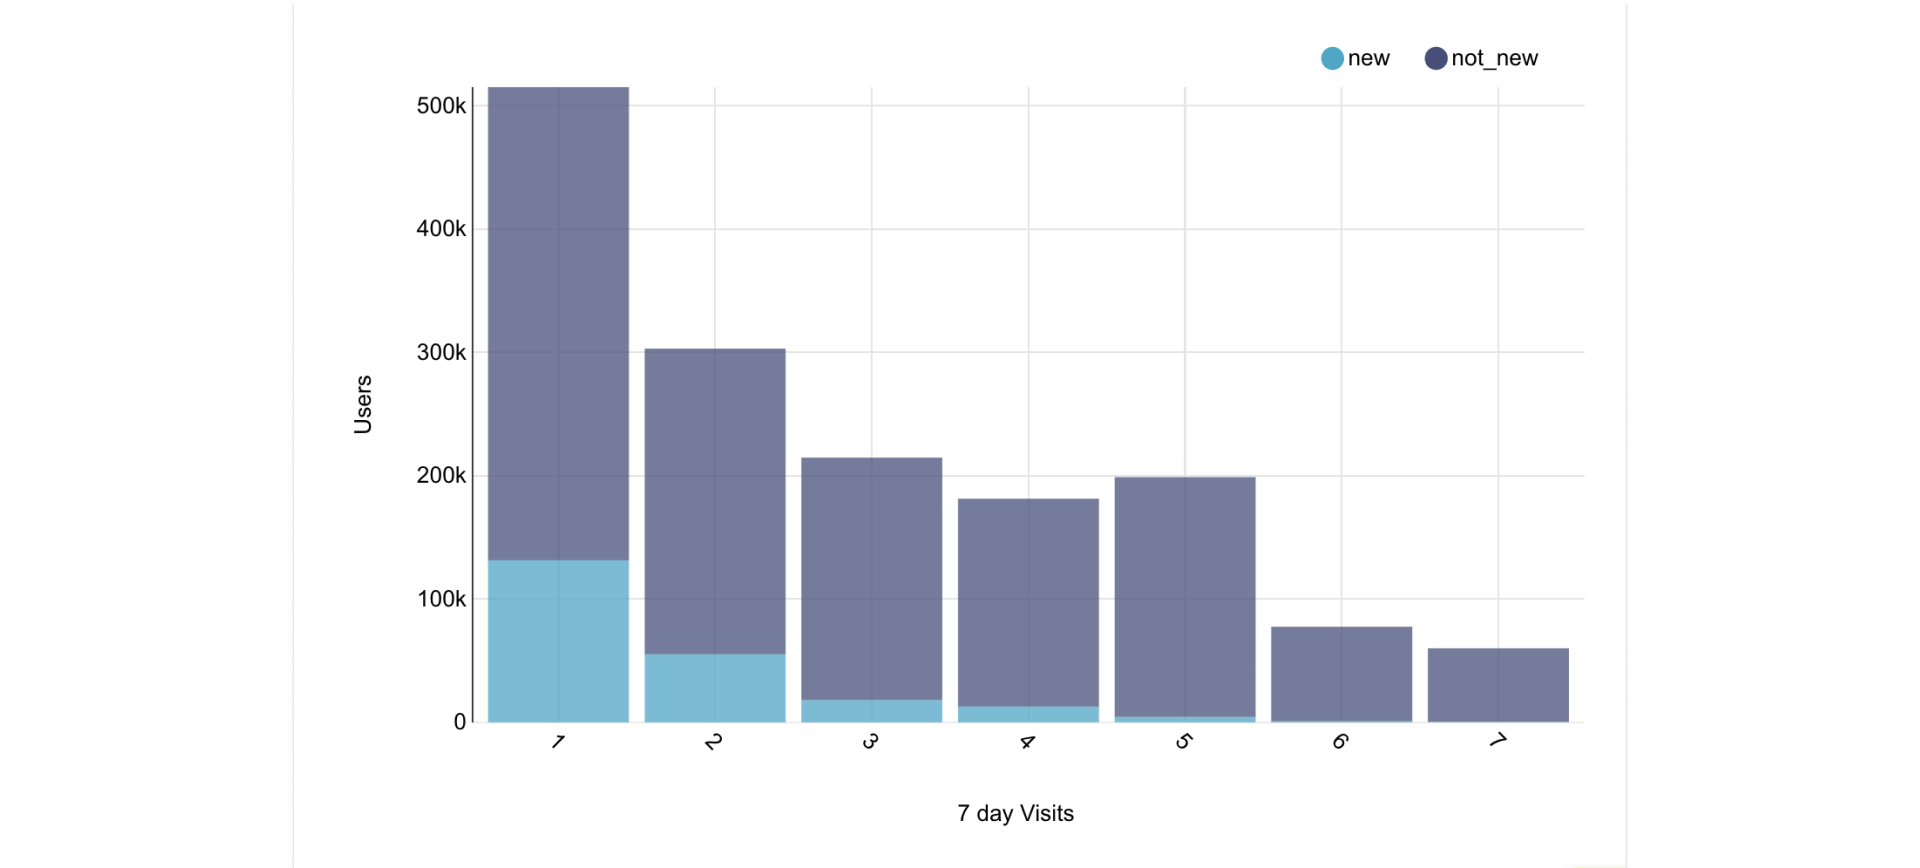
Figure 2. In dark blue, plotting l3plus7 / WAU which represents the percentage of our WAU users that have visited 3 days or more of over the relative previous 7 days. This analysis is very simple and natural given a snapshot user table including the visit_7d metric. Note that we also plot here other arbitrary metrics based on visits_28d thresholds and MAU.
Integrating More Complex Data Structures

When working with entity-centric datasets, each row represents a single entity instance, such as a user in a core.user table. This constraint allows for intuitive querying and clear guarantees, as COUNT(*) gives a count of users and each column represents an attribute associated with that user. Most of the information important for qualifying a user should be stored in this dataset, such as registration and activation data, feature usage, and usage patterns. Properly enriched data can provide a 360 view of the user without needing to search through multiple datasets.
However, some important user information may not be well represented in a single column. Luckily modern databases support complex data structures, such as arrays, maps, structs, and arbitrary JSON blobs, which opens a world of options. These databases can process these types, including extracting individual values, exploding arrays into multiple rows, pivoting structures while cross-joining, and using the map and reduce-type functions.
Storing blobs in tables may be frowned upon by some, but it can make sense in cases where a rich table is needed for a core entity. For example, storing an array of the 100 most recent visited dates, an array of product SKUs the user has bought, or a rapidly evolving map of user attributes can be useful to store along with core attributes and metrics.
While this may not be intuitive for those from traditional backgrounds, such as data warehouse architects, DBAs, data analysts, and business intelligence engineers, it may make sense for software engineers and modern data engineers. Retrieving information from a blob and using dot notation, functions like JSON_EXTRACT , and CROSS JOIN-ing can feel natural to many practitioners.
Standardized data structures with predictable naming, such as tbm_visit using the prefix tbm_ for “time-bound metrics”, can provide reusable and guaranteed patterns and conventions. For example, tbm_visit could be a struct of integers with predictable names like tbm_visit.1d, tbm_visit.7d, and tbm_visit.28d, instead of creating three separate columns.
Data sketches can also be a powerful tool, providing answers while mitigating storage and compute costs where probabilistic answers are sufficient.
While compressed bitmaps, bloom filters, and other advanced techniques and data structure are a consideration, the KISS principle may work best in most cases. Regardless, it's good to know that there are options available.
Metrics Breakdowns

In addition to entity-centric datasets and complex data structures, there's also the concept of metrics breakdowns, or metric "dimensionality". For example, for the core.user entity, we may want to generate a metric for each type of "key action", such as logins, visits, downloads, profile changes, and profile views, and manage this in a dynamic way.
One approach to this is to compute and materialize individual columns for each type of action count. Alternatively, we could generate a map data structure that's more dynamic and can be evolved over time without needing to modify the database schema (e.g., core.user.action_count_map, with breakdowns like action_count_map.tbm_visits.7d and action_count_map.profile_change.28d).
Pushing this approach to its unreasonable limit, one could, but probably shouldn’t bring atomic fact table rows related to the entity int the form of a “column” containing all sales facts as an array of maps, and another column for another fact table. But clearly at some point, it becomes impractical to fit the entire data warehouse inside the entity model. Summarizing makes much more sense in the context of the entity. While metrics breakdowns can be helpful, it's important to exercise restraint and limit the number of metrics + dimension breakdown combinations to what's most important and characteristic of the entity at hand. When the use cases call for more intricate drilling into the entity-related metric, it calls for going back to the original dataset where that information is available.
Data Transformation (ELT/ETL) Techniques
This section provides some high-level guidelines on how to implement ECM.
Preventing Circular Dependencies

As we bring facts into dimensions, there is a challenge around avoiding circular dependencies in your Directed Acyclic Graphs (DAGs). One way to actively prevent this is by introducing a new “cross enrichment” layer in the “backroom” (the layer intended for staging, cleaning, and conforming the data - not intended for consumption) of the data warehouse. On one side of that layer we want to be created, prepared, and clean datasets, and on the other, mix, match and enrich the derived dataset. On the downstream side of this layer is where we bring facts into dimensions, denormalize dimensional attributes in facts, and more generally summarize relevant information that typically would live beyond joins, in related datasets.
About Materialization
It's important to serve entity-centric datasets, but how those are computed and materialized isn't as important as the fact that we want to expose rich and wide datasets anchored on entities. Behind the scenes, there can be a more complex framework that knows how to time-pivot and merge things. In future posts, we can explore building many time-bound metrics at scale in snapshotted dimension tables.
Vertical Partitioning
Wide tables may not perform as well as thinner tables with fewer columns, and users may suffer from column overload, where so many columns are exposed in a dataset that it confuses the user. To address this, you can create extended tables that are richer and bolt extra columns on top of the more frequently used tables. For example, core.user may have a sibling core.user_ext that offers many more columns. You can push this idea further and have different sets of columns exposed in different datasets for a given entity, such as core.user_ext_demographics and core.user_ext_engagement_metrics, effectively namespace the columns.
From a performance standpoint, some databases offer tools to make joining these potentially large tables cheap. Clustering and ordering the data based on entity ID may allow for cheap local sorted joins, for instance. For most reasonably sized entity datasets, though, performance shouldn't be a significant concern, and optimizing here may be premature most of the time.
For logical vertical partitioning, a simple view exposing a subset of the columns on top of a wide table works well to address the "column overload" concern.
To Conclude...
Entity-centric modeling offers a powerful approach to modern data engineering and analytics by focusing on rich, wide tables anchored on core entities. By adopting ECM, we can create tables that provide a comprehensive view of entities such as users, products, or business units, simplifying analysis, and minimizing the need for complex joins.
ECM also brings the "feature mindset" prevalent in data science to the forefront, making it more natural to apply powerful techniques like segmentation, cohort analysis, and complex classification. This enables data practitioners to derive more meaningful insights from their data.
To successfully implement ECM, it's essential to address challenges like time management, integrating complex data structures, data transformation techniques, preventing circular dependencies, materialization, and vertical partitioning. By using time-bound metrics and dimensional snapshots, we can perform flexible time series analysis. Complex data structures like arrays, maps, and structs can be used to enrich our entities, providing a more granular view of the data.
By embracing ECM, we can empower data practitioners to perform more intuitive, feature-rich, and efficient analyses, leading to better insights and data-driven decisions. As the field of data engineering continues to evolve, adopting ECM will help organizations stay ahead of the curve and make the most of their valuable data assets.
