


Slack Dashboard (Part 2): Loading Into Postgres & Creating Charts


In part 1 of this blog series, we learned:
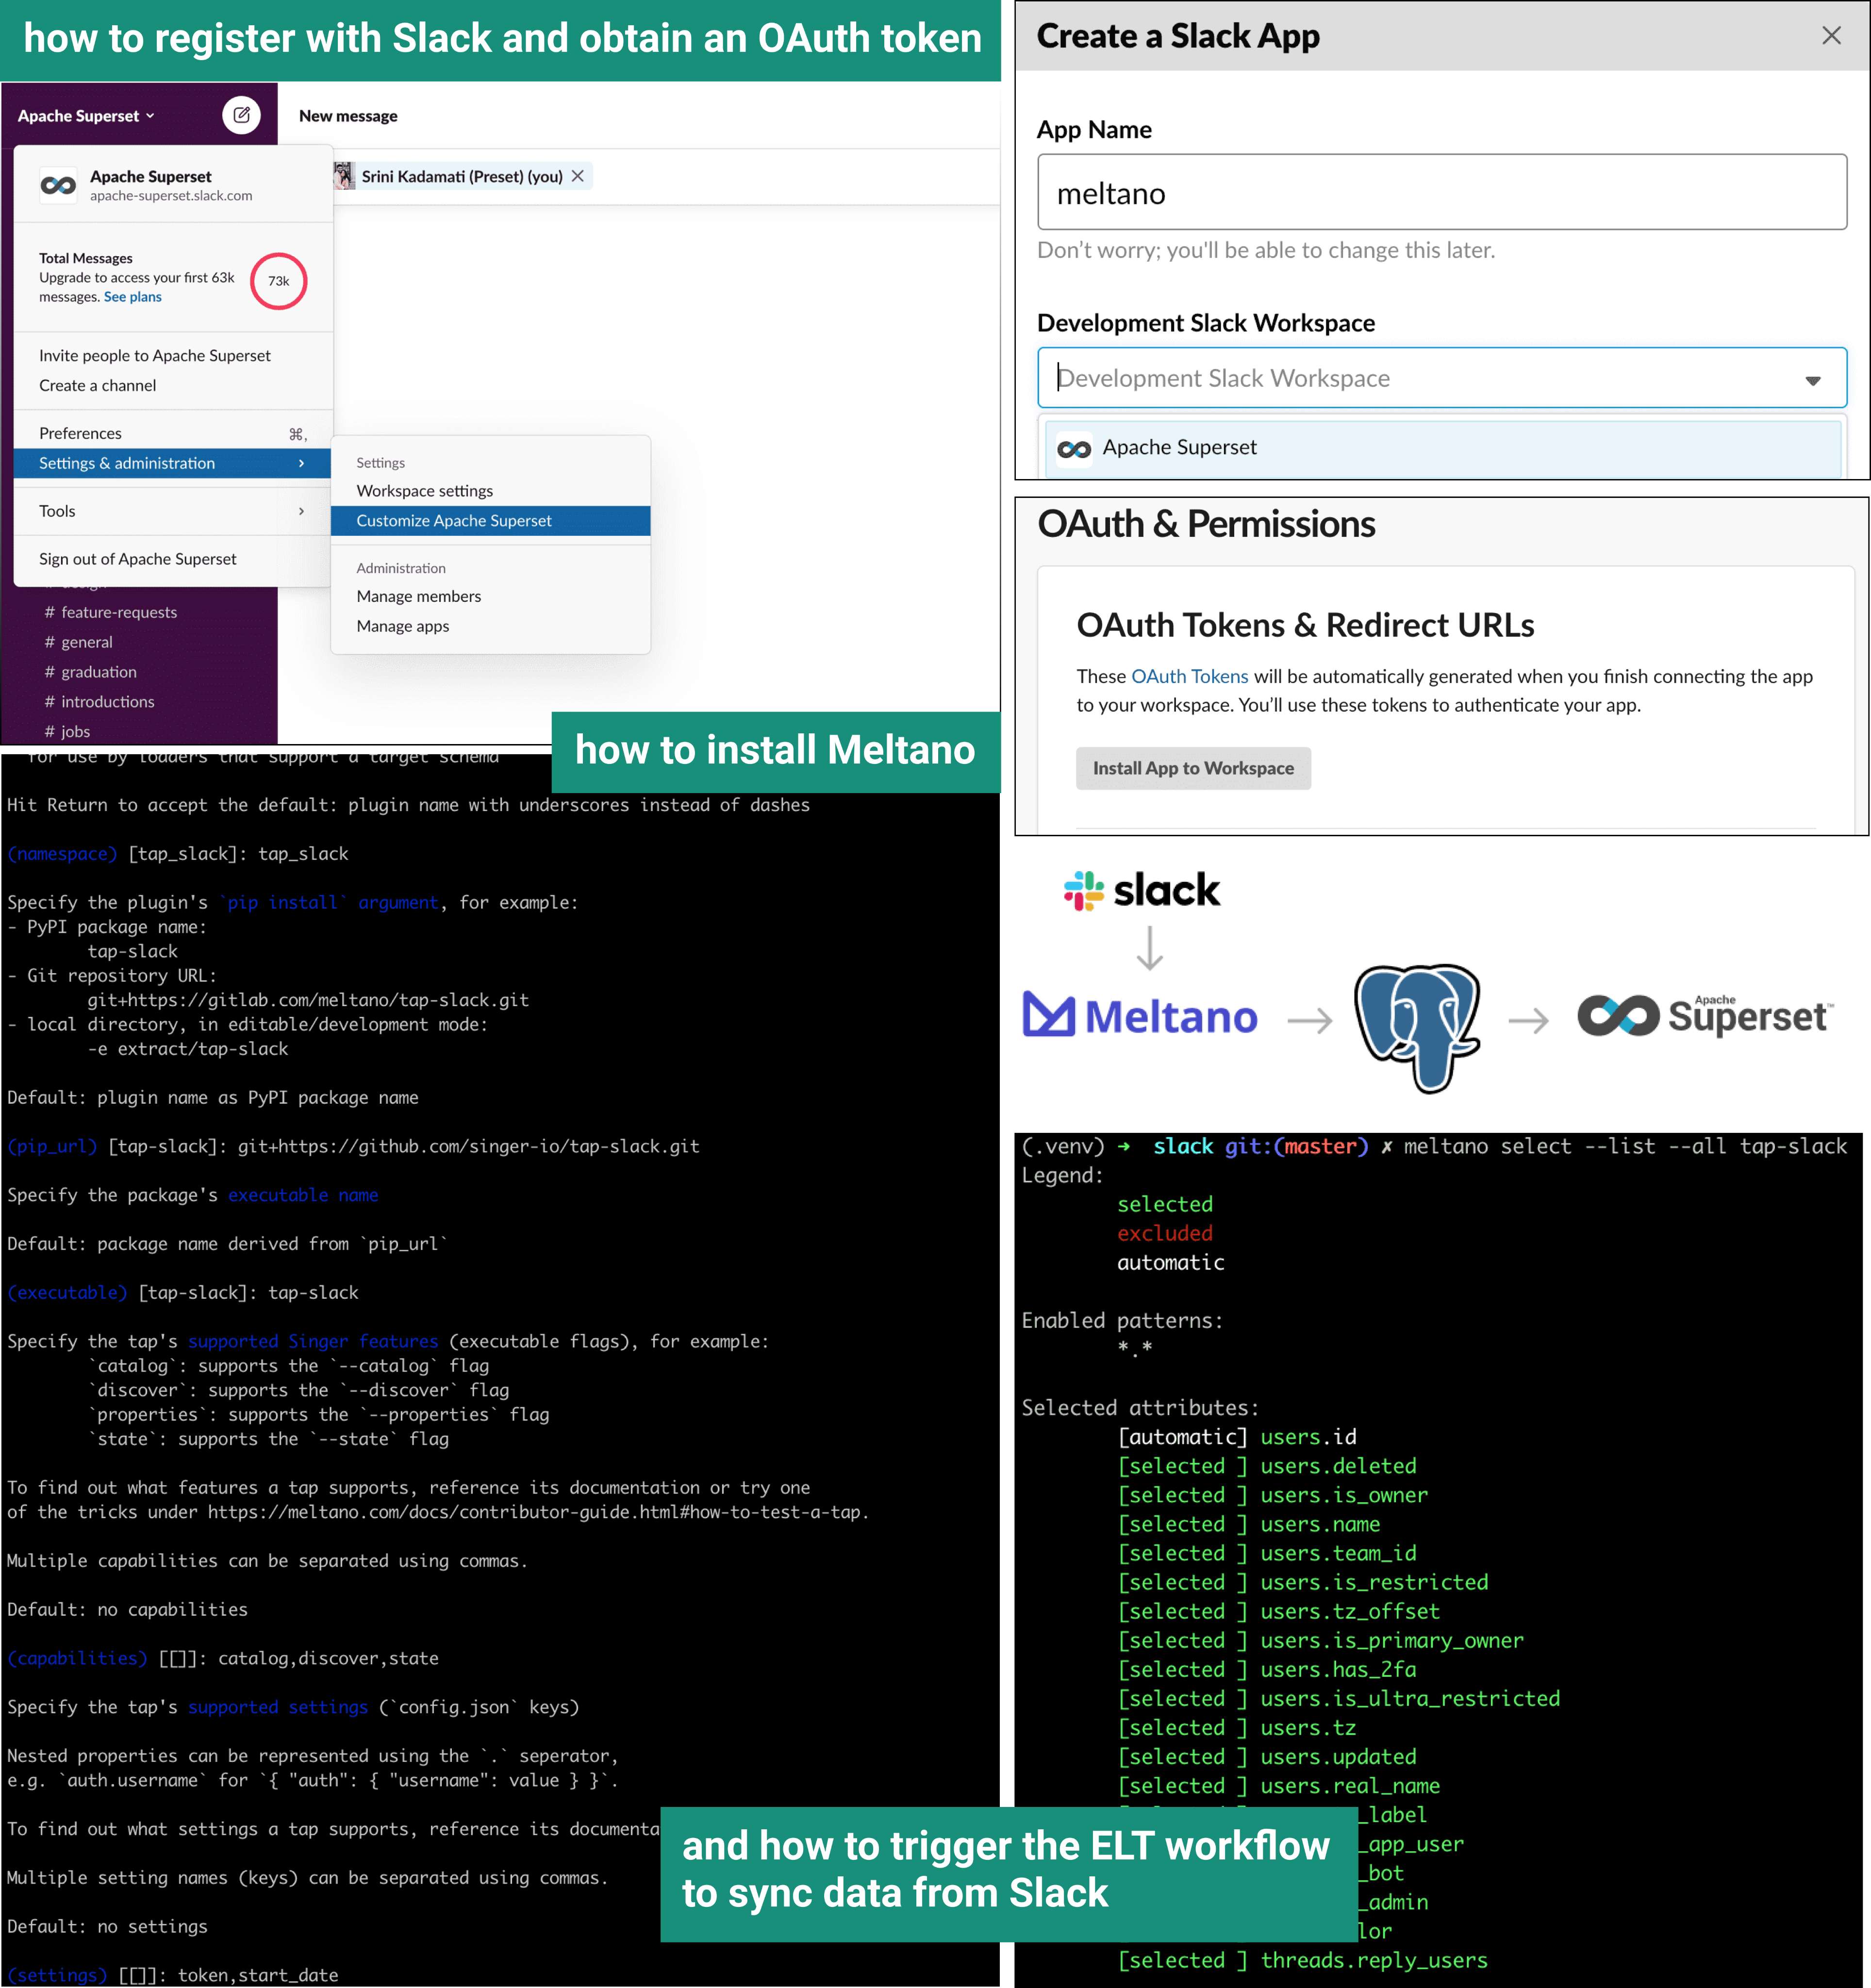
In this post, we'll walk through:
- how to load data from Meltano into a database
- create the following charts that require no ELT
Loading Slack Data Into PostgreSQL
Superset can create charts and dashboards using data from pretty much any SQL-speaking datastore.
- Let's start by installing the PostgreSQL loader, named
target-postgres, to our Meltano project.
meltano add loader target-postgres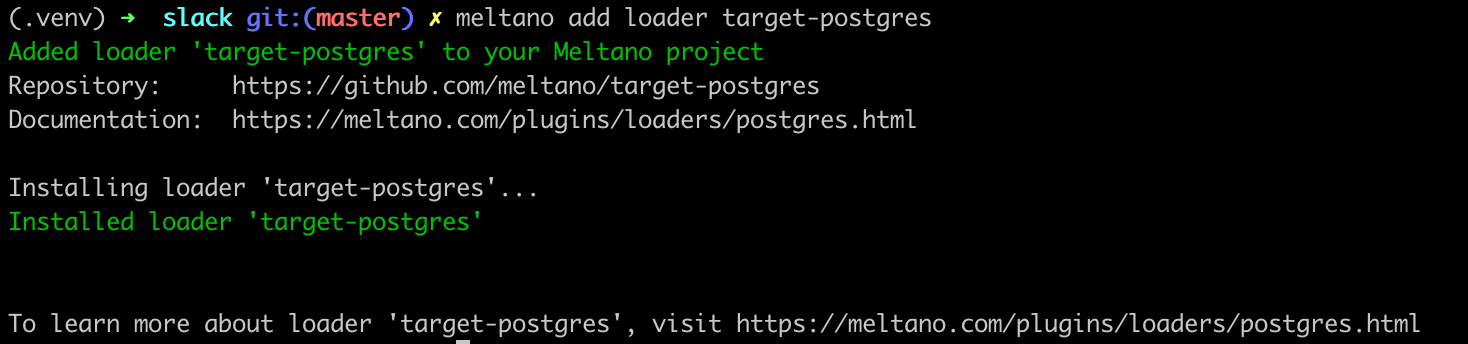
-
If you don't have an existing PostgreSQL database for loading data, follow this tutorial on the Meltano documentation to get an instance setup locally. Note that if you're using Superset via docker-compose, a PostgreSQL database comes packaged as one of the services.
-
Once you have a PostgreSQL database setup, we need to configure the connection details in our Meltano project. The recommended way is to use a
.envfile that contains the necessary environment variables for Meltano to access and use for connecting.Start by creating a
.envfile in the same folder and then use vim, emacs, or your favorite text editor to add the following variables:export PG_ADDRESS="" export PG_USERNAME="" export PG_PORT="" export PG_PASSWORD="" export PG_DATABASE="" export PG_SCHEMA=""If you want Meltano to load data in the PostgreSQL instance that's included in the Superset docker-compose setup, use the following settings:
export PG_ADDRESS="localhost" export PG_USERNAME="superset" export PG_PORT="5432" export PG_PASSWORD="suprerset" export PG_DATABASE="postgres" export PG_SCHEMA="tap_slack" -
To test our pipeline from
tap-slacktotarget-postgres, run the following command:meltano elt tap-slack target-postgres --job_id=daily_updateYou should see a flurry of command line output, ending with the following if everything worked as expected:
target-postgres | INFO UPDATE 97
target-postgres | INFO INSERT 0 0
meltano         | Incremental state has been updated at 2020-09-29     17:35:23.985219.
meltano         | Extract & load complete!
meltano         | Transformation skipped.
Registering a Postgres Database in Superset
Now that our raw data is neatly tucked away in our PostgreSQL database, it's time to bake the metaphorical raw data and create some delightful charts that we can present in a dashboard.
- First, let's register the PostgreSQL we loaded Slack data to with Superset. Fire up Superset, navigate to Data > Databases, then click the + button in the top right corner.
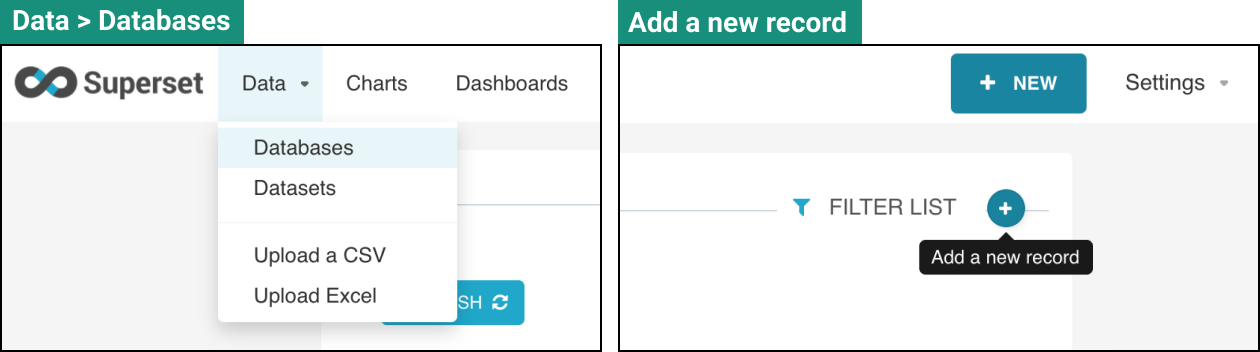
Add the database connection credentials along with the following settings.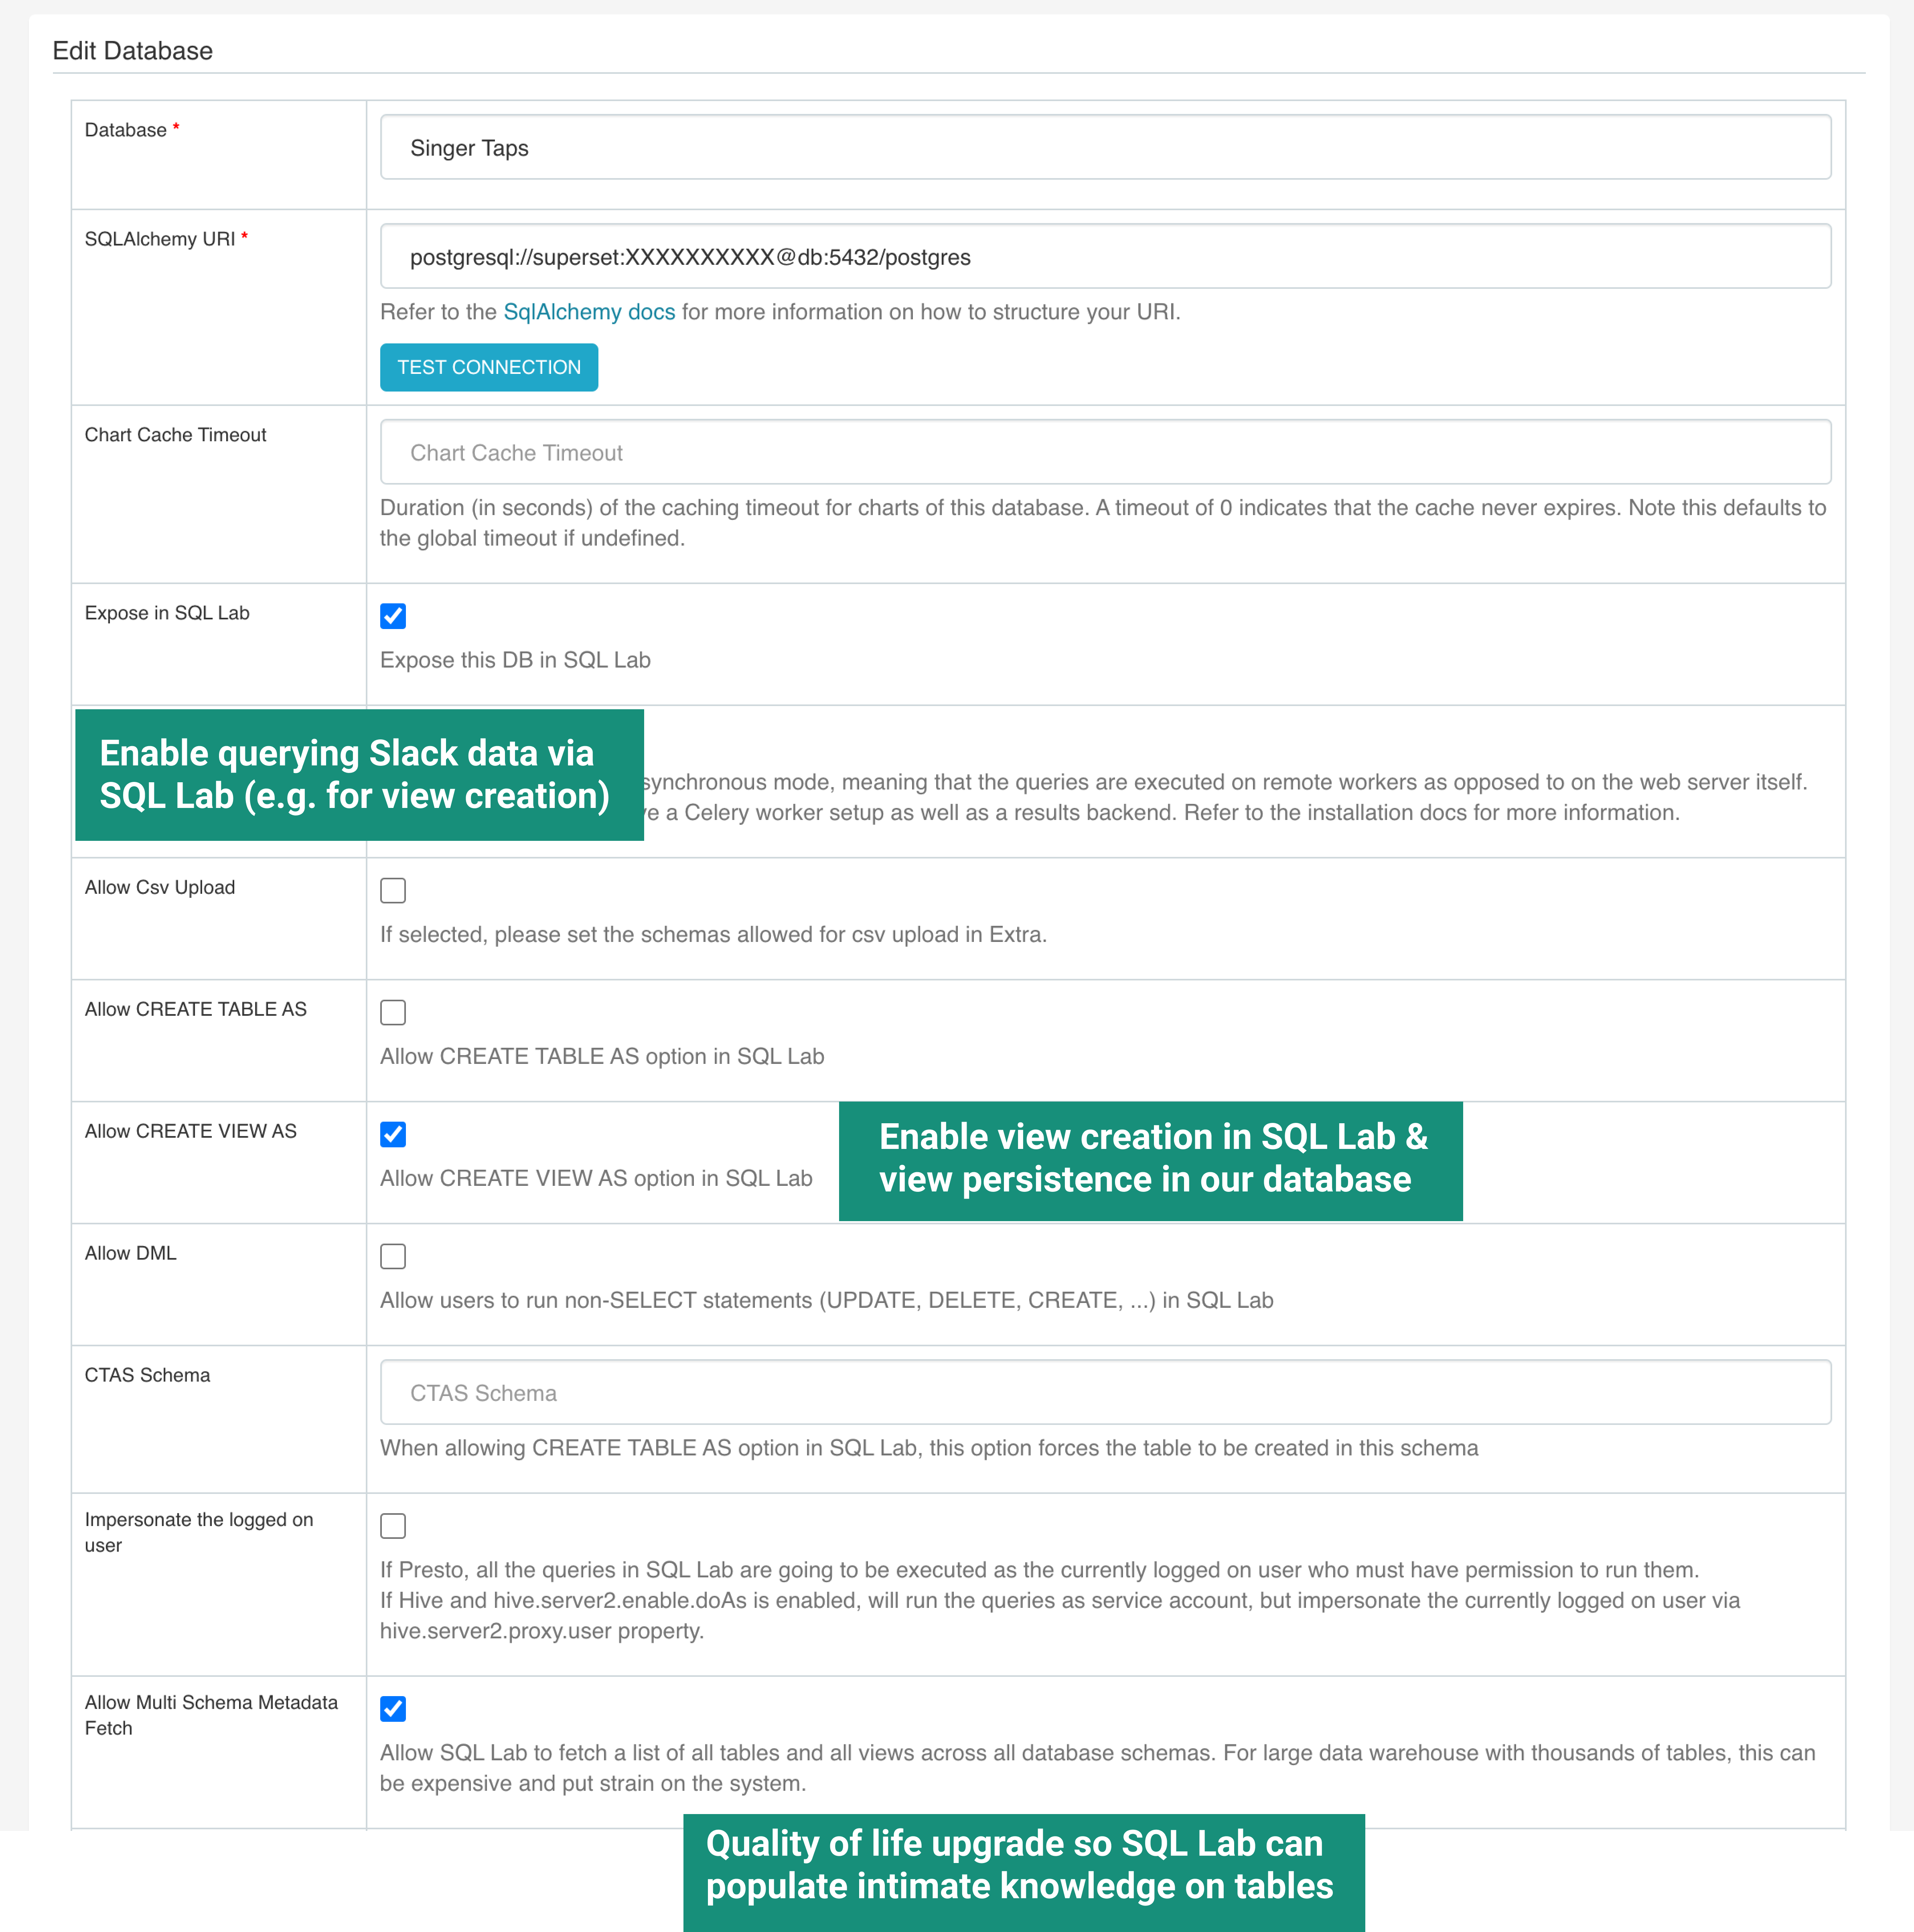
You can read more about connection strings for PostgreSQL [in our docs](https://docs.preset.io/docs/en/postgres-connection).- Now that we've added the PostgreSQL database, we can see the tables containing the data Meltano synced from the Slack API listed in the Data > Datasets page.
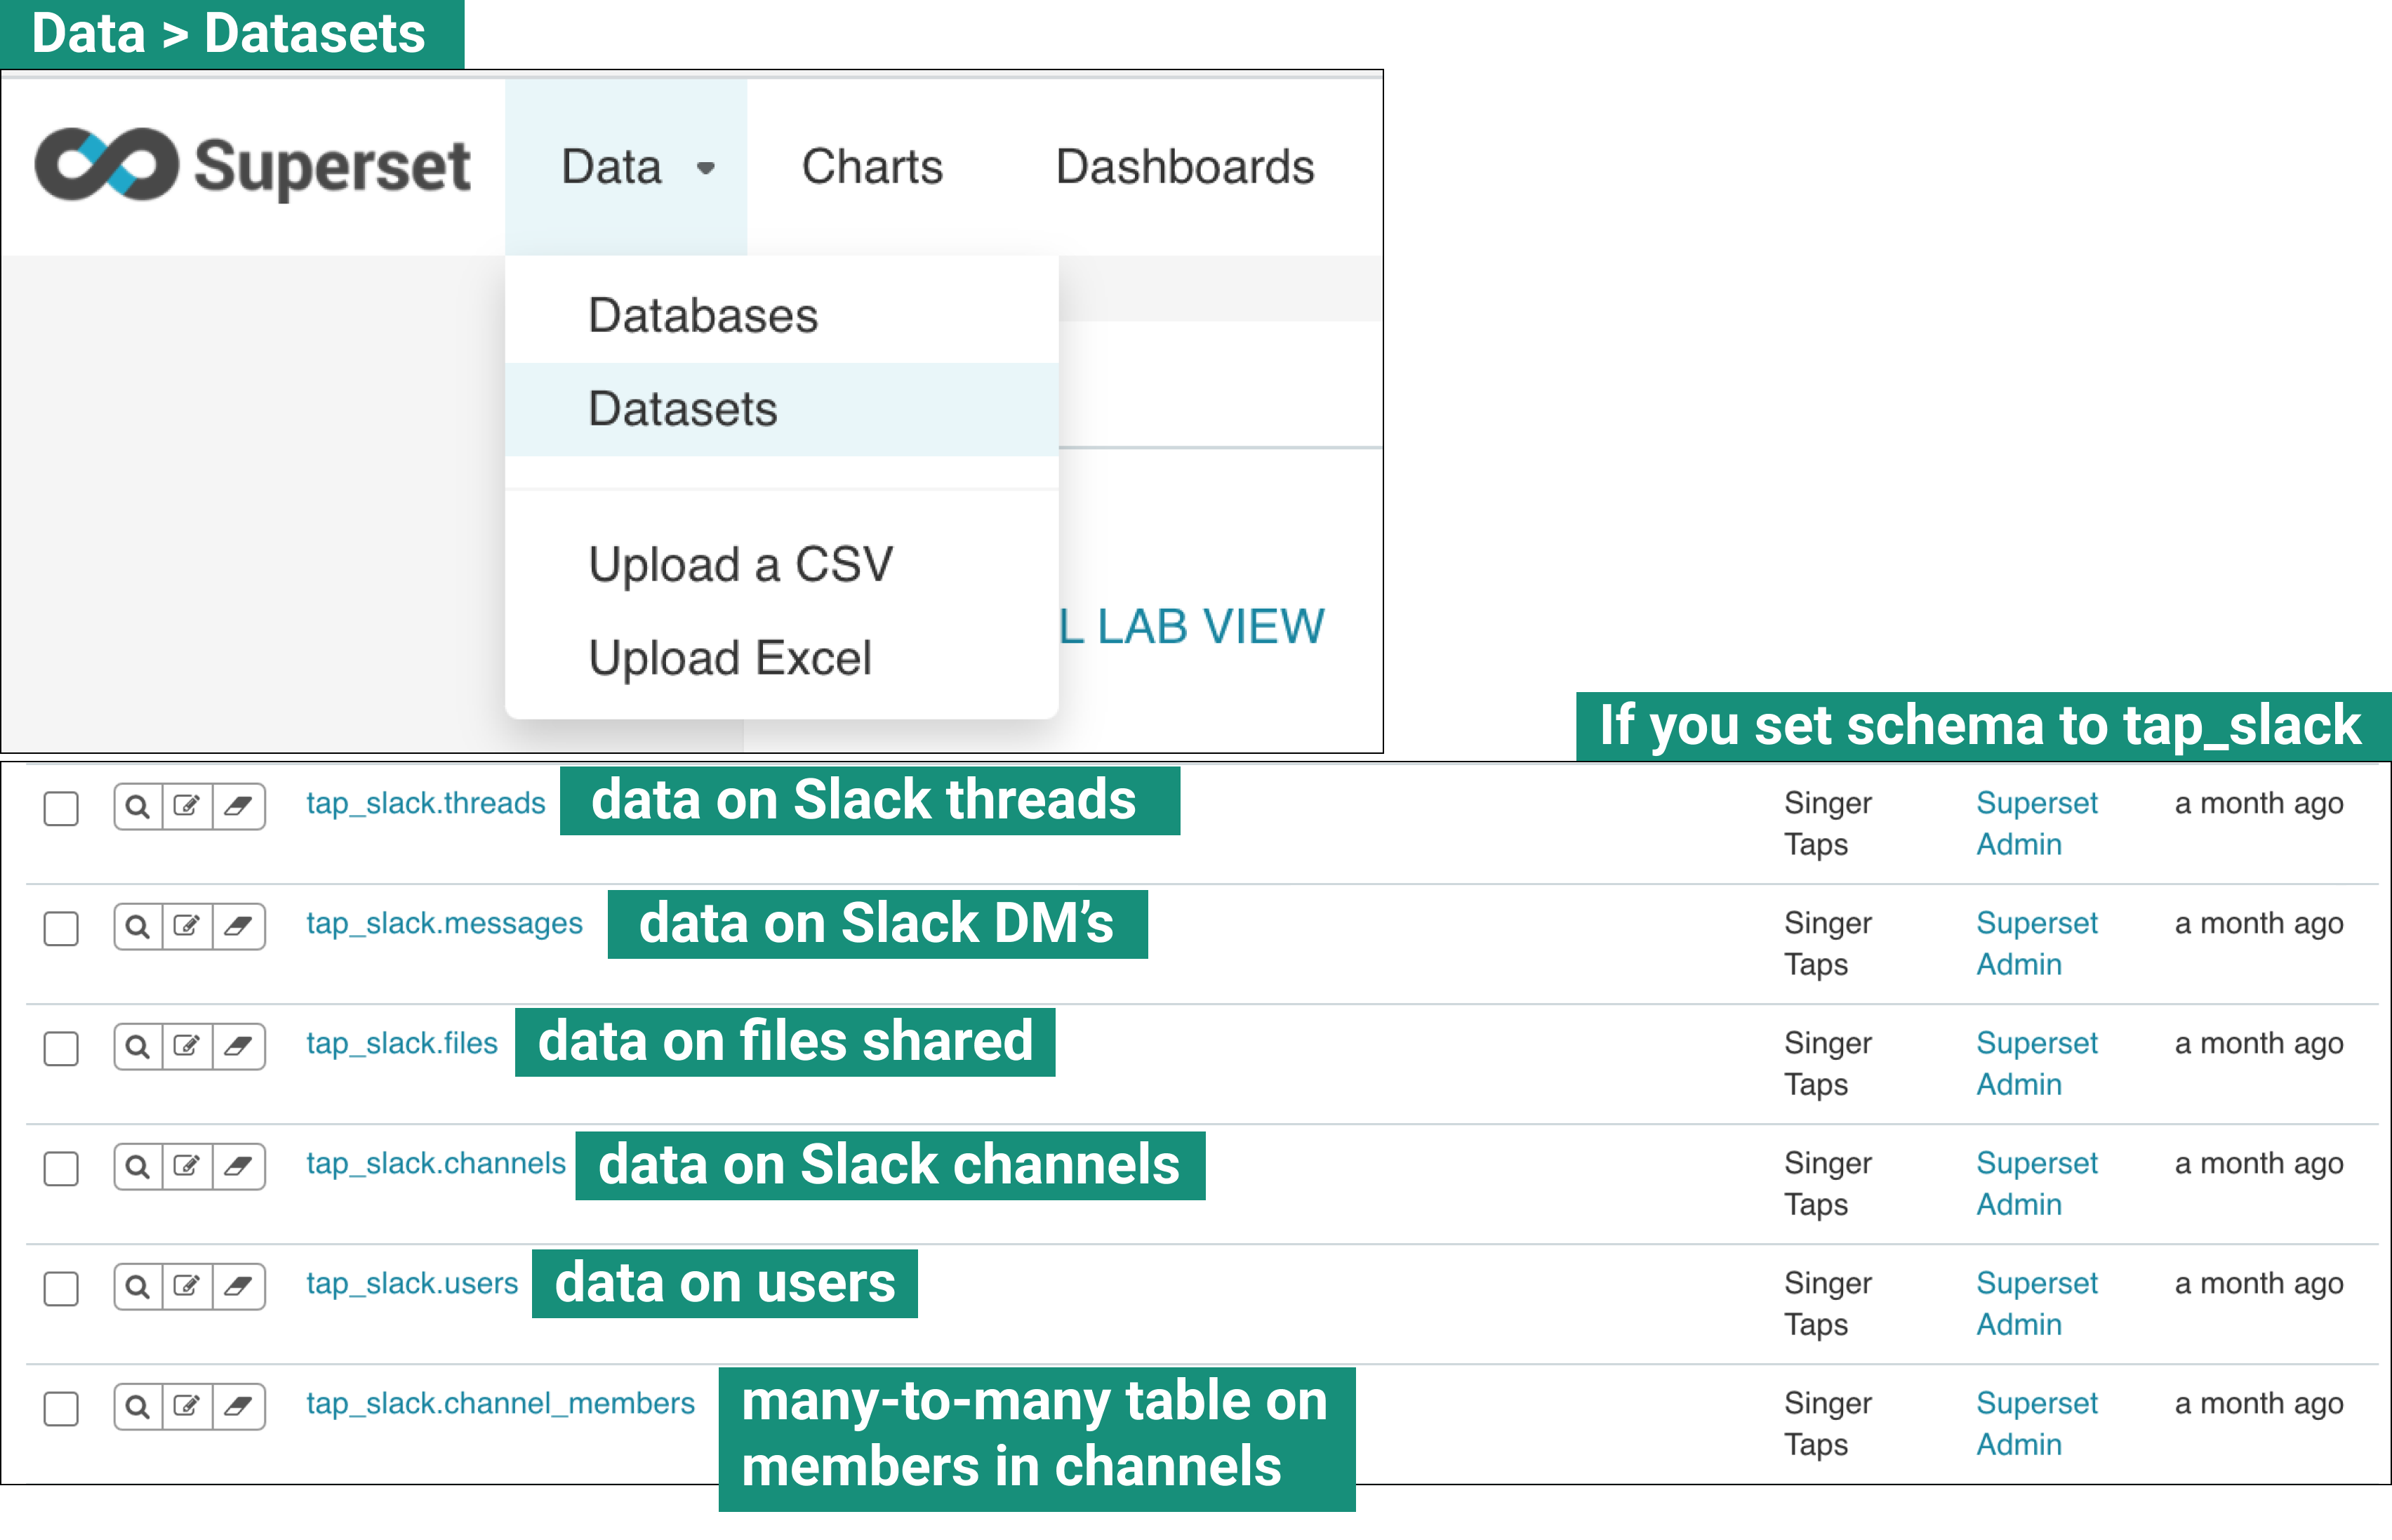
- We encourage you to explore the data in SQL Lab to get familiar with it. SQL Lab is an excellent way to quickly learn the schema of the different tables, preview thousands of rows of data to get some ideas for charts, and start spotting any data cleaning tasks that are needed to massage the data into a more useful format.
Creating Basic Charts in Superset
Now that we have our data available to Superset, we're ready to start creating visualizations. We'll start with some simple charts and progressively scale up to more complex ones. If you need extra help, we recommend using our docs alongside this blog post.
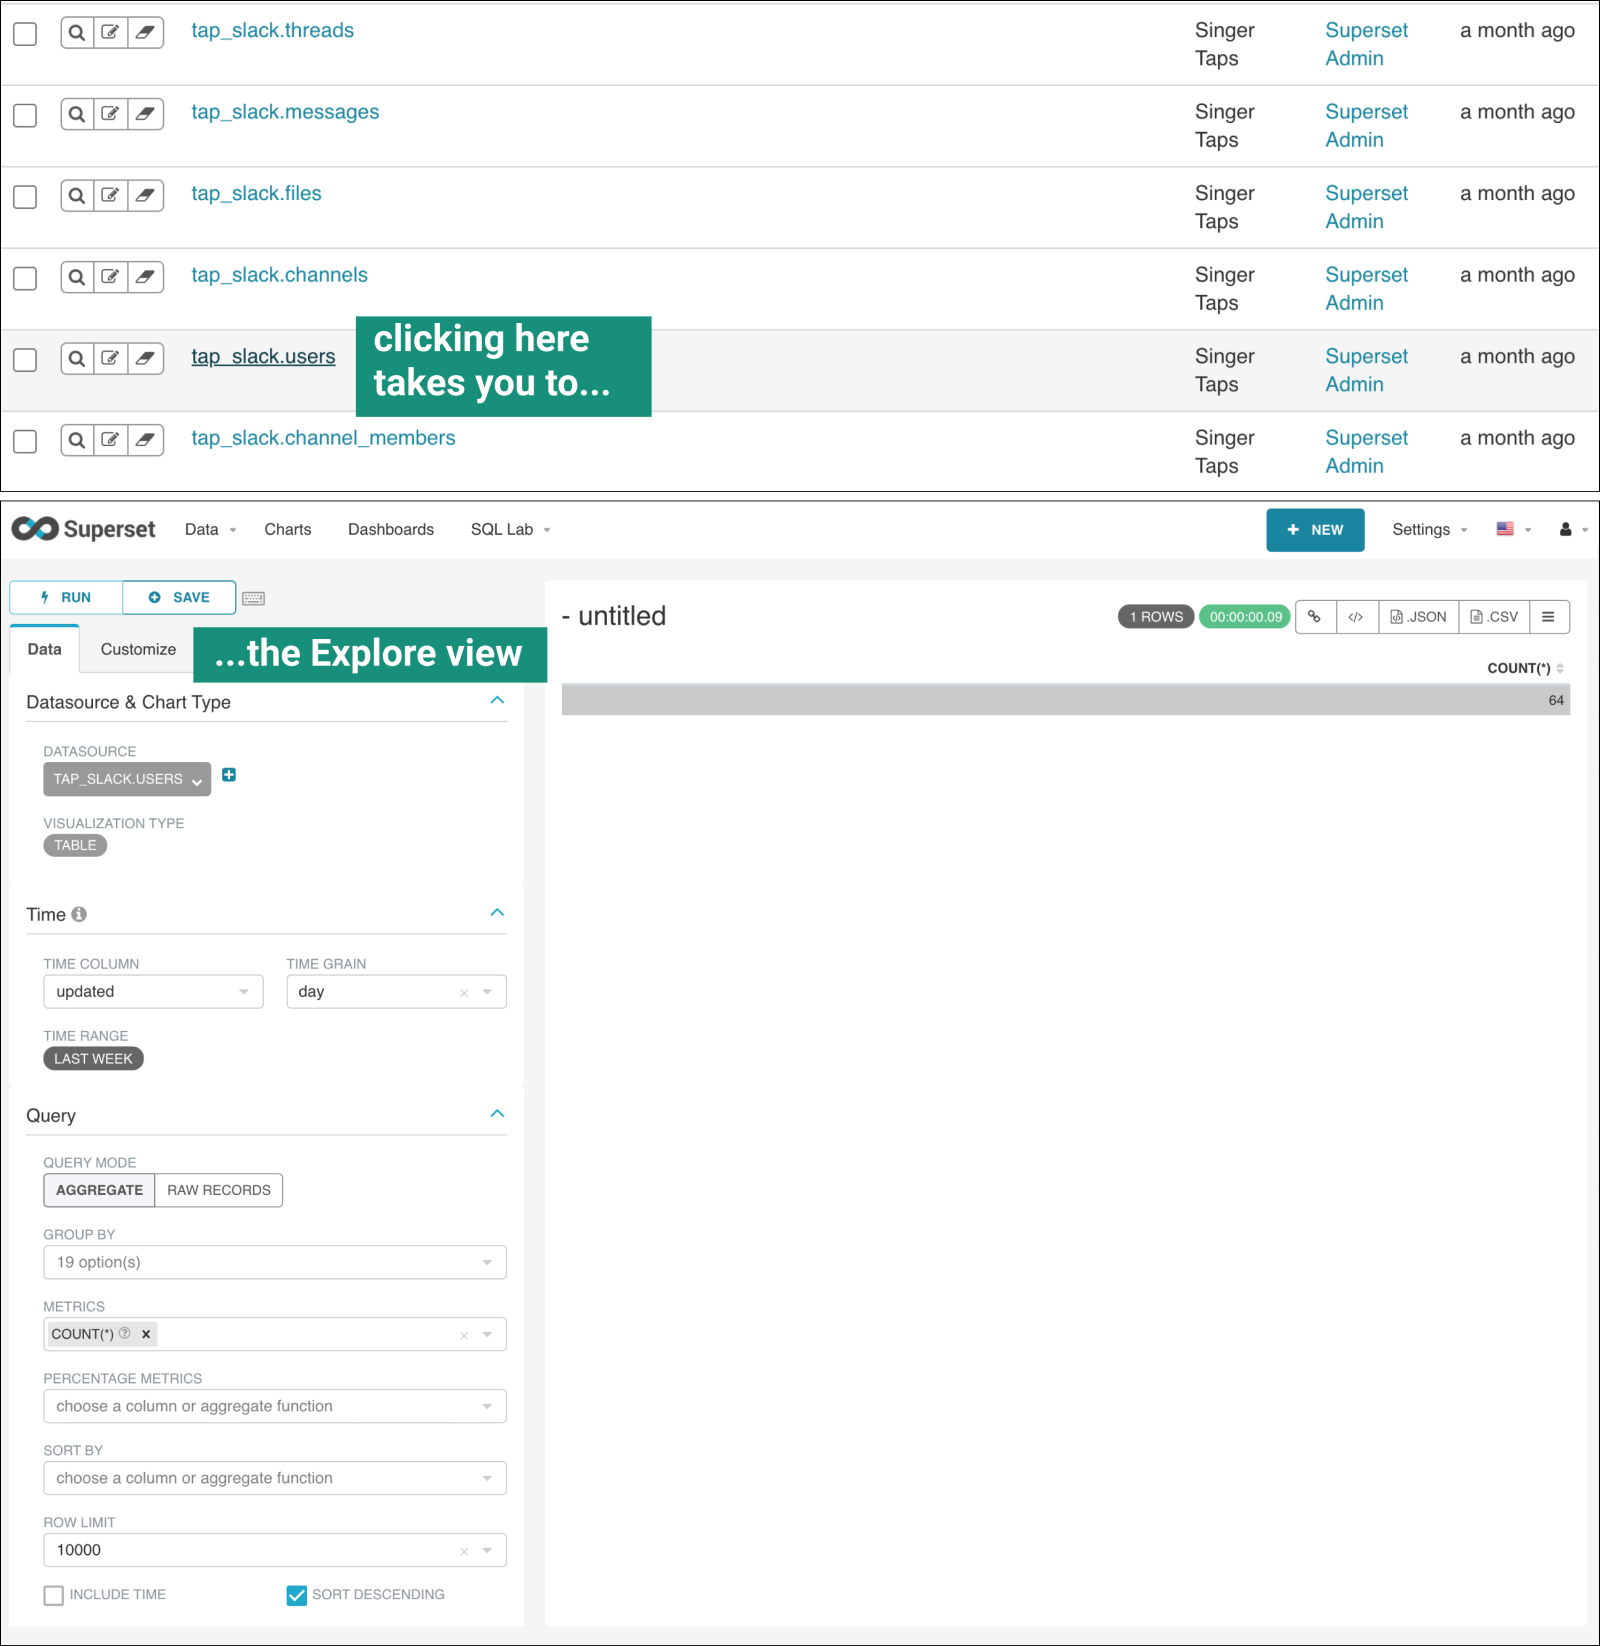
- Start by opening the Explore view in Superset. From the Data > Datasets tab, click tap_slack.users (or your equivalently named table).
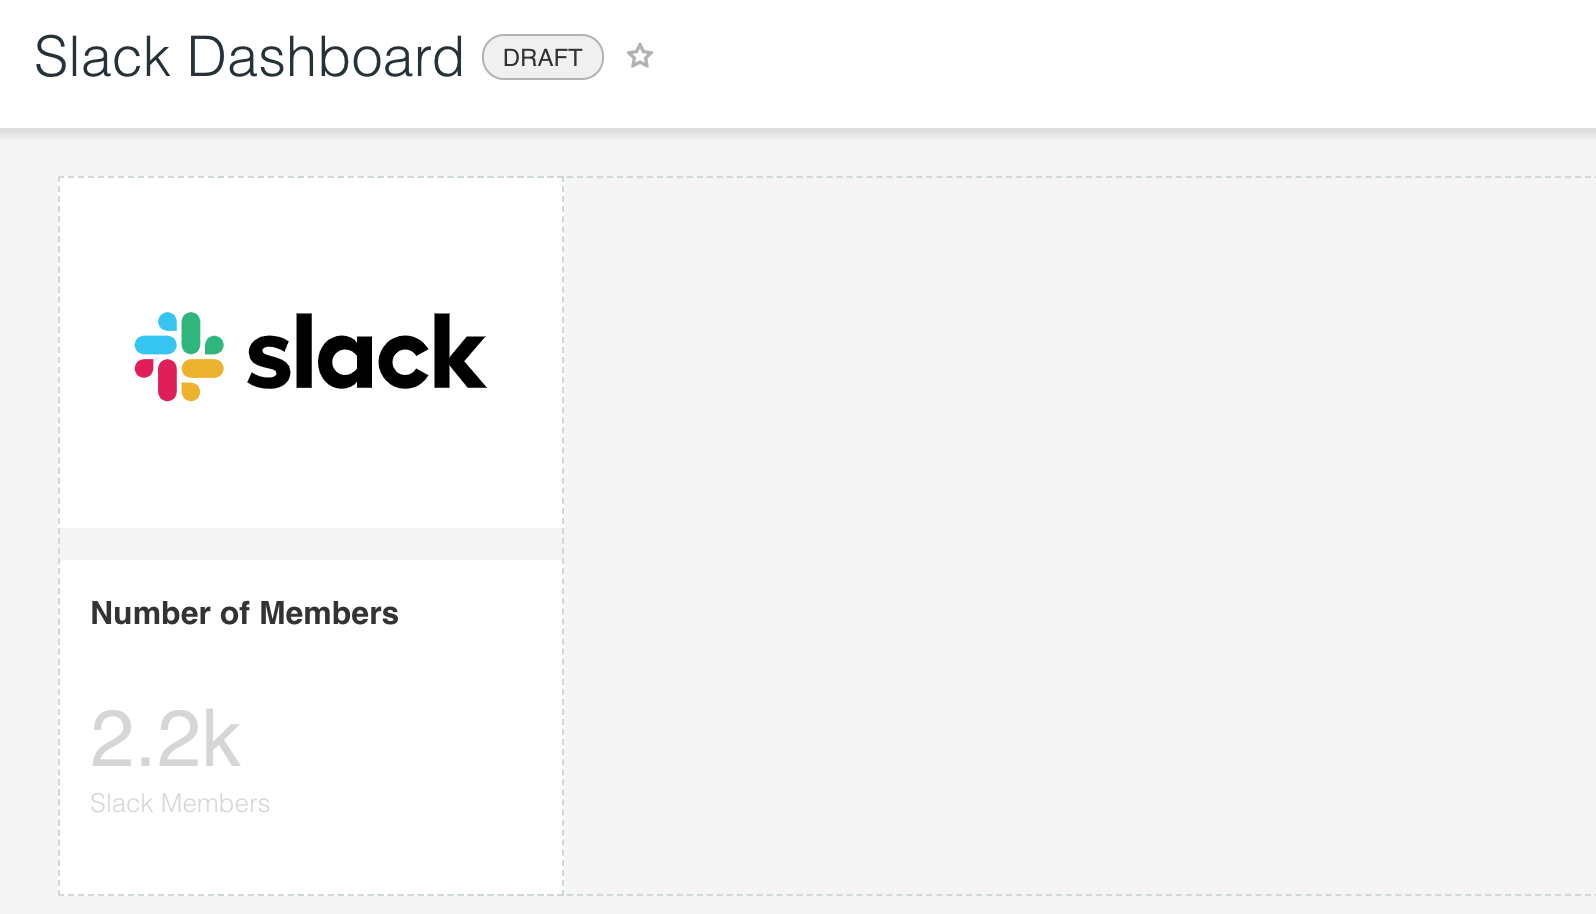
- Tracking the number of users in the community is a good place to start. Create a Big Number chart that showcases the number of users in the community. Change the Visualization Type to Big Number, remove the Time Range filter, and add a Subheader.
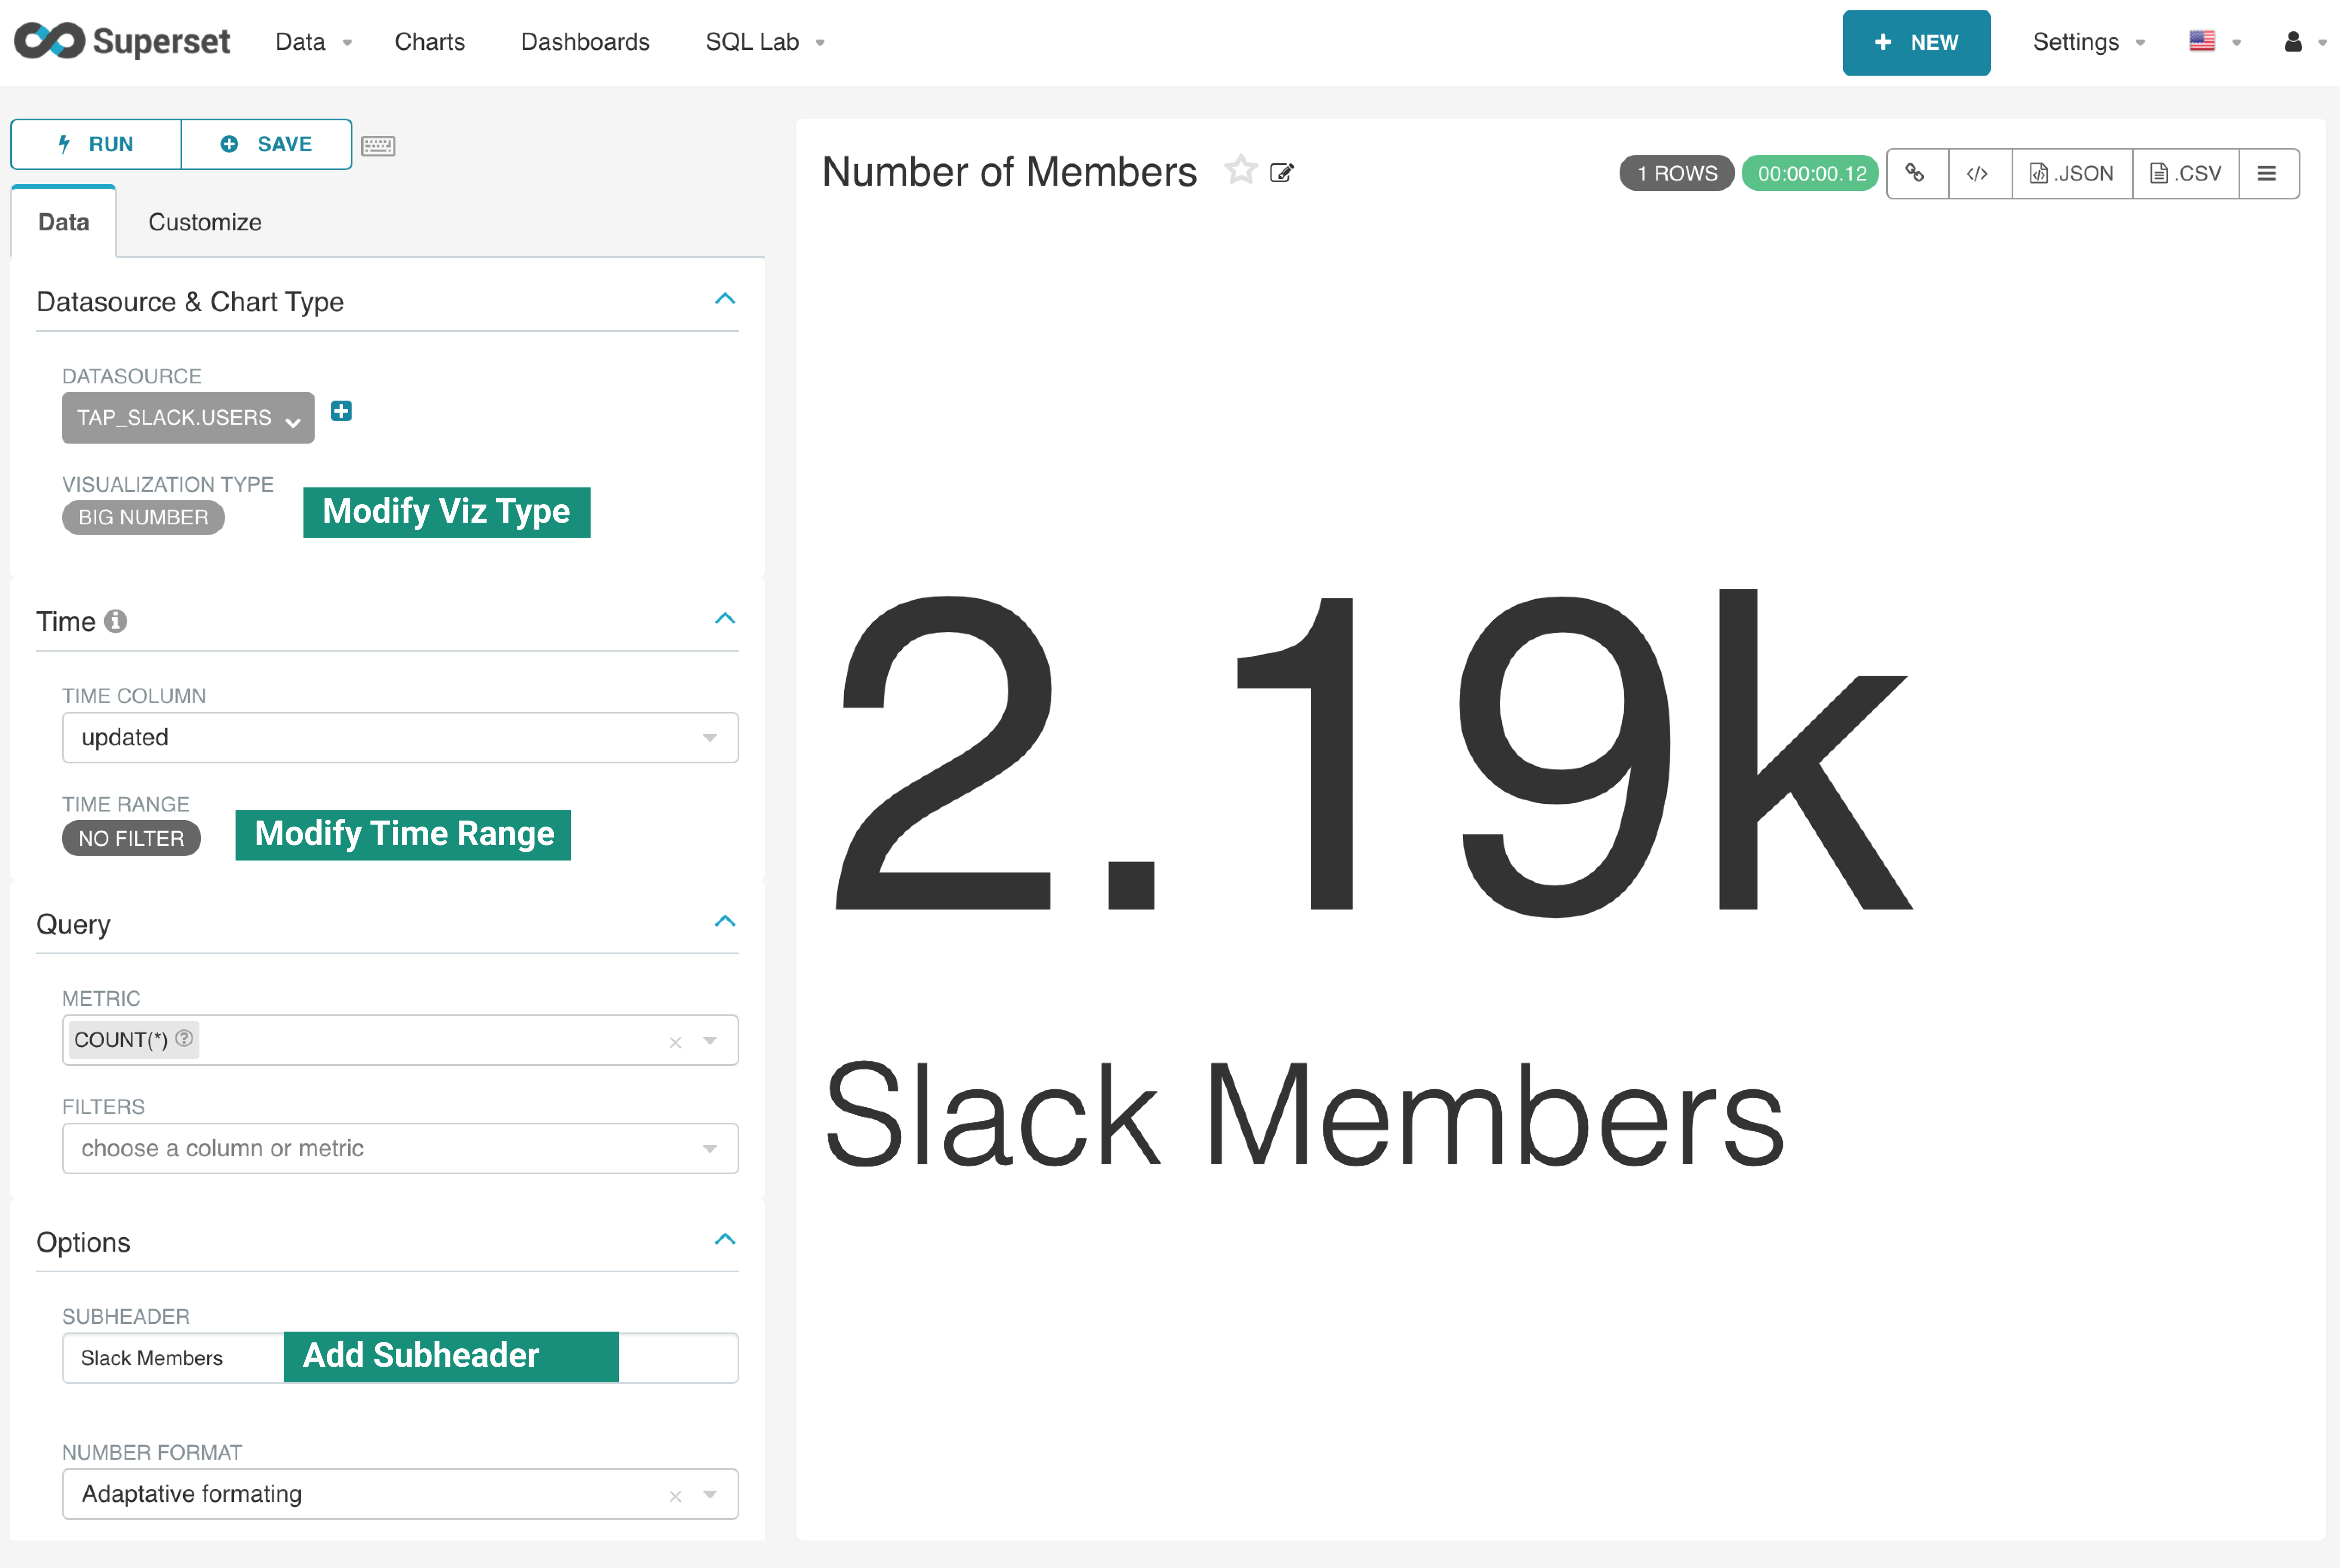
Simple but elegant! Save this chart by selecting **+ Save**, giving the chart a **Chart Name**, and creating a new dashboard named **Slack Dashboard**.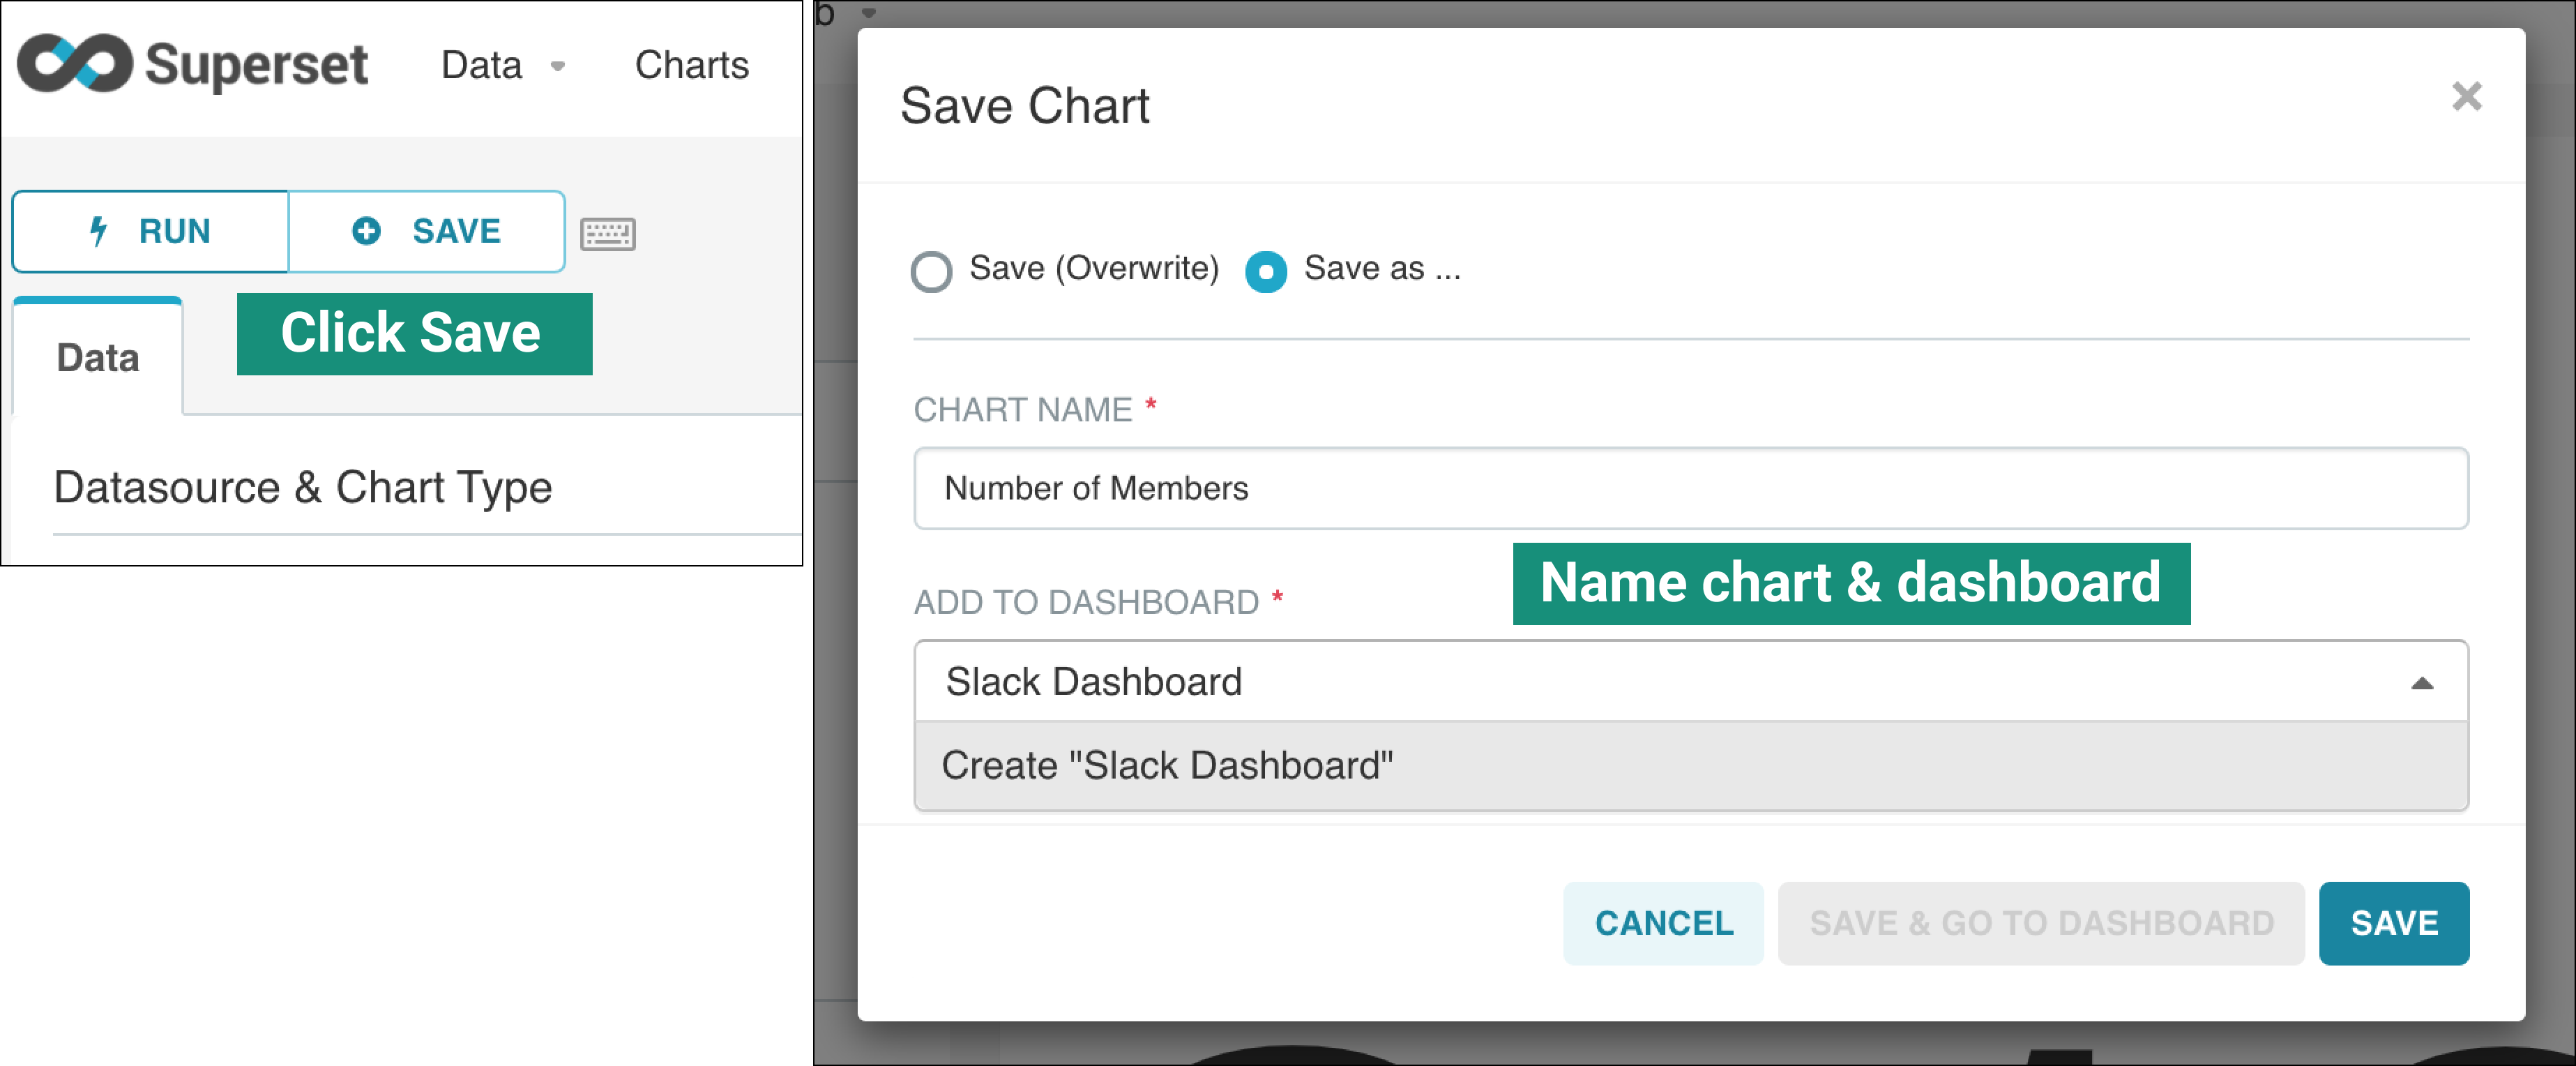
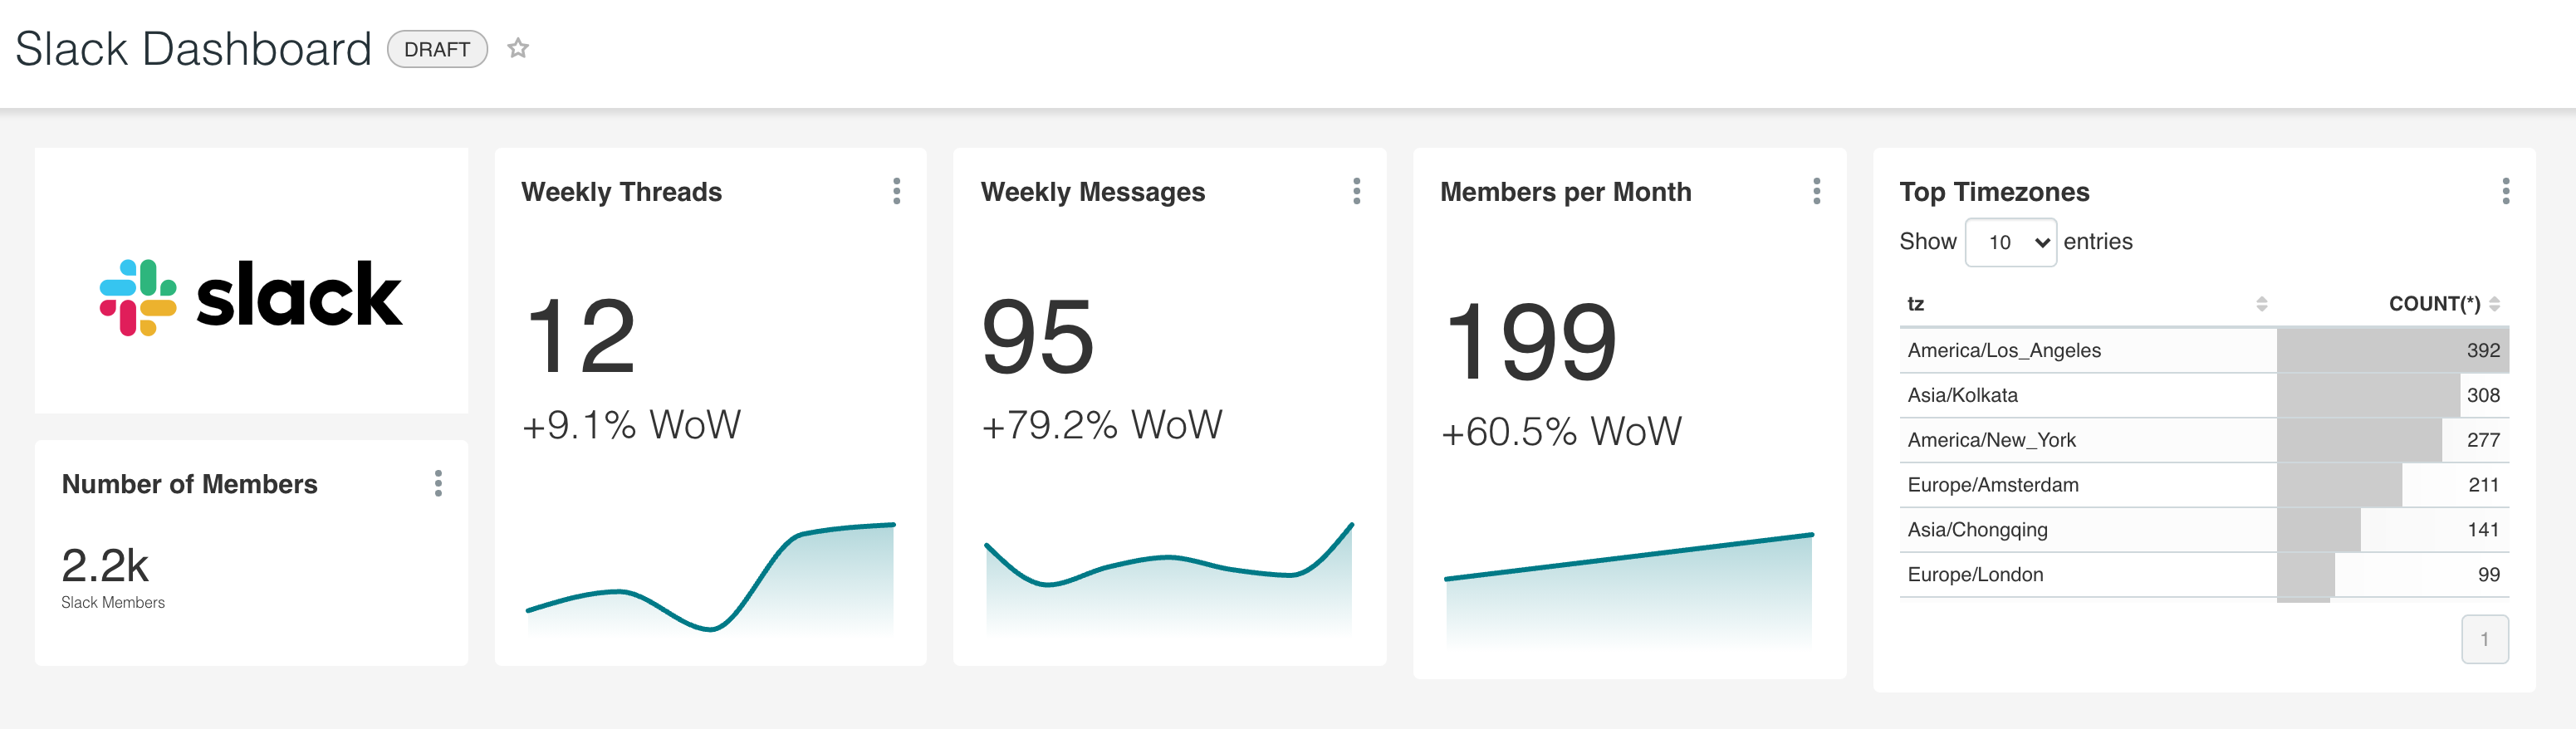
- Next, let's add Big Number with Trendline charts for Weekly Threads, Weekly Messages, and Members per Month.
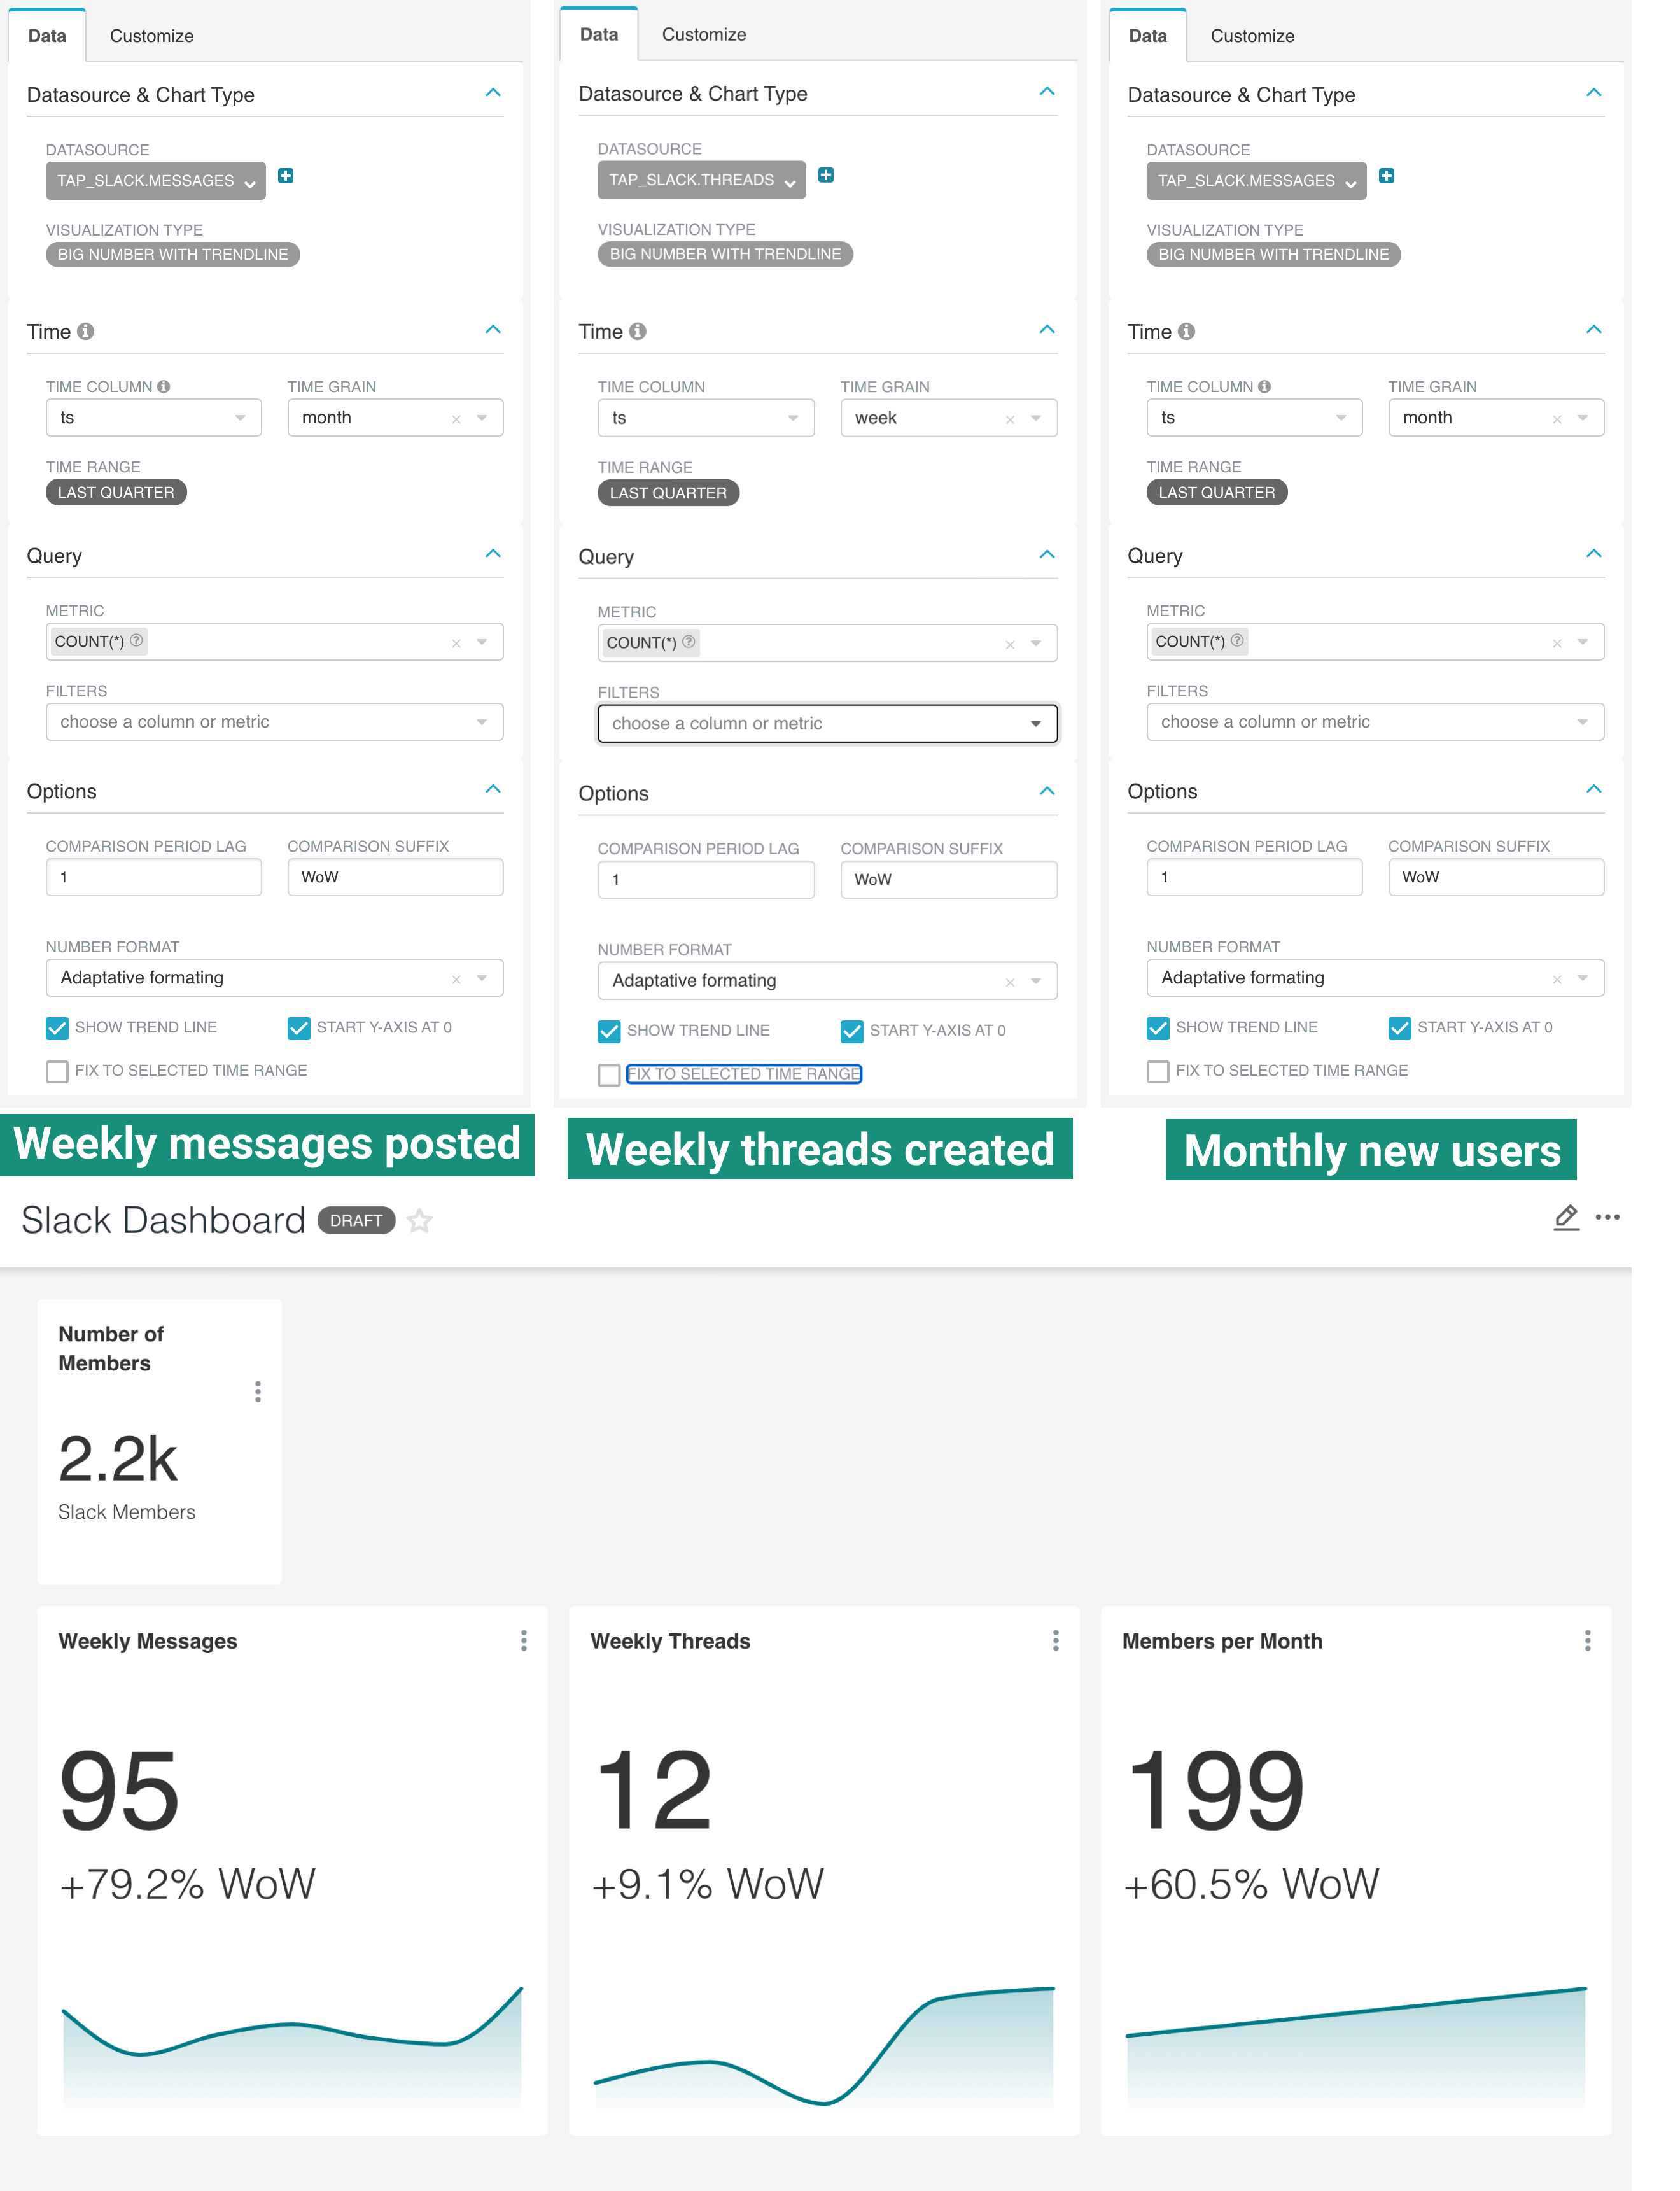
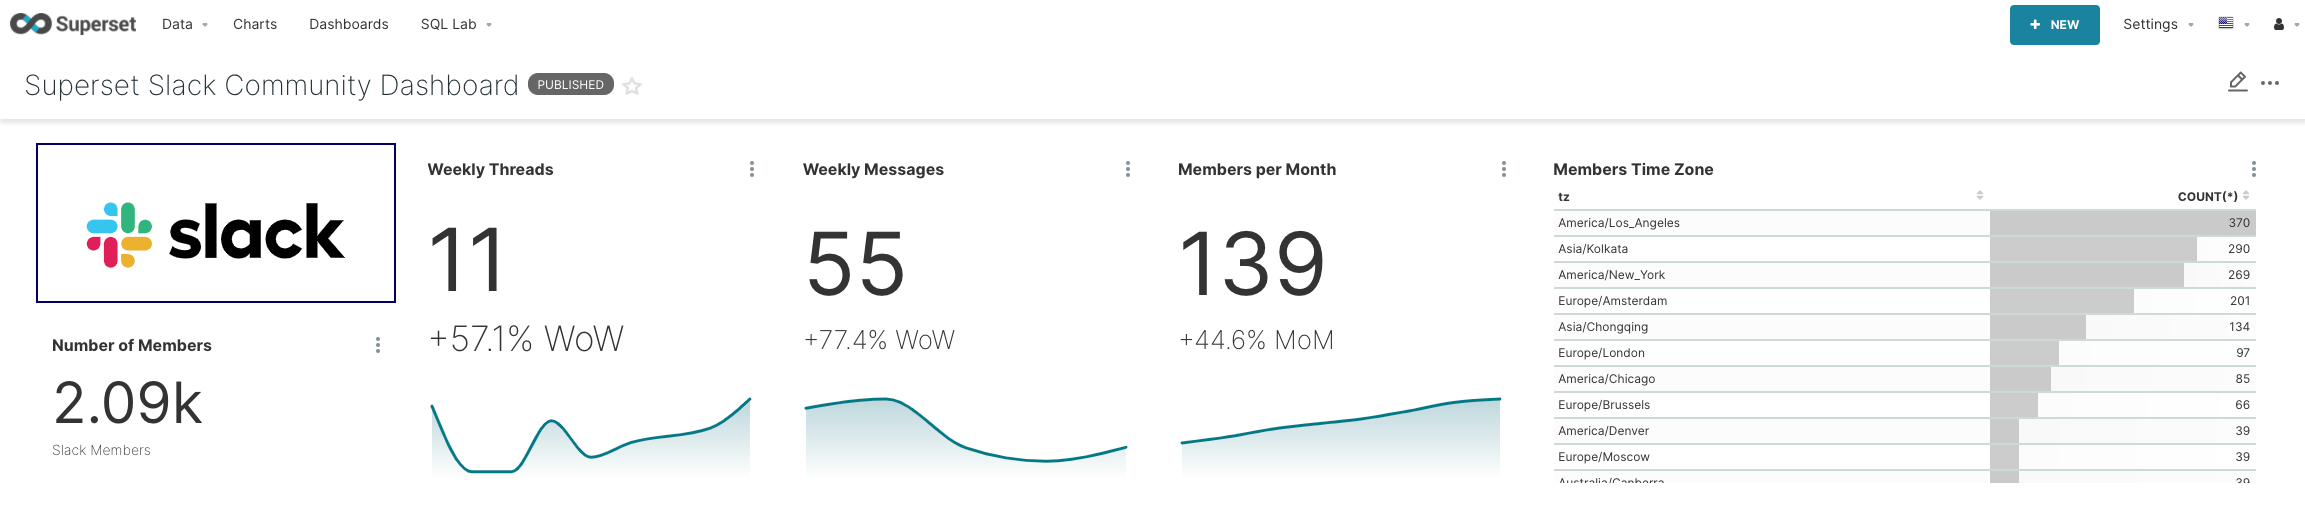
If you navigate to Dashboards > Slack Dashboard, your dashboard should match the following (keep in mind the numbers and charts themselves will differ based on your data!).
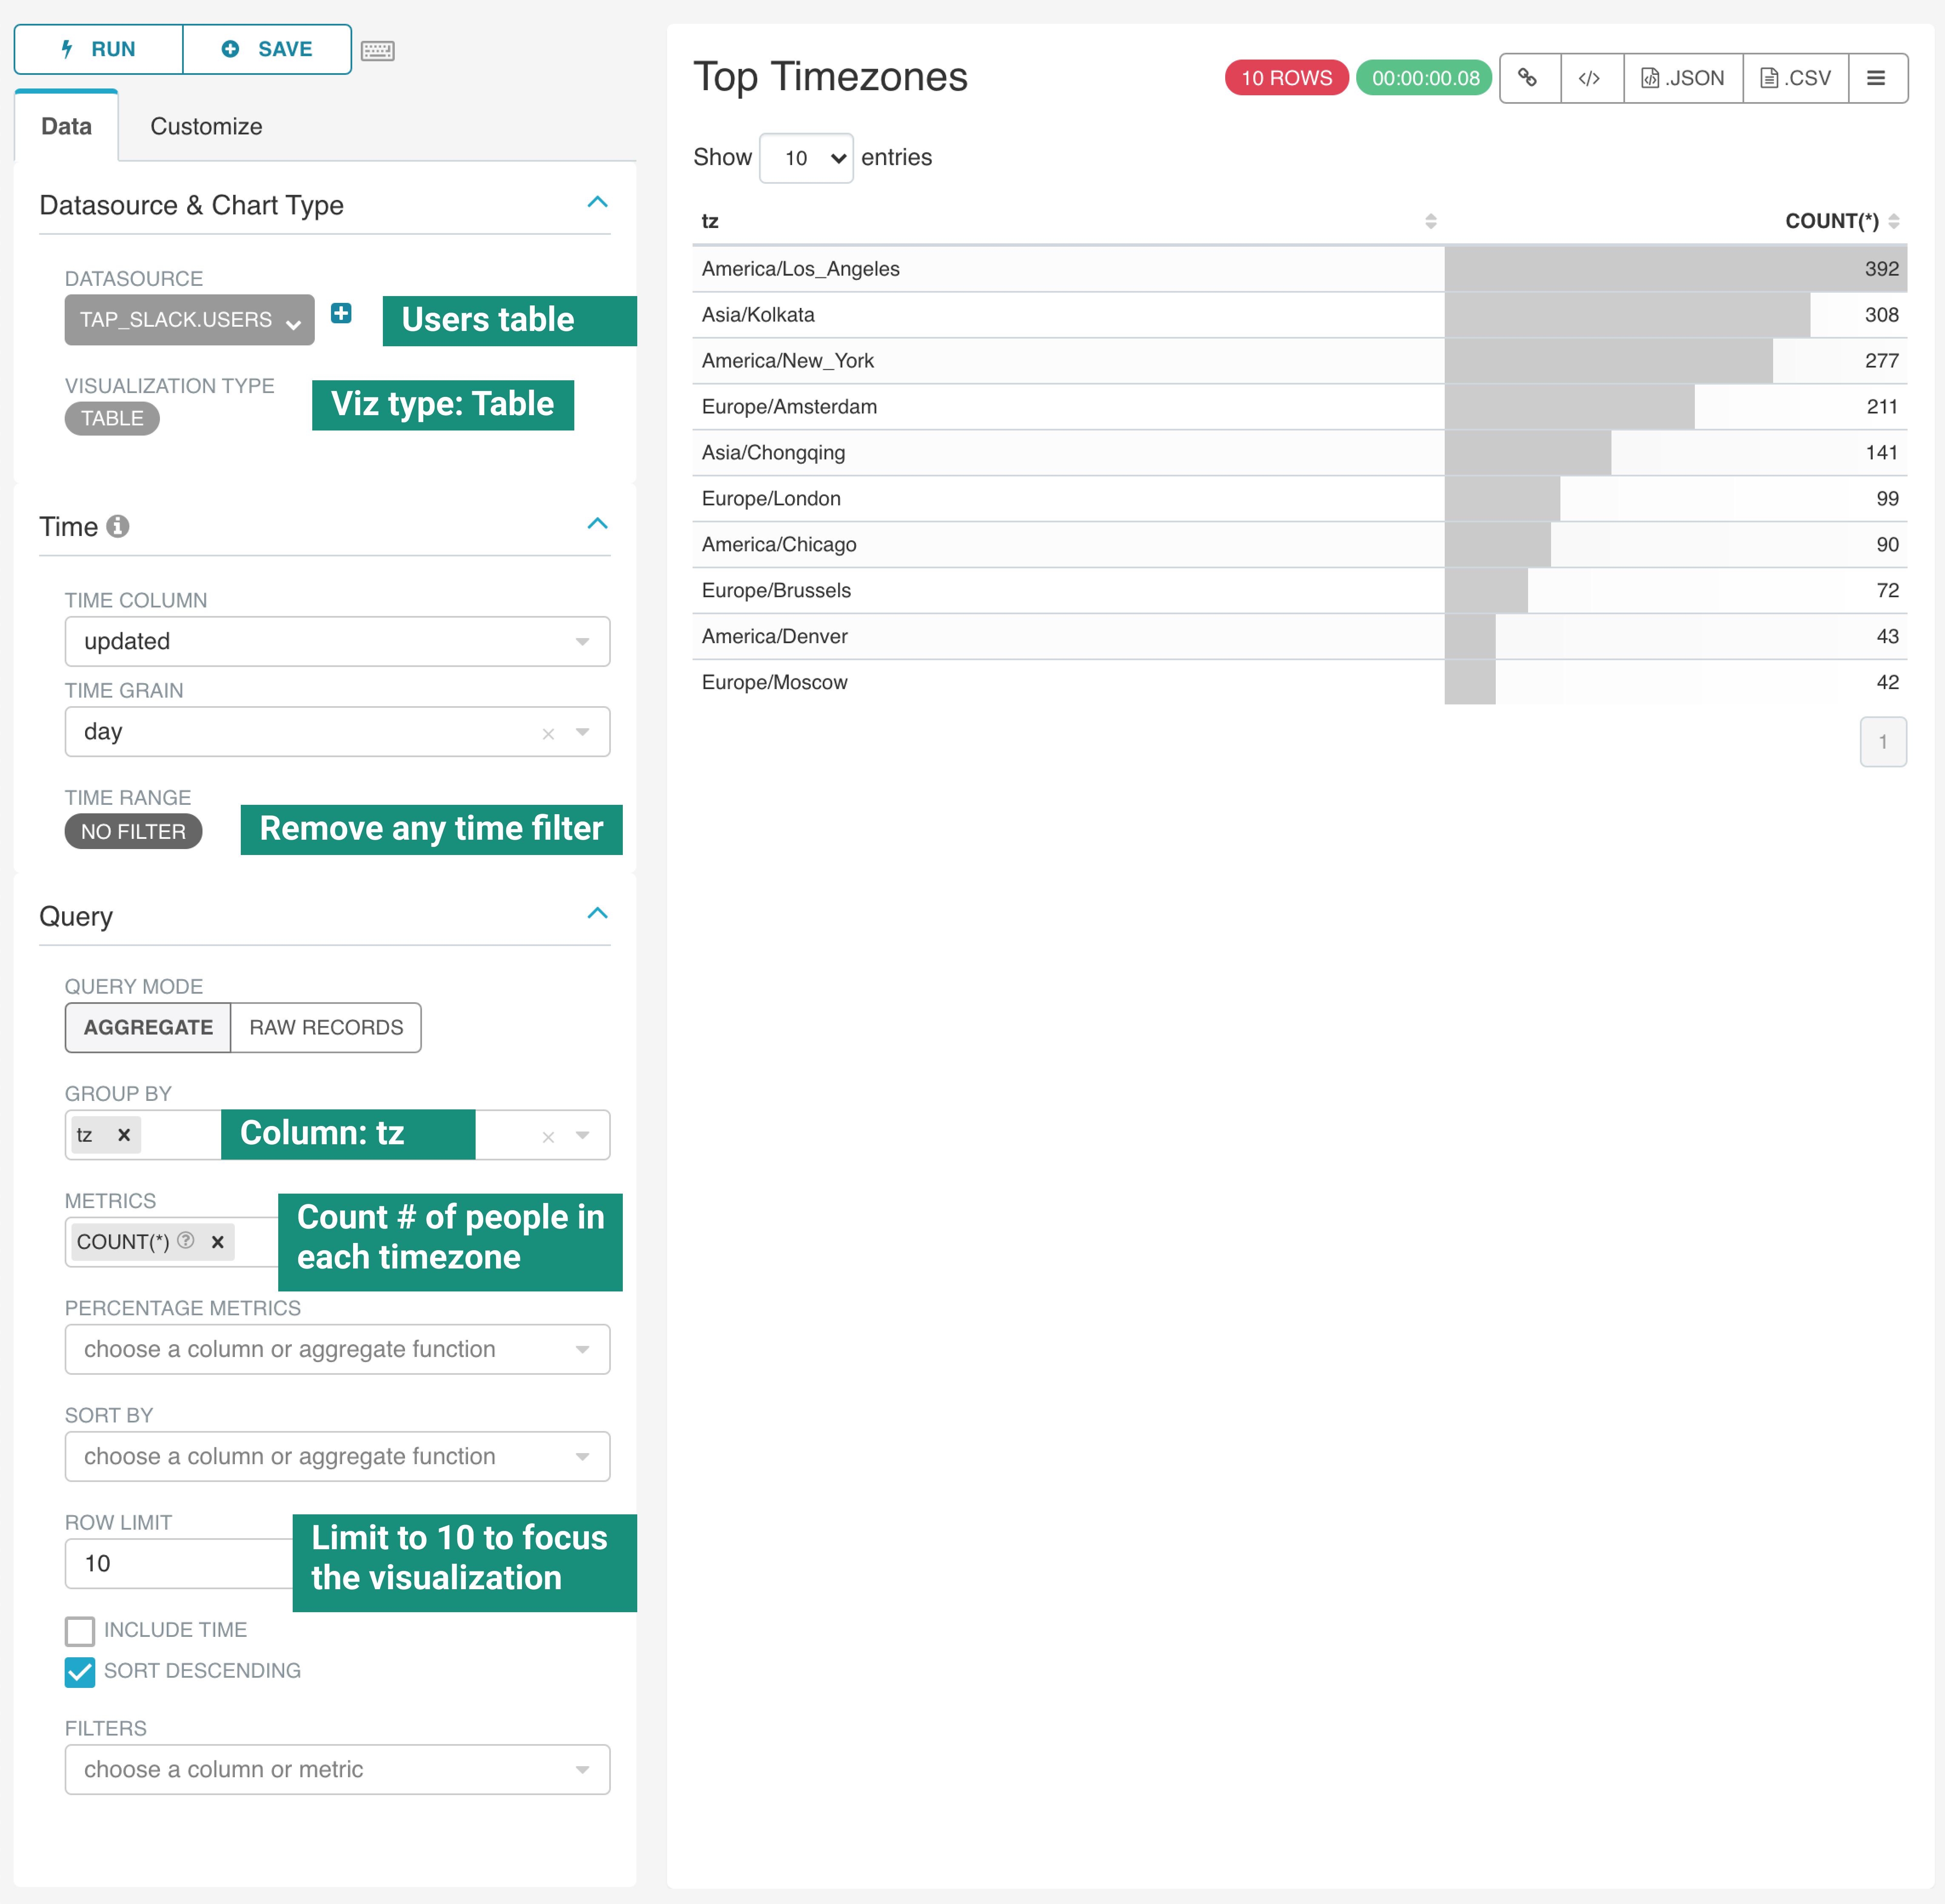
- Now let's create a Table visualization that showcases the top timezones that the members of the Slack community live in. Save the chart to your dashboard when you're done.
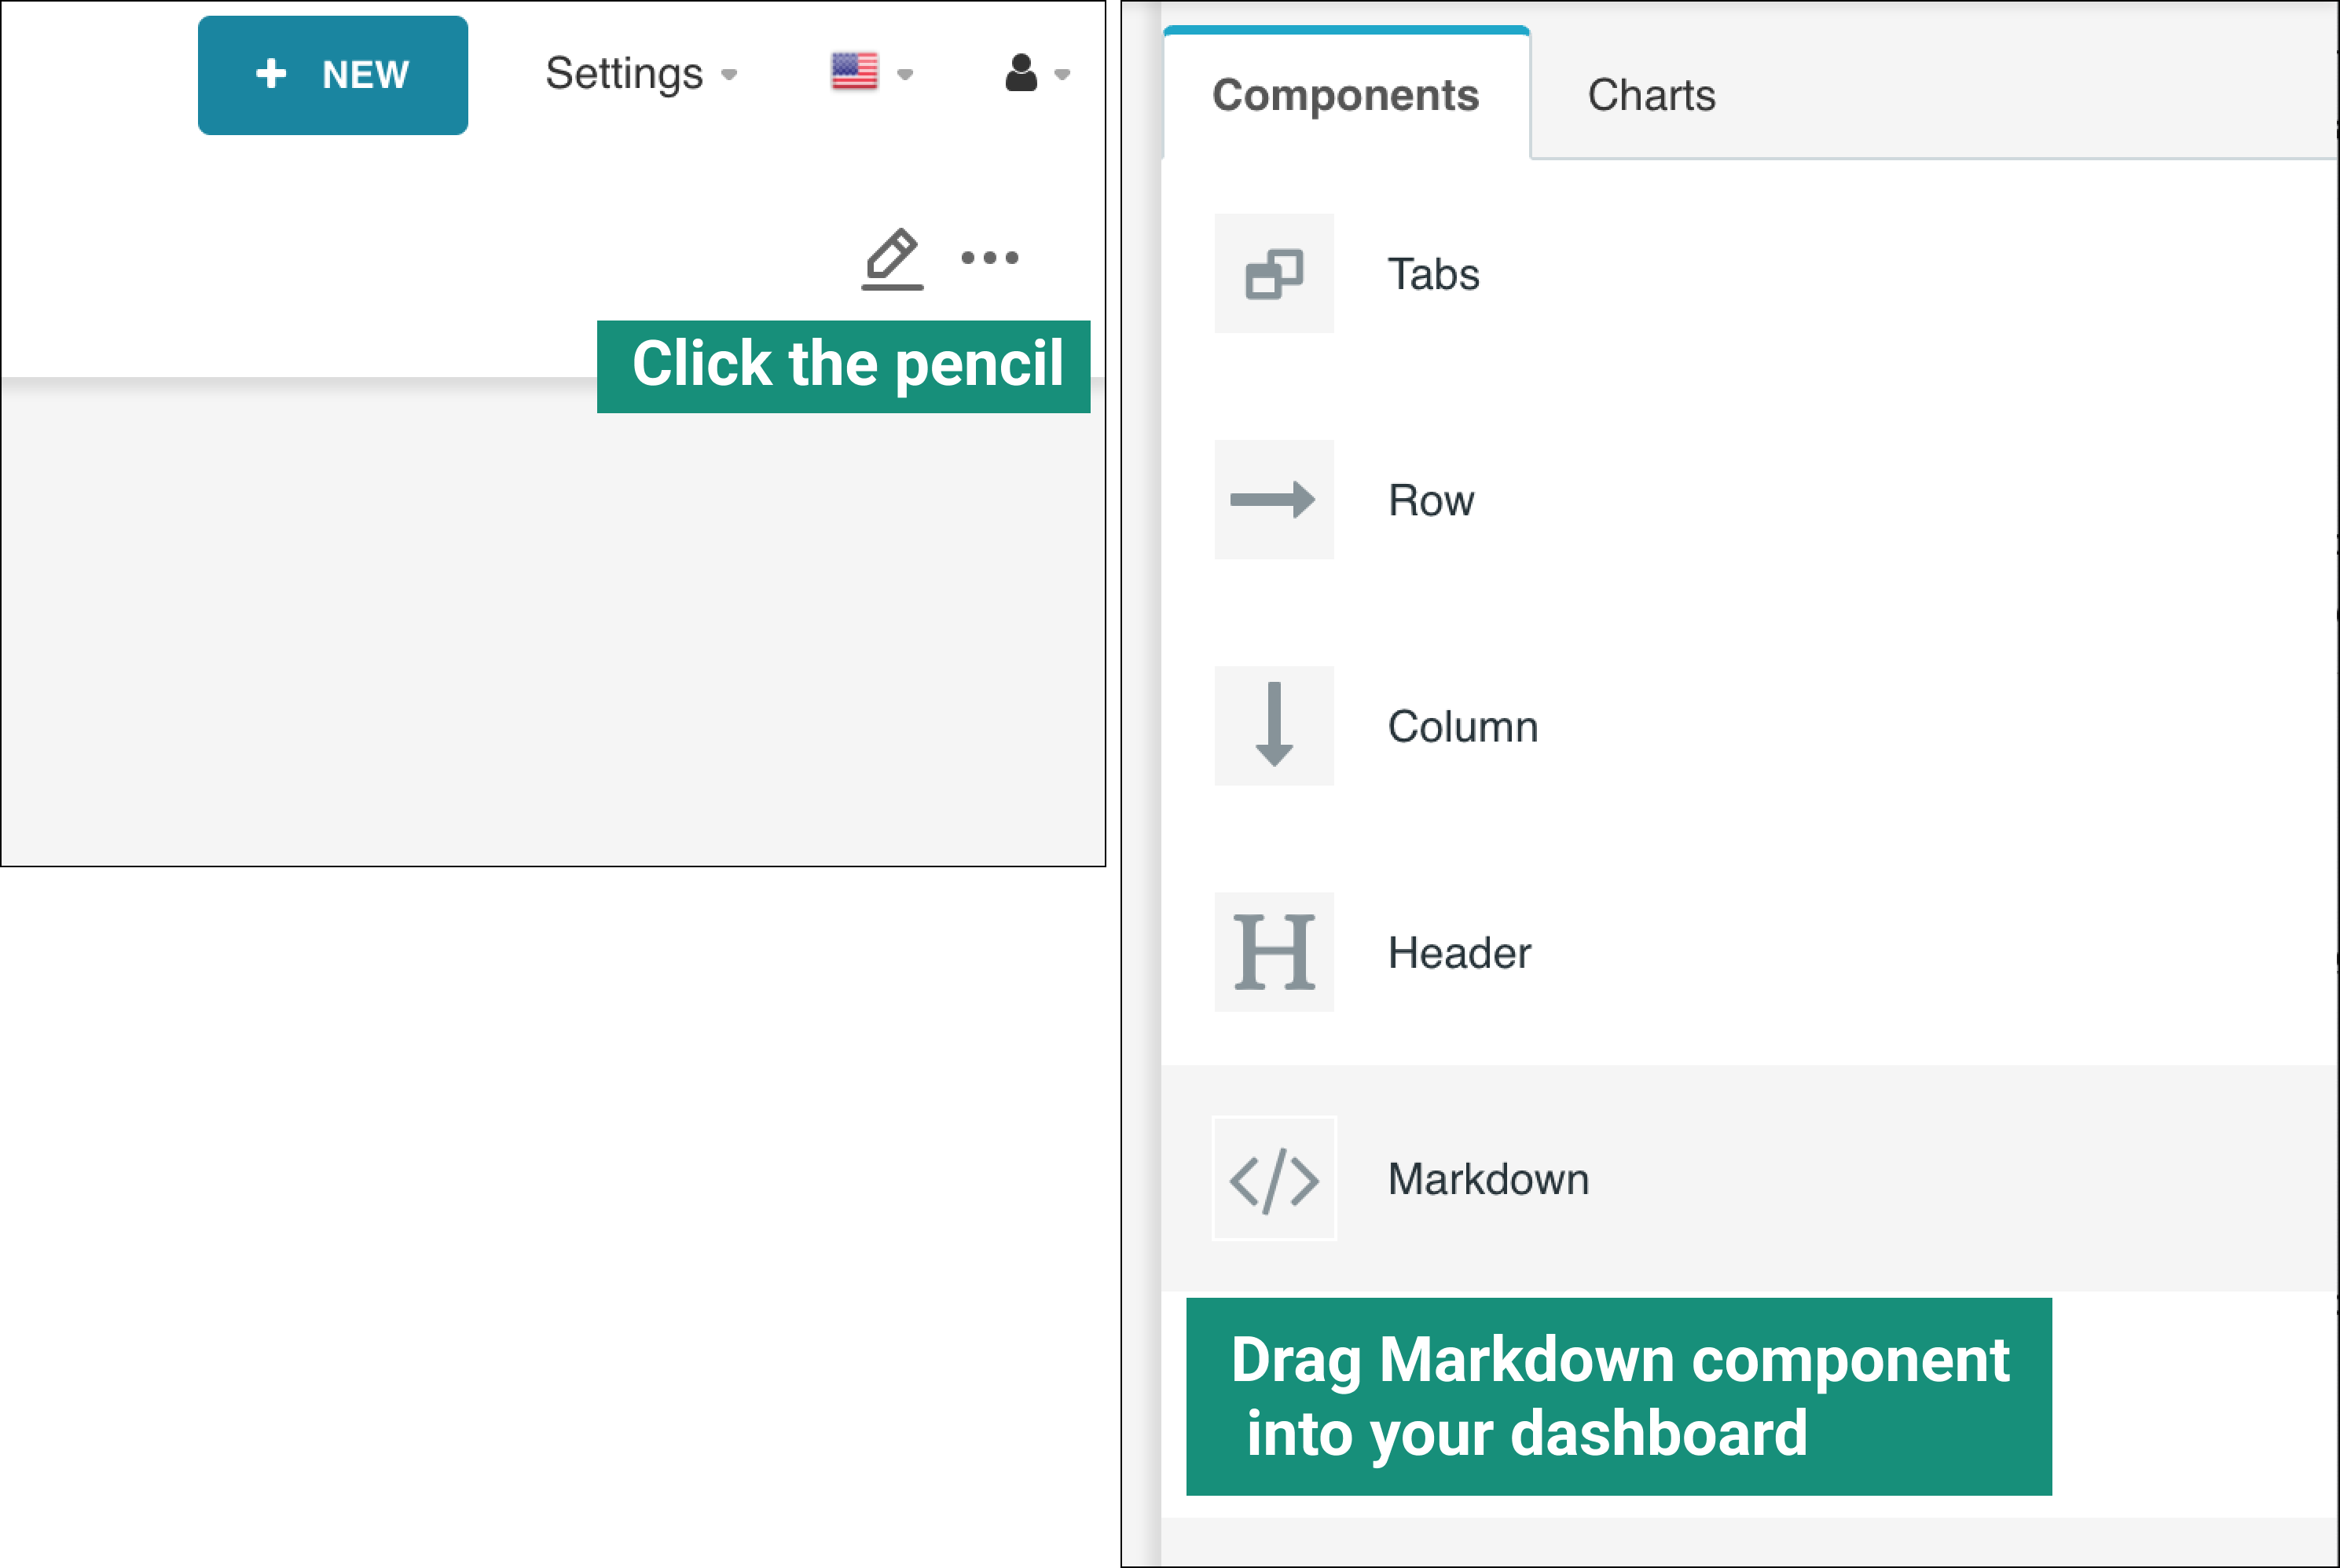
- Finally, let's add the Slack logo to the dashboard. This requires adding a custom Markdown component to your dashboard. First, open your dashboard by navigating to Dashboards > Slack Dashboard (or whatever you named your dashboard). Then, switch to Edit mode and drag the Markdown component into your dashboard.
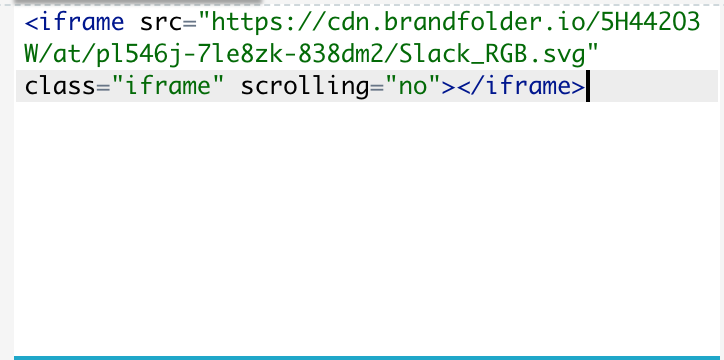
Finally, edit the Markdown so it contains an IFrame link to the Slack logo.
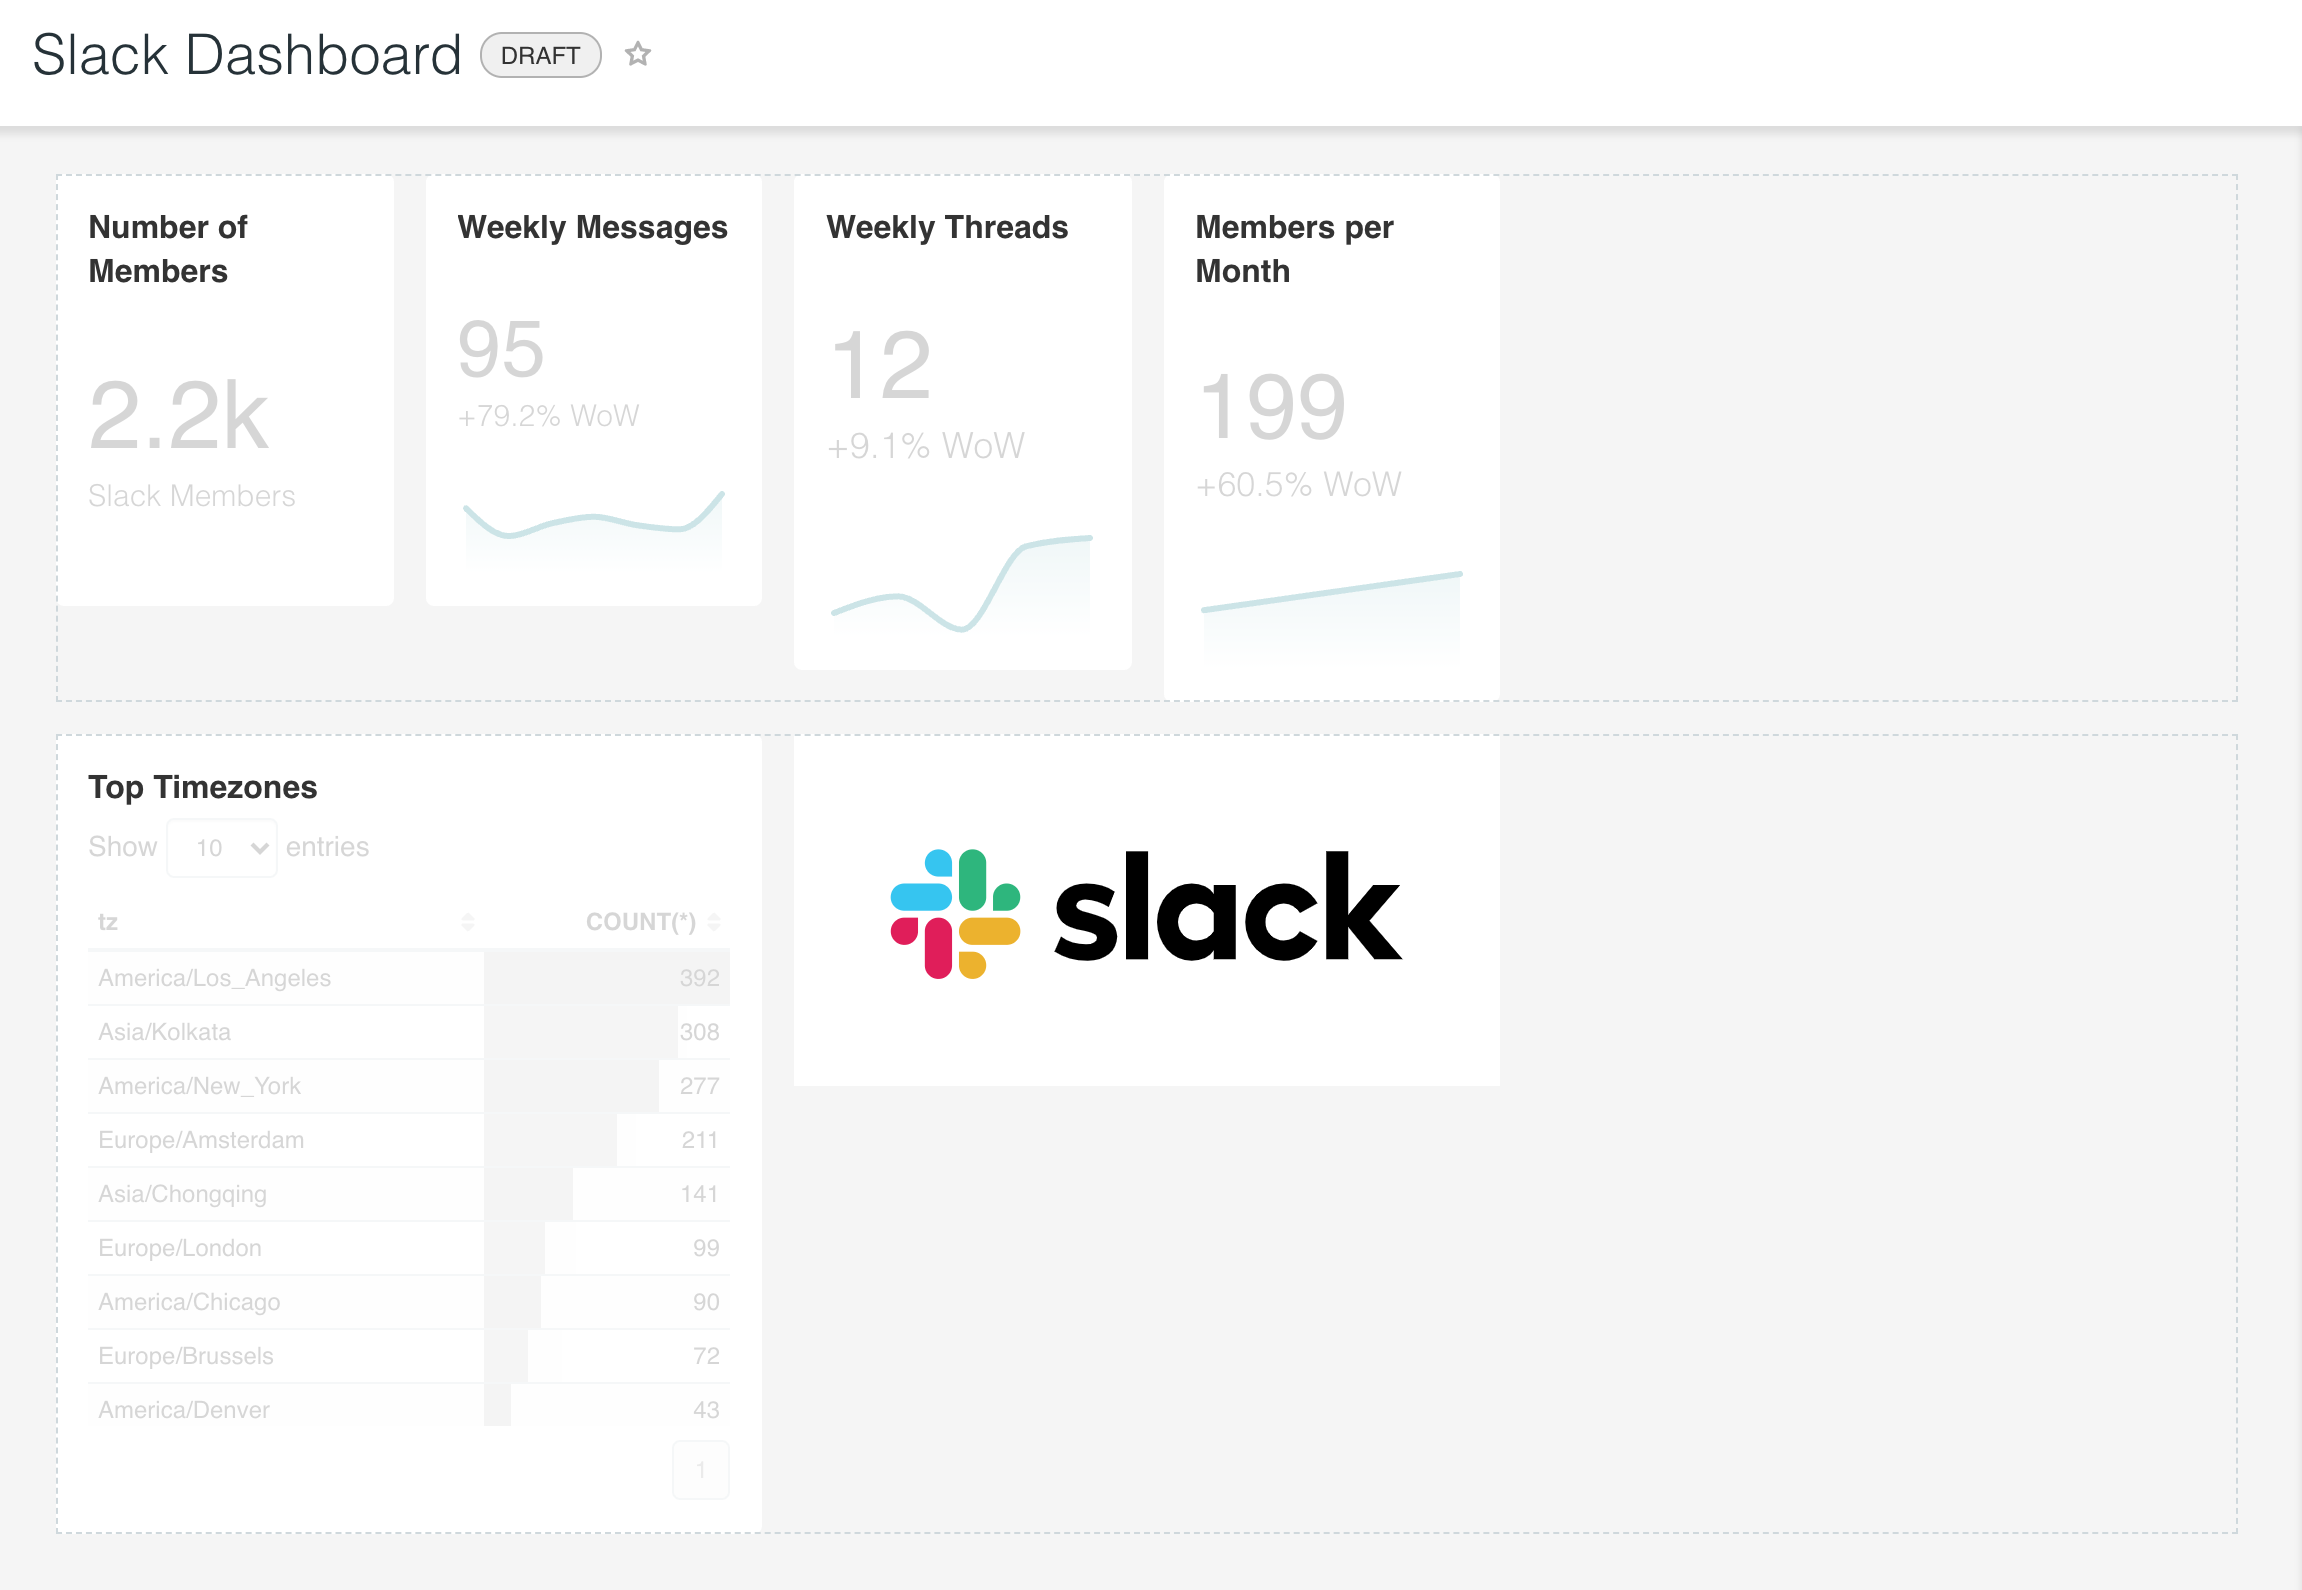
Your dashboard should now resemble the following screenshot:
Rearrange Charts to Craft a Cleaner Dashboard
- Starting from the left side of the dashboard, we need to stack the Slack IFrame above the total number of members chart. To stack 2 charts above each other, you need to first drag in a Column component.
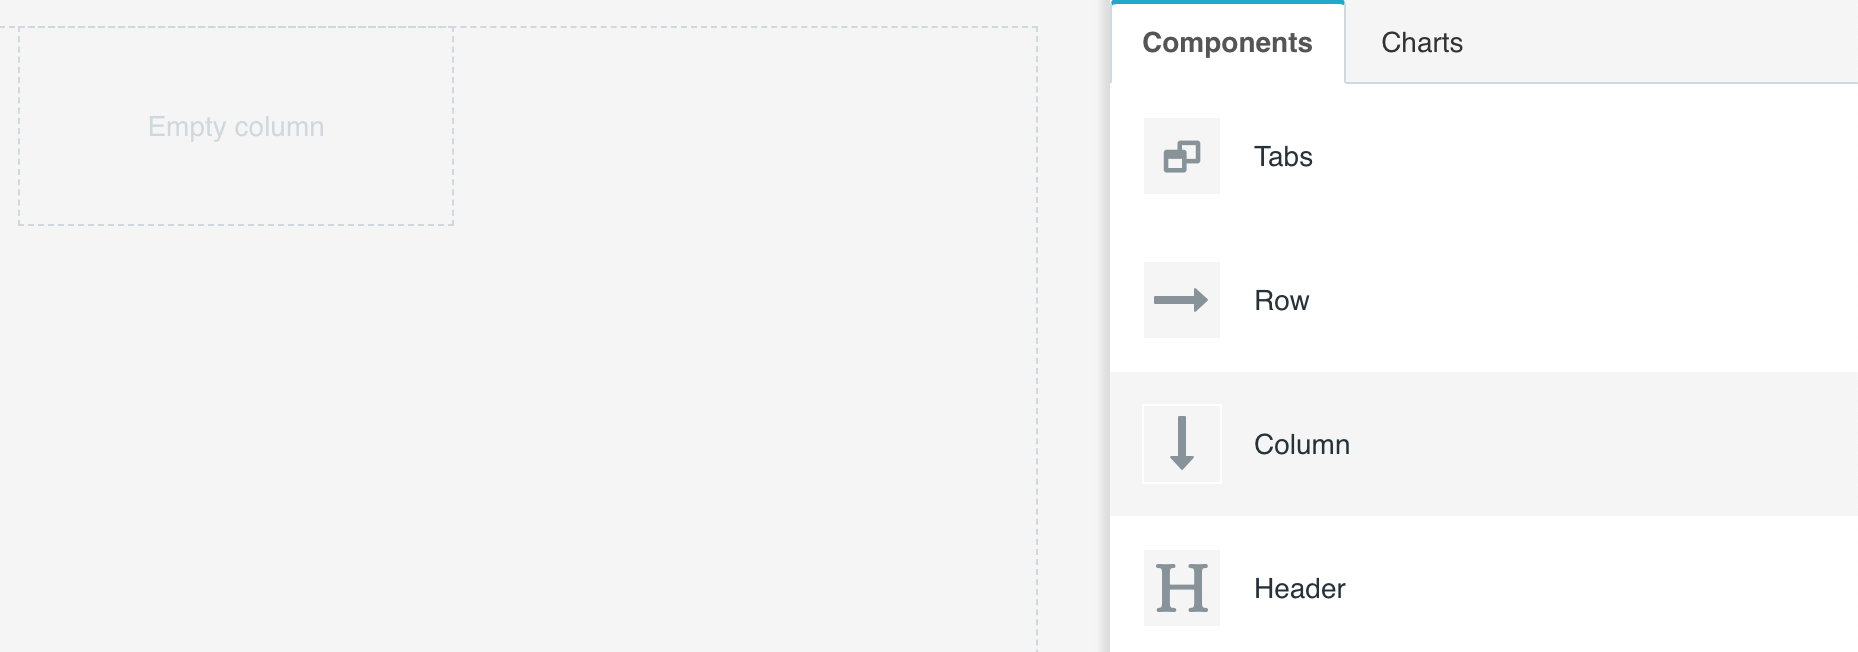
- Then, drag in the Big Number chart first into this column, then add the IFrame chart.
- Finally, end by re-arranging and resizing the rest of the charts to match the following image:
In this post, we learned how to configure Meltano to sync Slack data to a database, how to configure Superset to query that database, and then use the Explore view in Superset to create charts without any coding.
In the next post, we'll cover how to perform ELT, create more advanced visualizations, and customize the dashboard further to your needs.
