


ANNOUNCEMENTS
What’s New in Preset - Summer 2023


Discover the latest product features and enhancements from Preset's recent releases. Read on for a quarterly recap and visit our changelog for full details.
Announcement
- Find more insights with Drill By! Drill By, the latest drilling functionality in Preset, makes data analysis easier by allowing the slicing and dicing of data directly in the visualizations. Unlike the traditional "drill-down", you can filter and group by any dimension in your dataset in any order without having to define a hierarchy ahead of time.
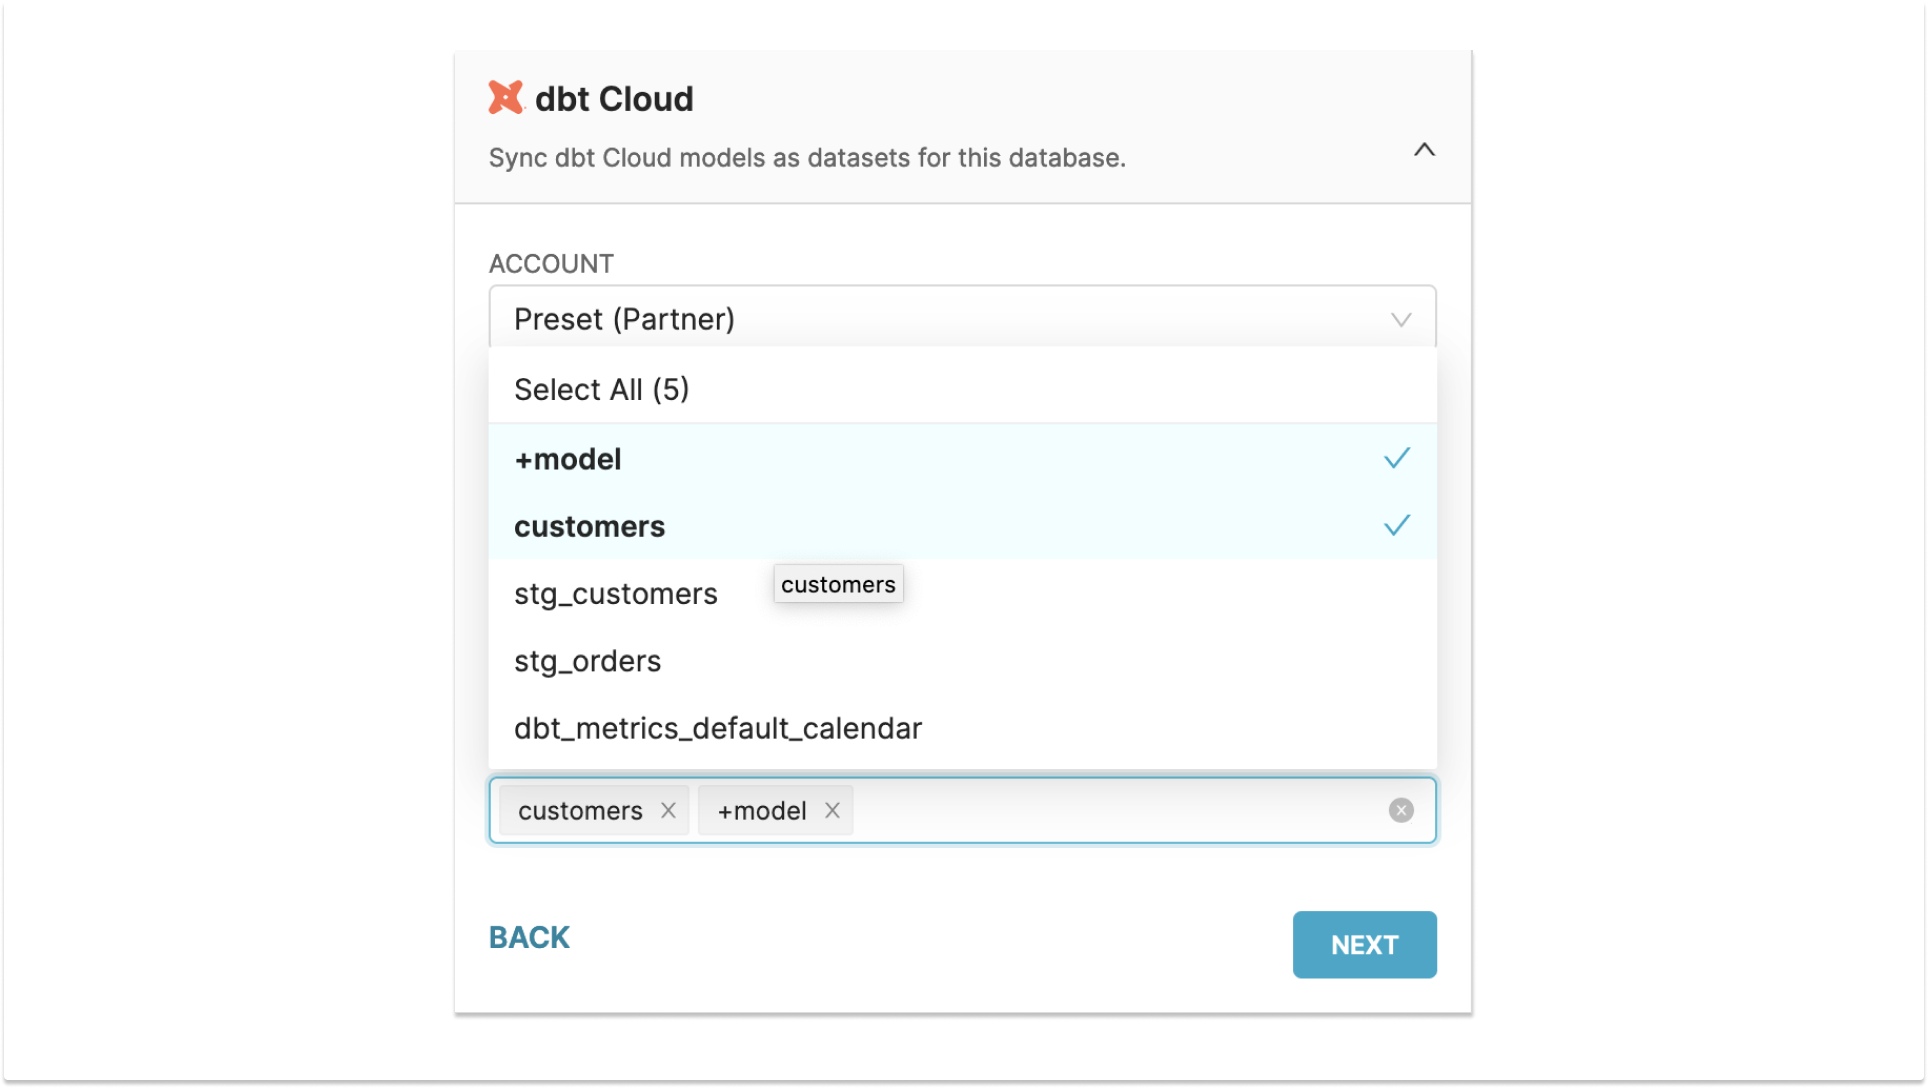
- Preset now integrates with dbt Cloud via its user interface1, enabling data teams to define data models (databases, datasets, and metrics) as version-controlled assets within dbt Cloud and to synchronize them with Preset Cloud. While we have been supporting integration with dbt Cloud and dbt Core through Preset CLI for some time, the new feature allows you to seamlessly sync the two tools via UI.
New Features
Self-Serve Analytics
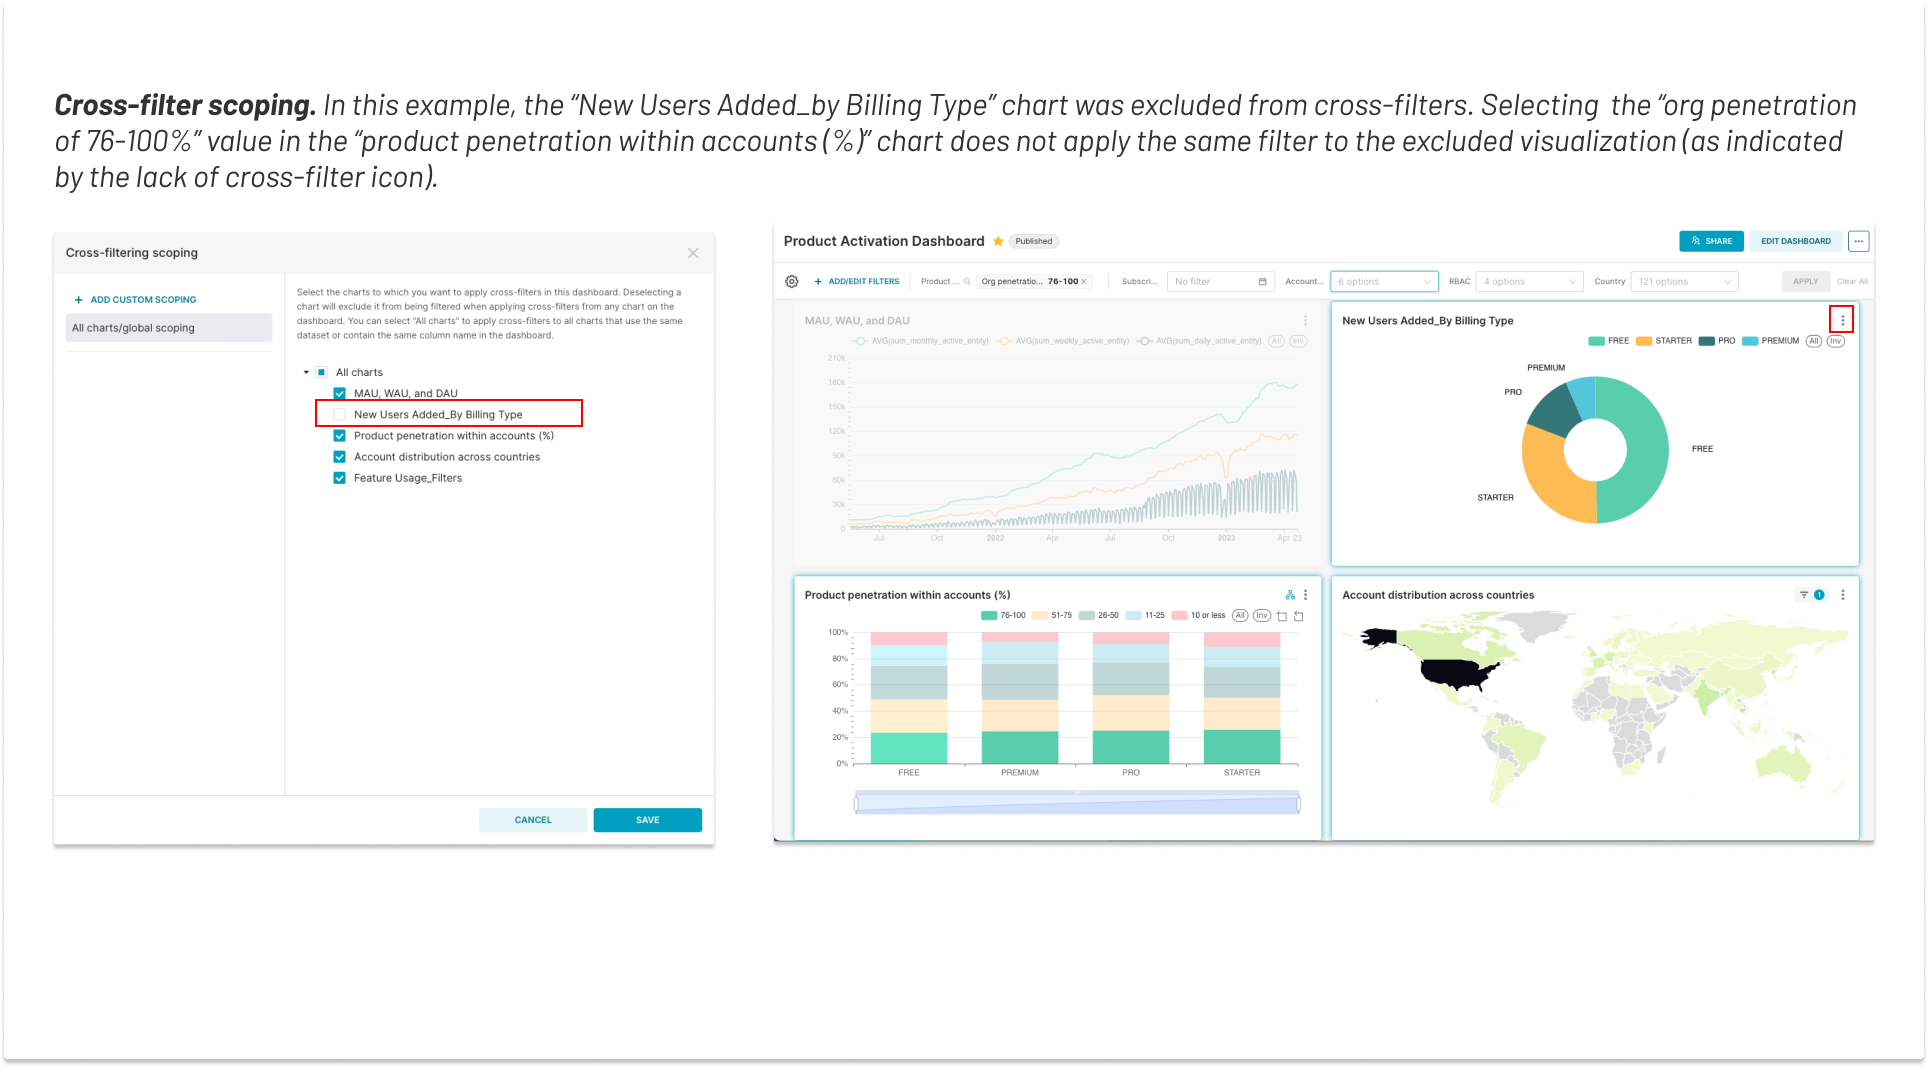
- Cross-filter scoping allows you to specify which visualizations within the dashboards will be affected by cross-filters. This feature ensures that charts can be excluded from dashboard filtering if it does not logically align with the filtering context.
- You can now customize the currency format for saved metrics in specific charts. Supported currencies encompass popular options such as "USD," "EUR," "GBP," "INR," "MXN," "JPY," "CNY," and many others*.
*: Current formatting is supported in the following charts today: Area Chart, Line Chart, Big Number Chart, Funnel Chart, Gauge Chart, Heatmap, Line Chart, Mixed Chart, Pie Chart, Pivot Tables, Smooth Line Chart, Stepped Line Chart, Sunburst Chart, Tables, Treemap, WorldMap.
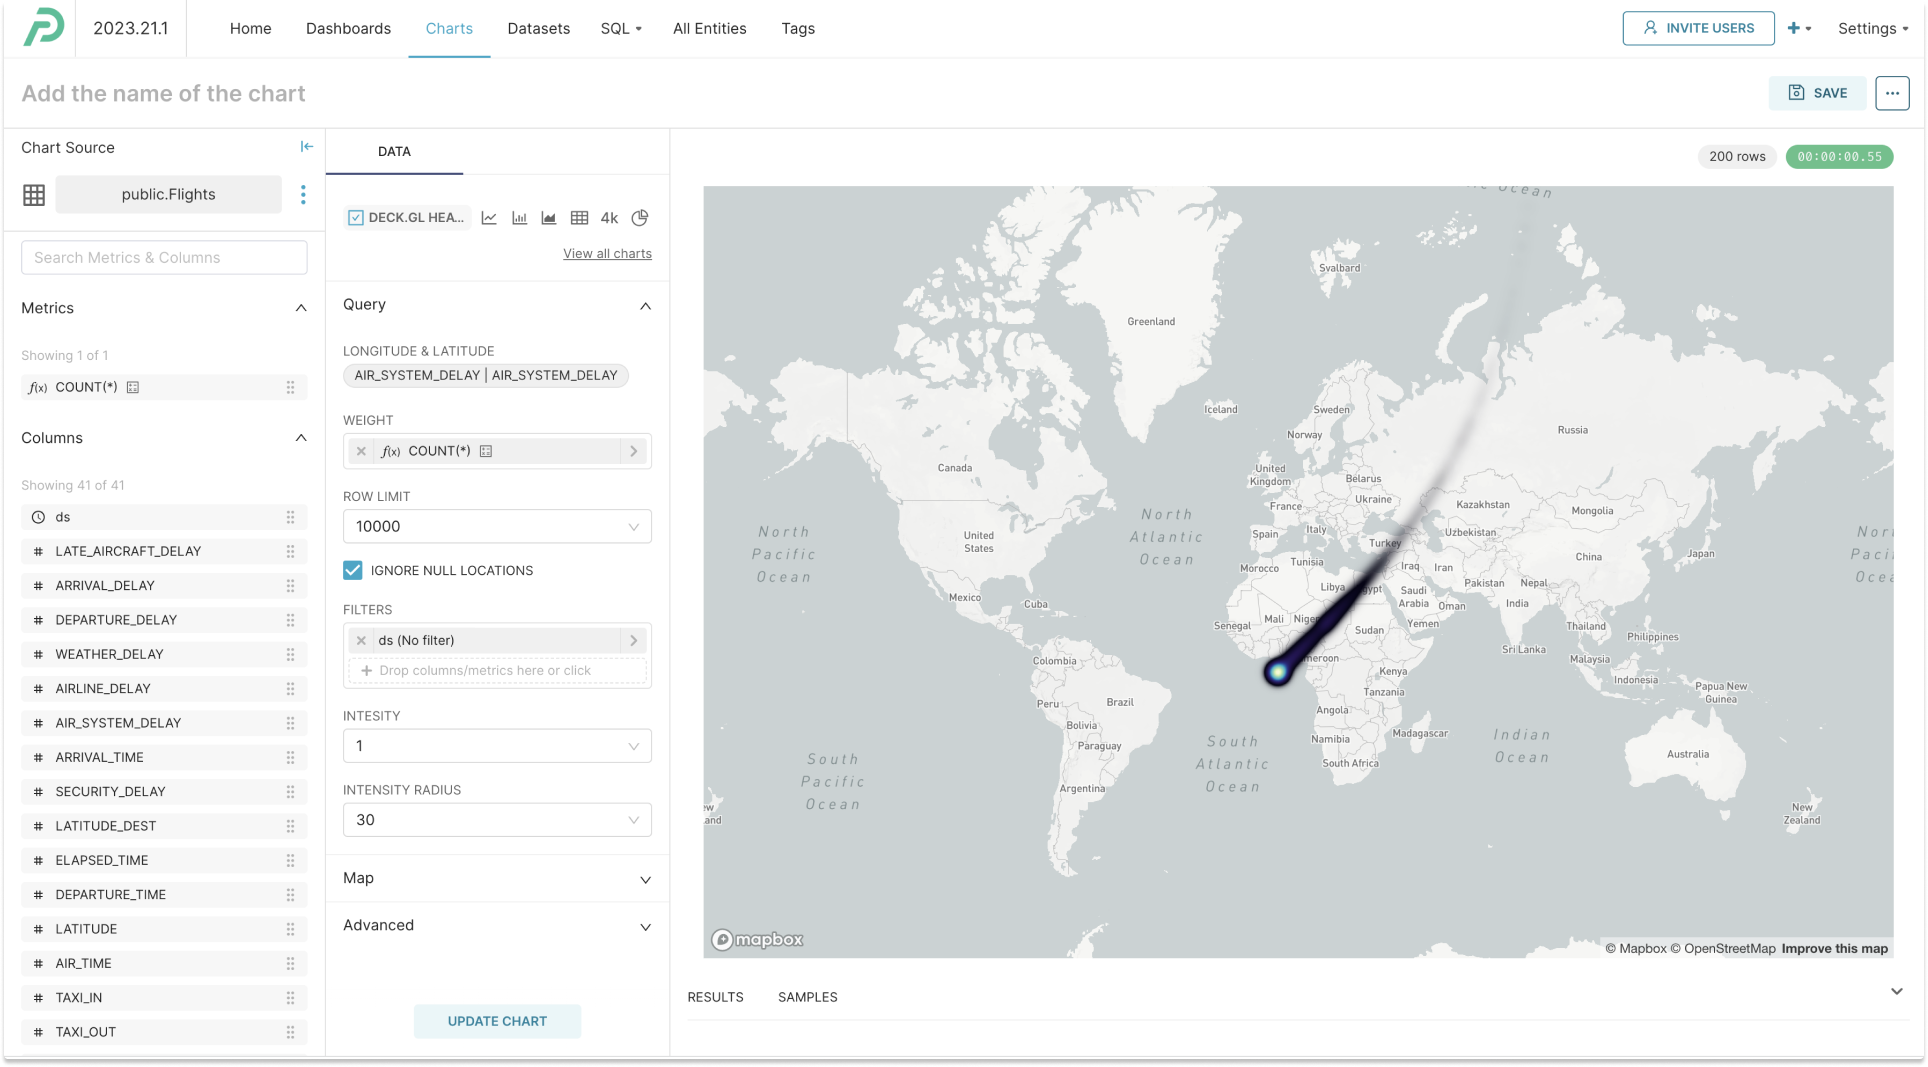
- Deck.gl’s heatmap chart is now accessible in Preset, enabling you to effectively display the spatial distribution of data.
Customization and Theming
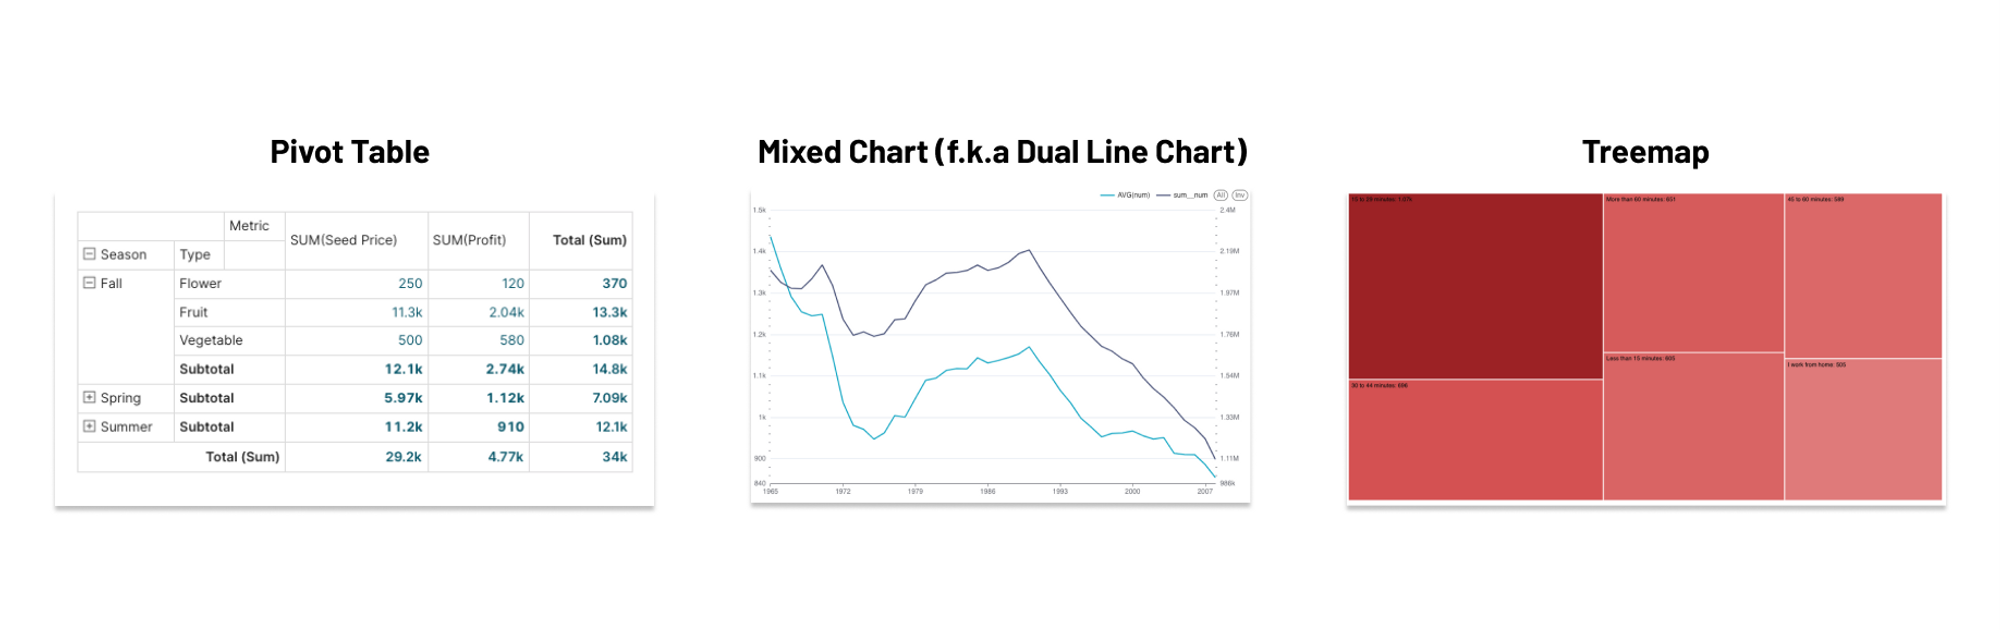
- The Pivot Table, Dual-Line Chart, and Treemap have undergone visual and feature enhancements. See here to learn more about the differences between the new and old chart types.
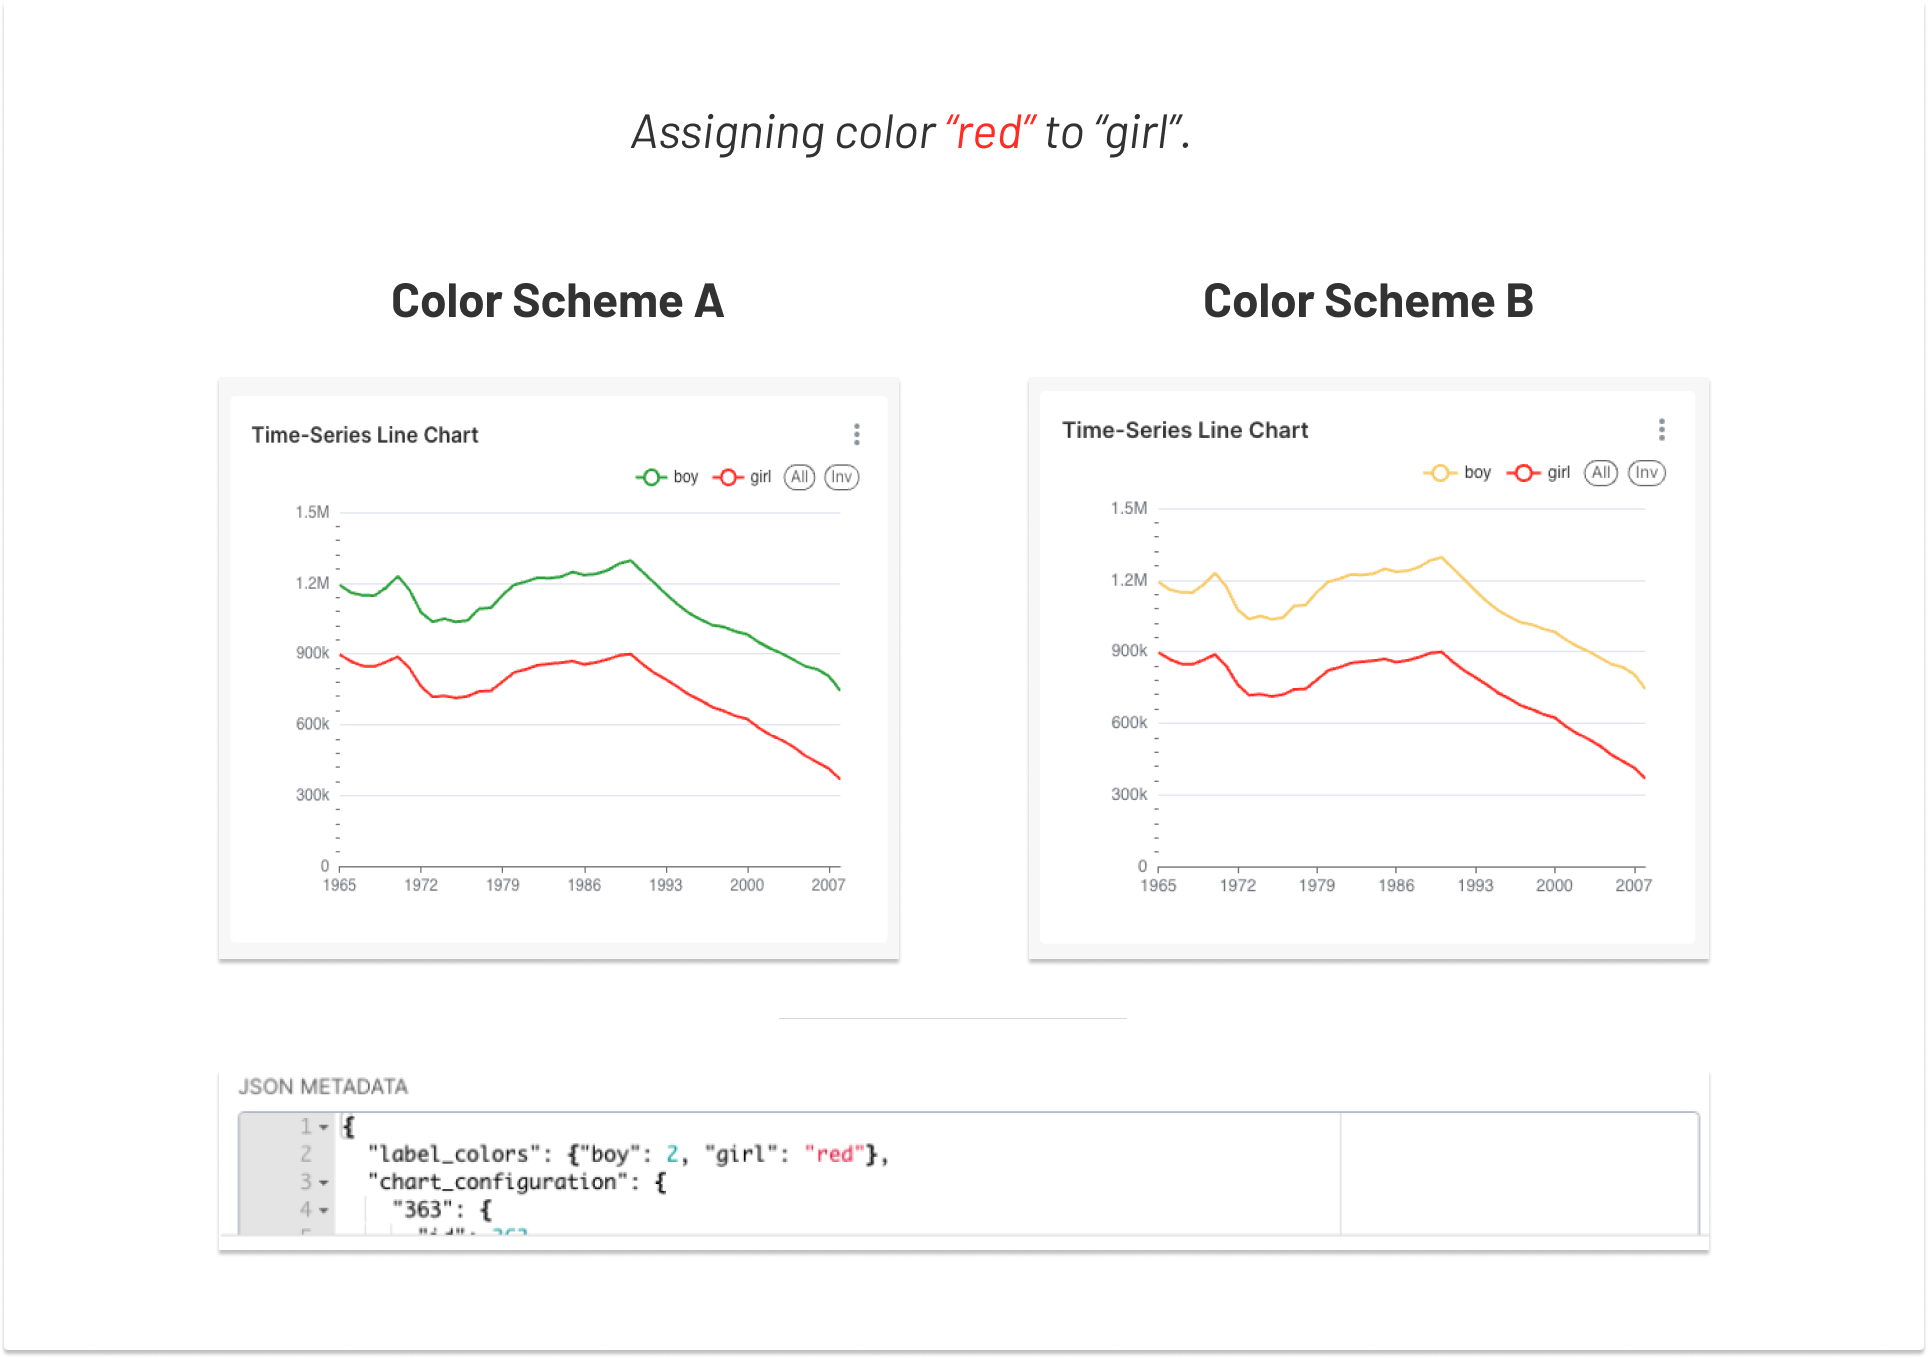
- You can now assign individual colors to series values based on the color scheme index. This feature allows you to retain the assigned colors even when switching between different color schemes.
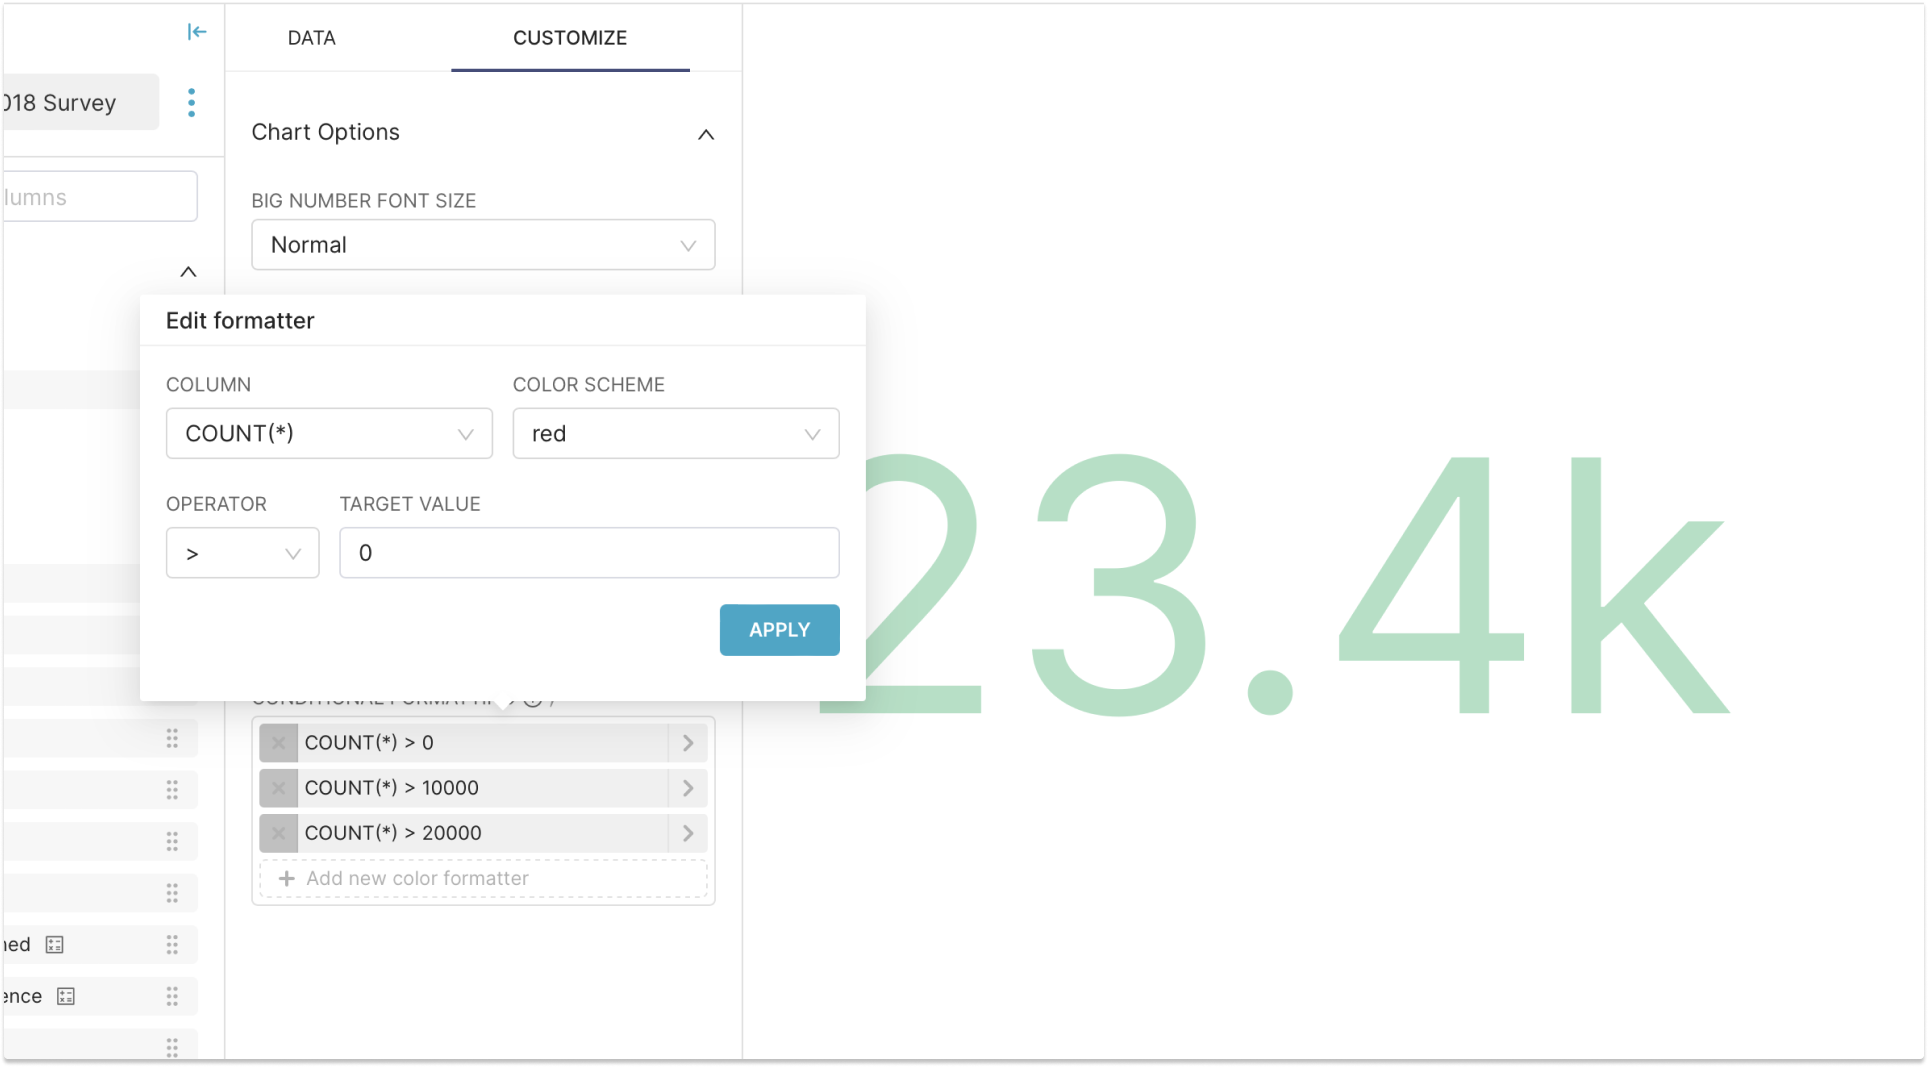
- Big Number charts support conditional formatting (coloring), facilitating a clear visualization of how the numbers compare to goals, forecasts, or expectations in real time.
Database Connection
- Preset Cloud now supports the connection of DuckDB, enabling teams to create datasets and visualizations from the DuckDB database.

User Experience and Workflow Improvements
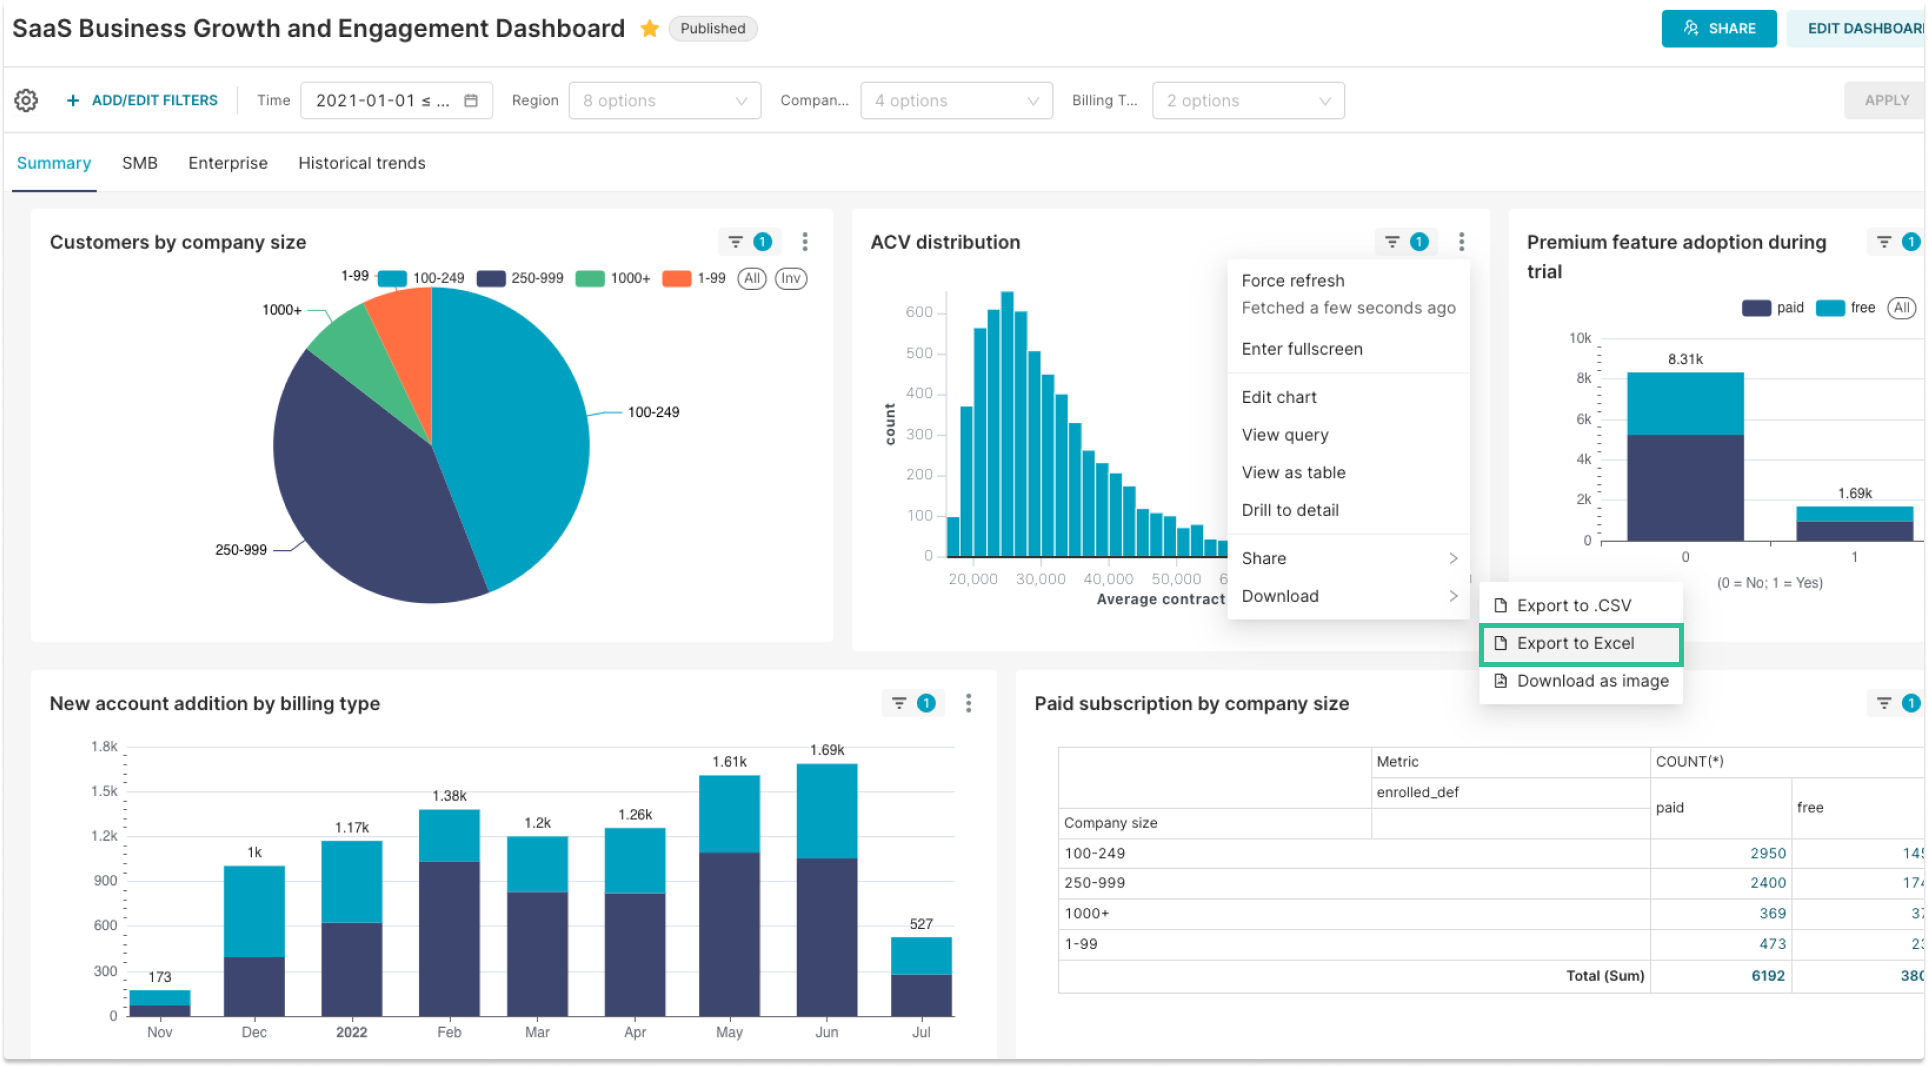
- Individual charts on dashboards can now be exported in the Excel (.xlsx) file format, allowing you to easily extract and share specific charts with others.
- We’ve improved the dynamic numeric search in dashboard filters to return more accurate results.
More Features and Enhancements
Below are just a few updates from the last quarter. Bookmark Preset’s changelog to keep track of all enhancements and fixes.
- (Dashboard) Search input in the filters is retained when selecting values that contain the same search input, making it easier to select multiple values.
- (Chart) The Calendar Heatmap chart is once again available in the visualization library.
- (Chart) In Mixed Charts, you can now define the bounds of the secondary y-axis.
- (Chart) Table charts now support hyperlinks.
- (Chart) You can manually adjust the lower bound of the y-axis to extend the logarithmic limit beyond 10 when a set of series contains zero values.
- (Chart Builder) You can now export your chart data to Excel.
- (Chart Builder) You can now see more details about the data types in a tooltip when you hover over the “#” and “abc” icons of the type column options in the “metadata” panel.
- (Alerts & reports) You can now customize the screenshot width of alerts and reports 2.
- (Admin) Usage metrics, such as the volumes of active users, charts, and dashboards, are now available on the Enterprise plan by default. This feature empowers Workspace Admins with insights to track the usage and engagement of their teams.
Head over to your Preset workspace to try out new features!
1 Available on the Preset Enterprise plan only.
2 Available on the Preset Enterprise and Professional plans only.
