


Build a Cloud Asset Inventory Dashboard Using CloudQuery and Superset


This post was originally published on the CloudQuery blog
CloudQuery is an open-source cloud asset inventory solution powered by SQL. CloudQuery extracts, transforms, and loads your cloud assets into normalized PostgreSQL tables.
In this blog post, I will walk you through how to setup CloudQuery to build your cloud asset inventory in PostgreSQL and connect it to Apache Superset (or Preset Cloud) for visualization, monitoring and reporting.
Overview
Architecture
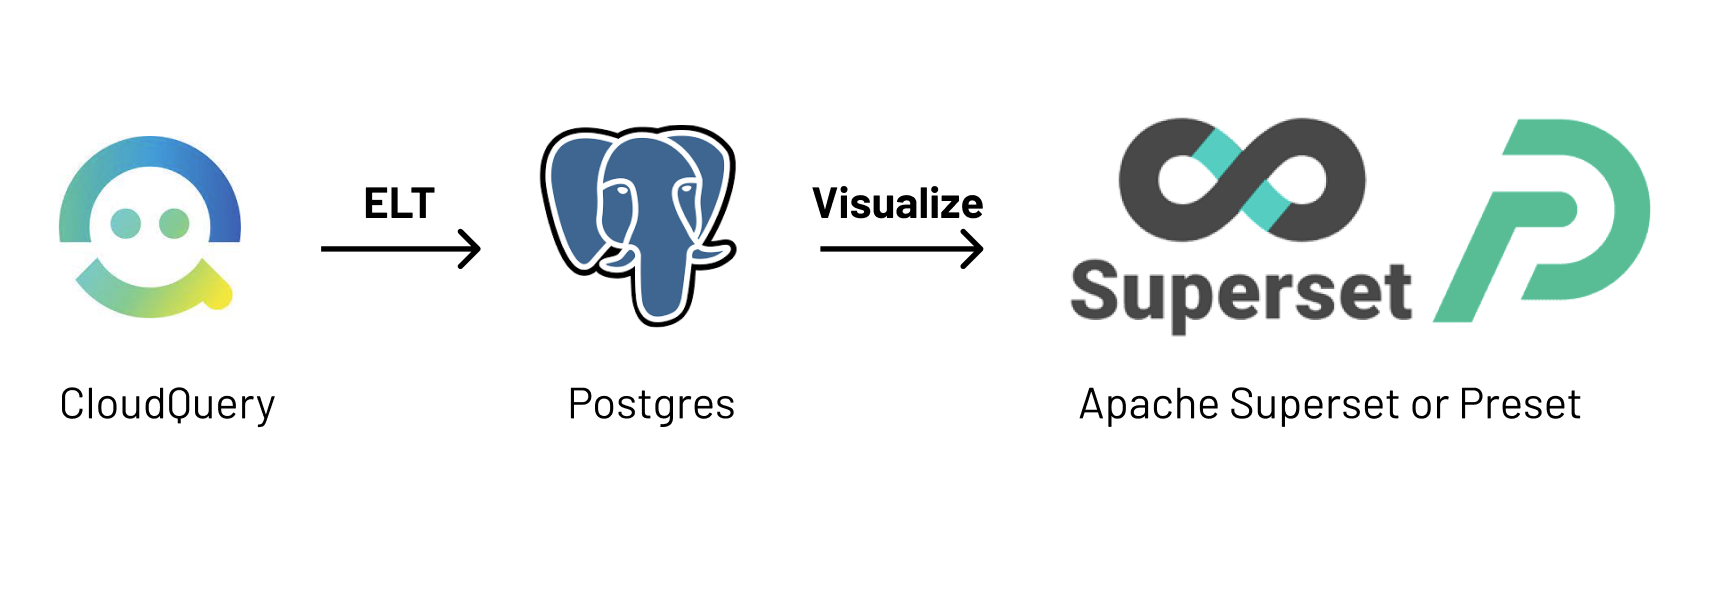
- ETL (Extract-Transform-Load) ingestion layer: CloudQuery
- Database: PostgreSQL
- Data Visualization and Exploration Platform: Apache Superset
End Goal
- Raw SQL access to your cloud asset inventory to create views or ask & answer questions about your resources
- Multi-cloud asset inventory: ingest configuration from all of our cloud environments to a single database with a tidy, unified structure
- Avoid yet-another-dashboard-fatigue: instead of spinning up another analytics tool, re-purpose your existing Apache Superset setup
Walkthrough
Step 1: Install or Deploy CloudQuery
If it’s your first time using CloudQuery we suggest you first run it locally to get familiar with the tool, take a look at our Getting Started with AWS Guide.
If you are already familiar with CloudQuery, take a look at how to deploy it to AWS on Amazon Aurora and EKS here.
Step 2: Install Superset or Signup for Preset Cloud
Apache Superset is an open source Data Visualization and Data Exploration Platform so there are a number of ways to deploy it:
- Self-hosted (local, Docker, k8s): installation guide
- SaaS (public cloud): Preset Cloud
- Private cloud: Preset Managed Private Cloud
Step 3: Connecting to PostgreSQL
By default RDS Aurora instances are not accessible from the public internet. In order to enable access by Preset you are going to have to update your security groups to include the IP ranges that Preset publishes. If you deploy it in your own VPC you might be able to connect it in your private network.
Now you can connect preset to your PostgreSQL database by clicking “New Database”, choosing PostgreSQL and filling-in the following form:
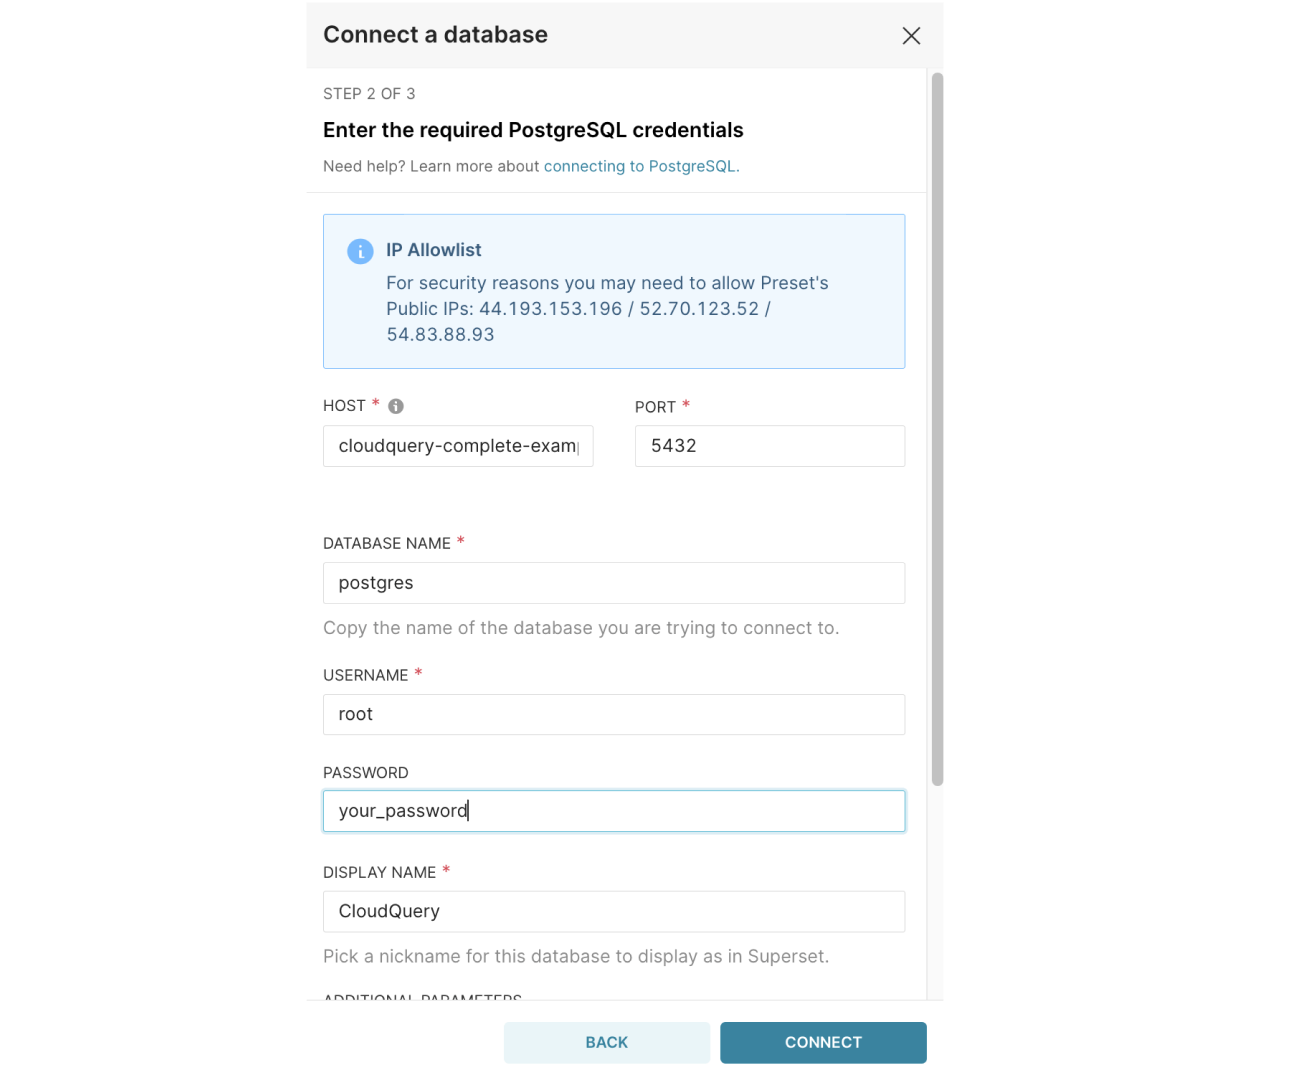
If all your credentials are correct, click Connect and then Finish.
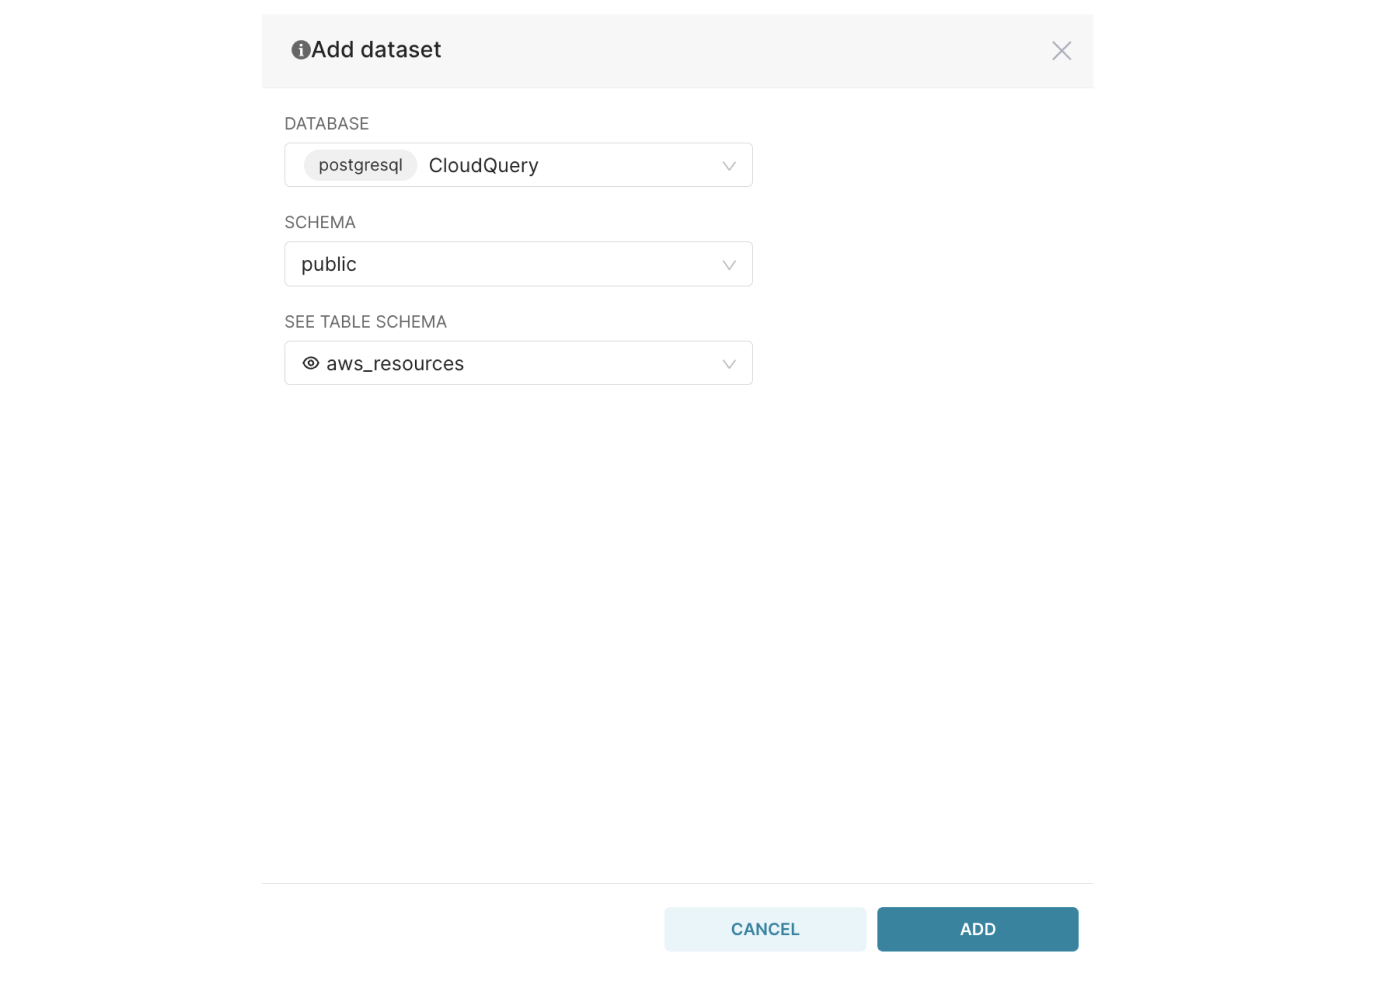
Step 4: Create a Dataset
To create charts in Superset, you will need to first create a dataset (for full details, check out the Preset Docs).
In this guide we will create a dataset from a view (also, see blog) we already created on our database but you can also create a dataset from any complex query you can think off in Superset SQL Lab.
Step 5: Create your first chart!
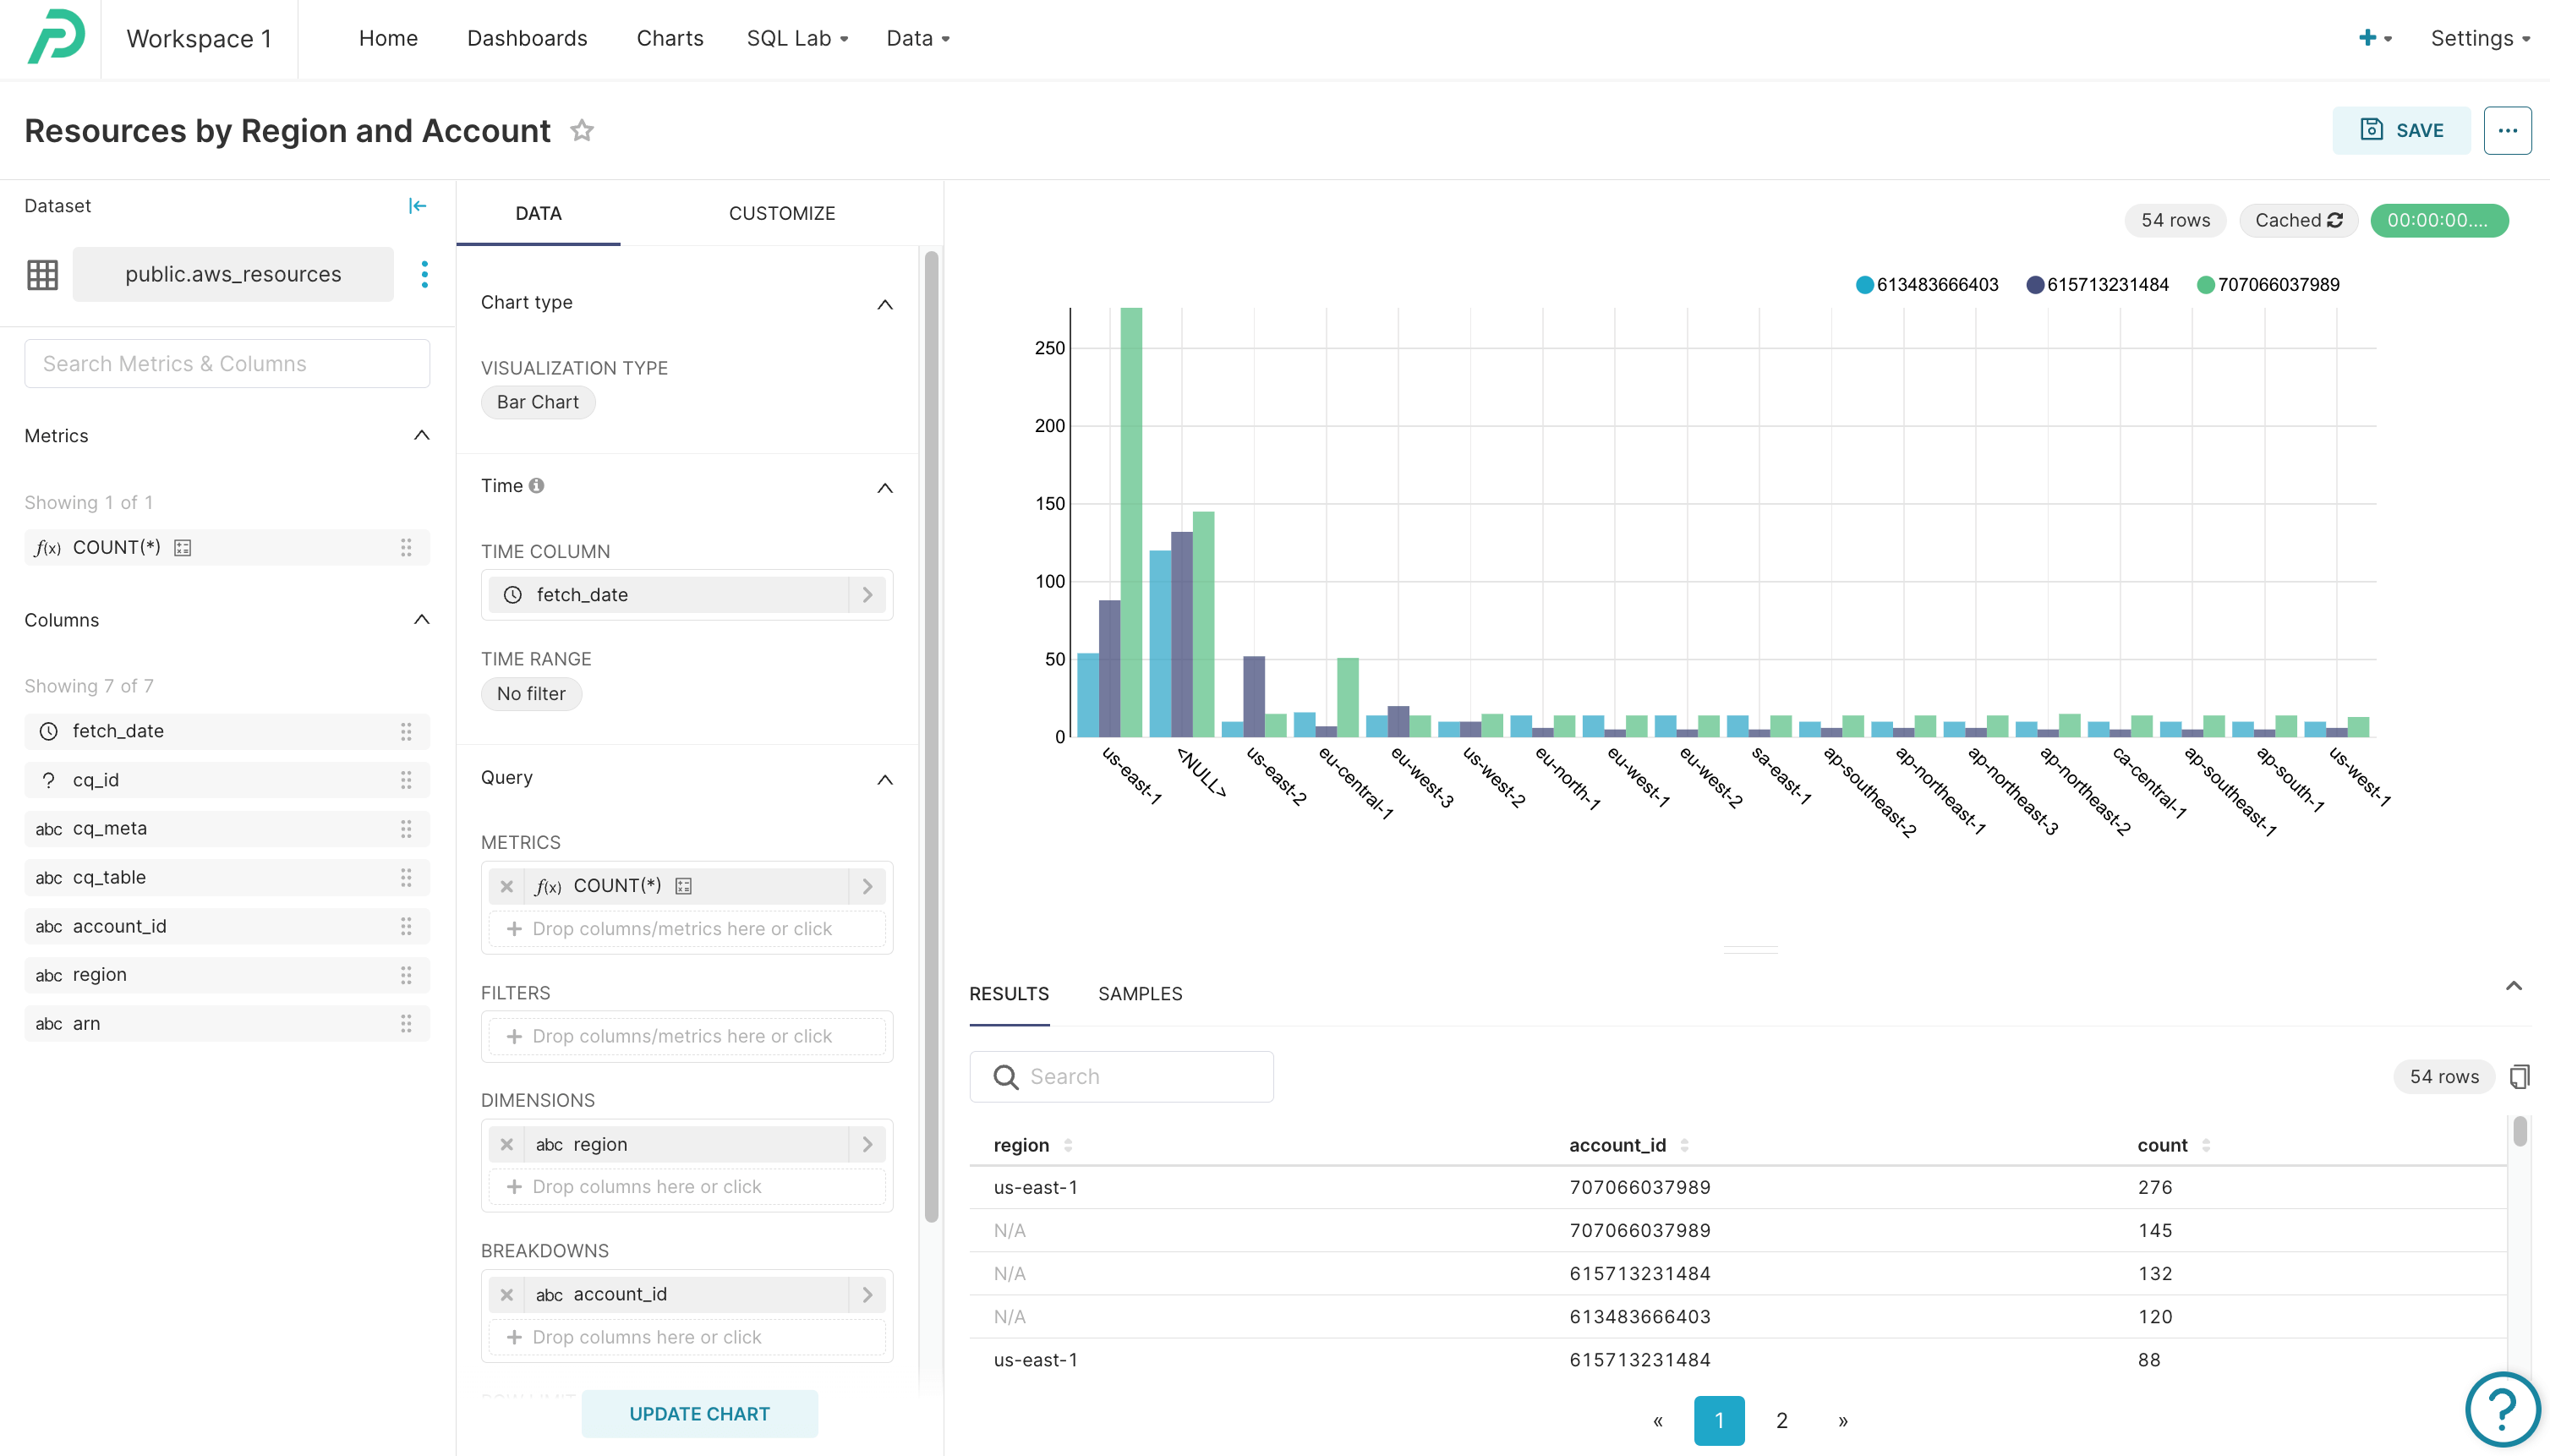
Now you are ready to create your first chart on top of our AWS Resource View (also, see our blog)! Choose the dataset you created in the last step (in this case aws_resources) and choose the chart type you want to create (we will take the Bar Chart but you can also change this in the chart screen).
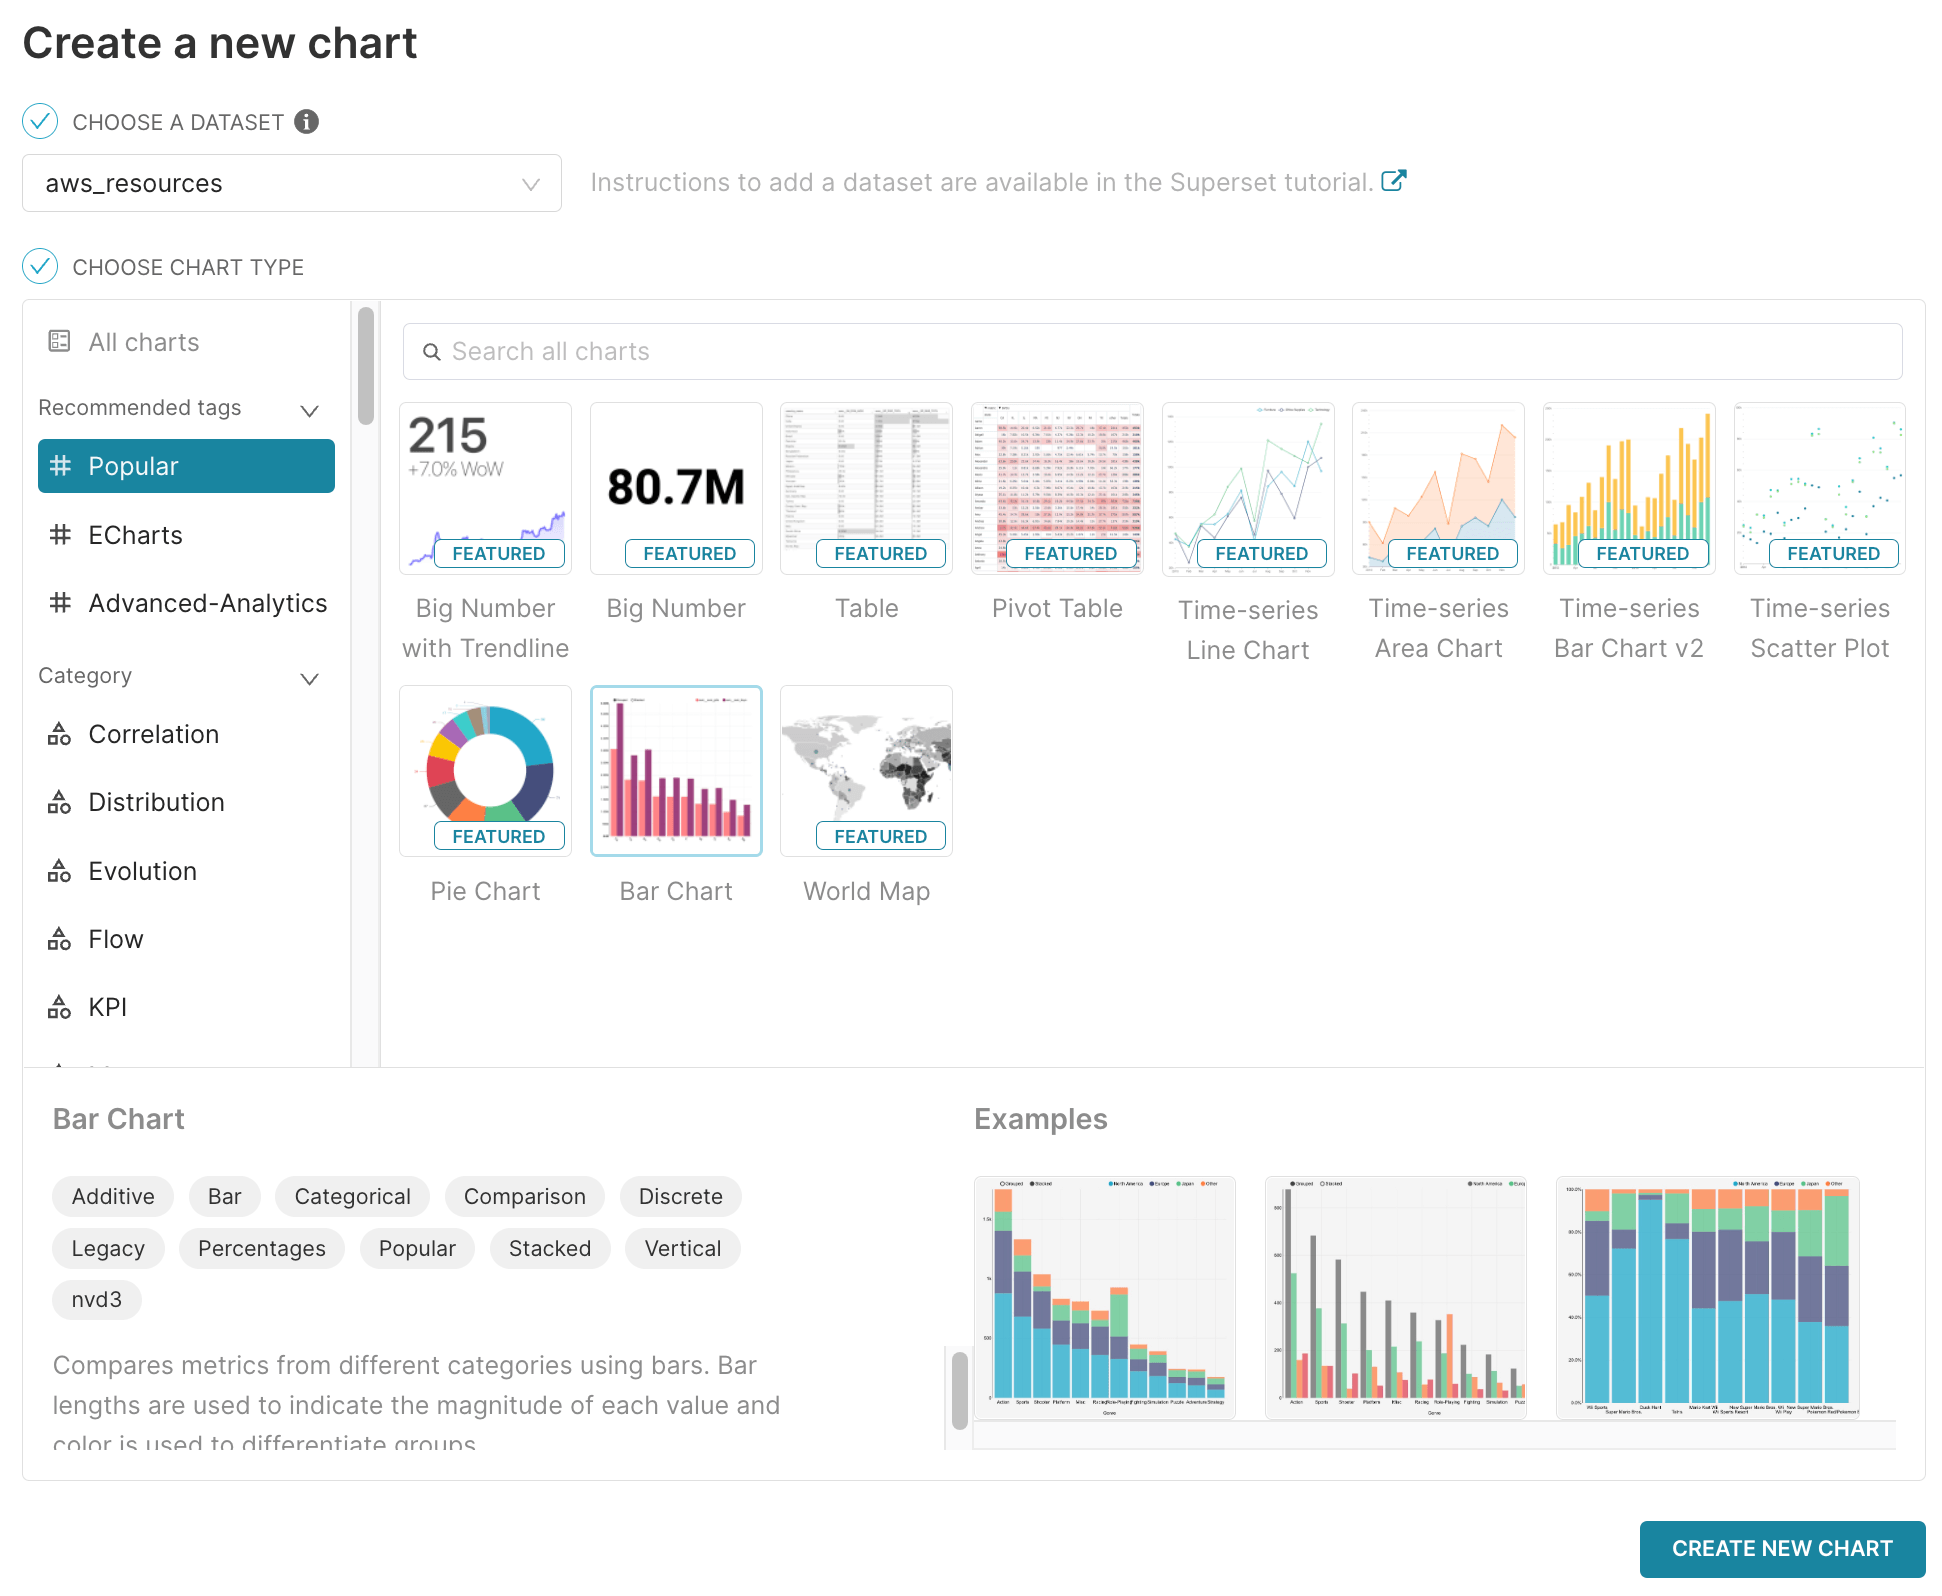
If you are familiar with the Superset UI this step is pretty easy where you just choose or drag and drop the columns you want to visualize (and you can always revert to plain SQL if needed).
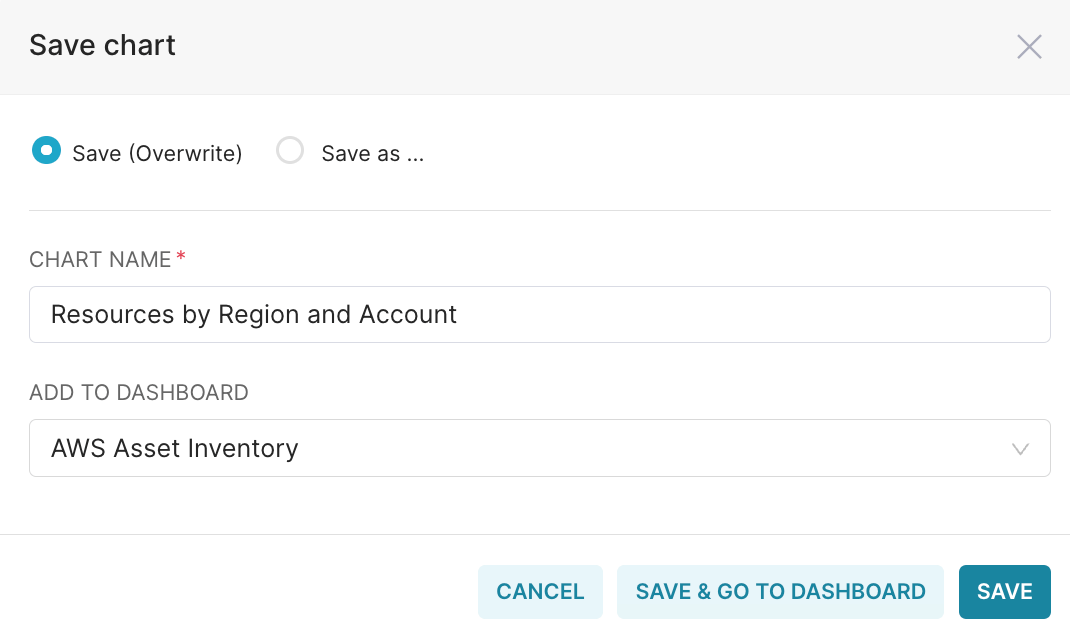
Step 6: Save and Add to Dashboard
Click Save and choose the Dashboard you want to add the chart (or create a new one if you don’t have one) and then click Save again or Save & Go to Dashboard
You can now repeat steps 4-5 or 3-5 to create all charts you need and add them to your dashboard/s.
Step 7: Edit Dashboard, Add Filters and Share and Alerts
Now we are at the final stage where you can edit, resize and tweak the charts/widgets so it looks something like this:
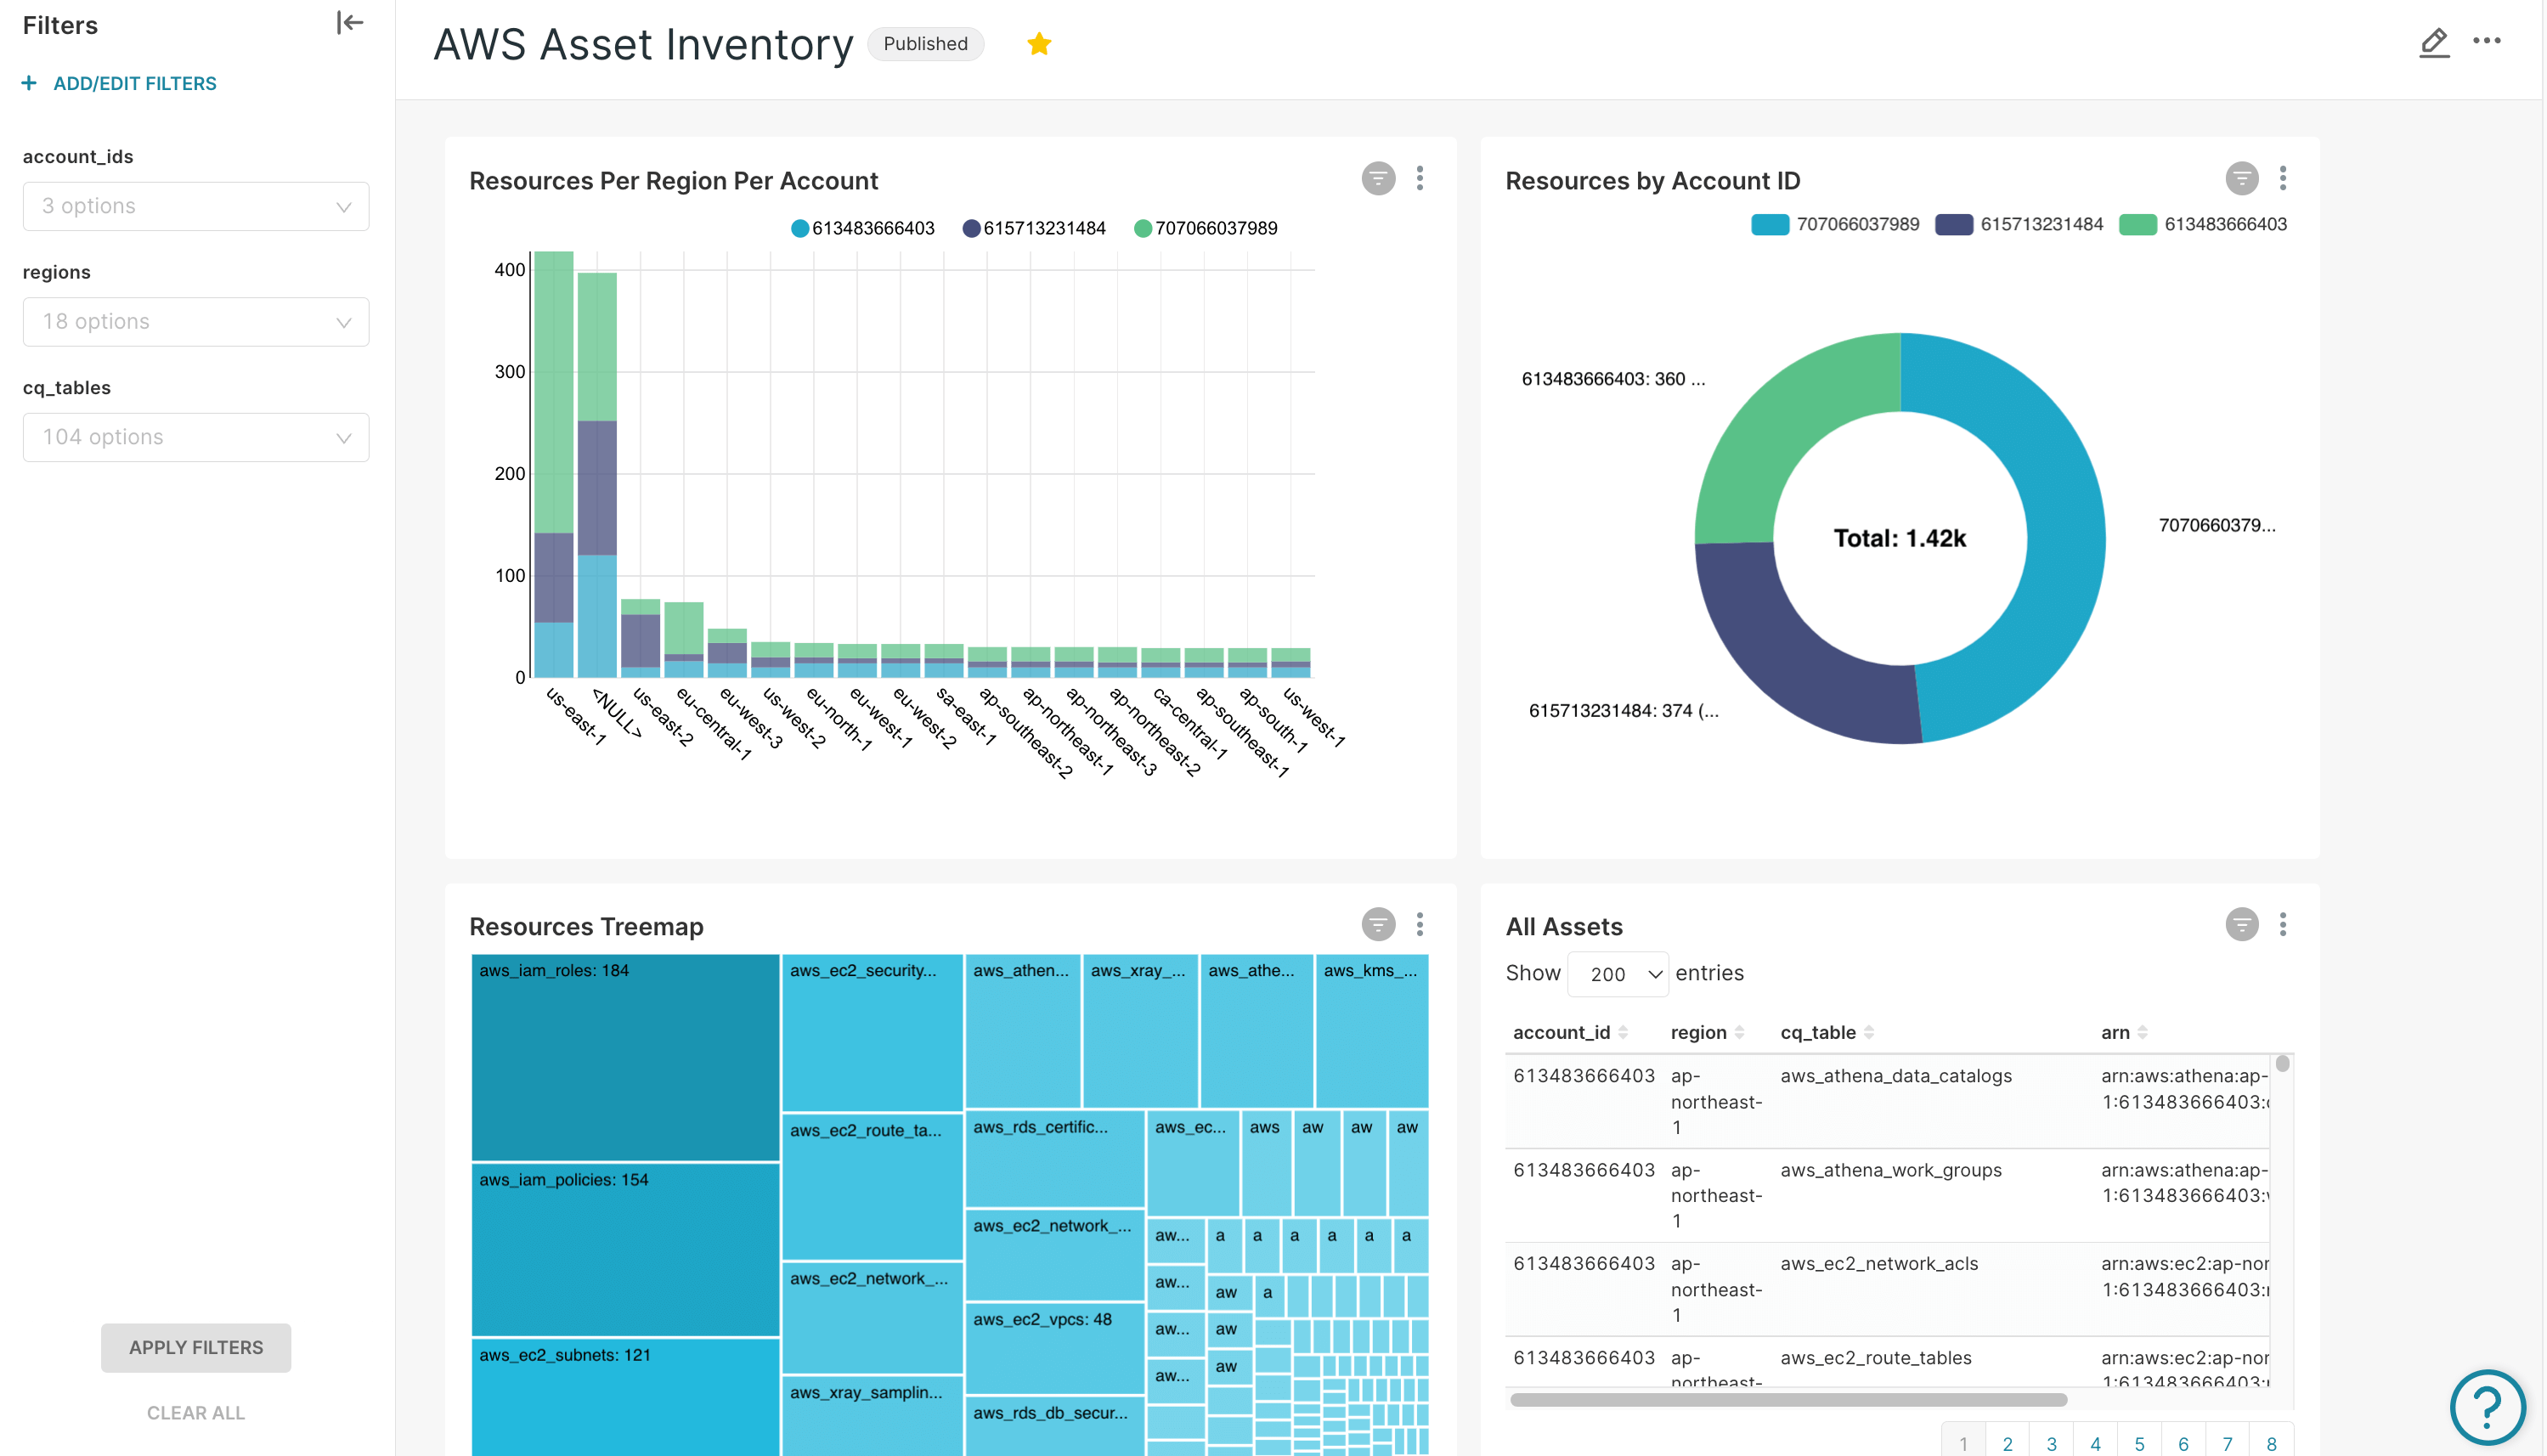
You can add Filters to make the dashboard more interactive and you can now share this with other team members, send links, image of dashboards as well as periodic alerts and reports via Superset.
Summary
In this post we showed you how to build an open-source cloud asset inventory with CloudQuery as the ETL (Extract-Transform-Load) / data-ingestion layer and Apache Superset as the visualization and monitoring platforms. This approach eliminates the yet-another-dashboard fatigue and gives you the ability to pick the best-in-class visualization tools or reuse your current stack.
