
The Data Engineer's Guide to Lightning-Fast Apache Superset Dashboards
One of the most common complaints people have after using a business intelligence (BI) tool for a while is that “dashboards are slow.” No matter how beautiful and well constructed a dashboard is, or how well presented the information is, if the charts take minutes to load the dashboard becomes useless. In fact, according to research conducted by IBM in the '60s, human users become impatient if they have to wait more than π (3.14) seconds for a response from an interactive computer system — a unit jokingly described as a nanocentury.
How can we achieve those speeds? Is it really possible to make dashboards load in less than four seconds when we’re looking at metrics computed from millions or billions of rows? To understand how we can obtain those results, first let’s take a look at the lifecycle of a dashboard, starting from the initial SQL queries that power charts.
The lifecycle of a dashboard
Data visualization usually starts with an exploratory phase, where the user is still unsure of what information they want to present. Imagine a table orders with records of all the products sold by a given company. A data analyst might start by looking at the overall volume of sales by running the following query:
SELECT SUM(totalprice) AS sales FROM orders;The query above is a good start, but it’s a very top-level view of the metric. It doesn’t even tell us if sales are going up or down, so we might want to create a timeseries to look at trends in the metric:
SELECT
  DATE_TRUNC('day', orderdate) AS order_day,
  SUM(totalprice) AS sales,
  COUNT(*) AS cnt
FROM orders
GROUP BY 1
ORDER BY 1;
This new query now gives us two daily metrics: the total value of sales, and the number of sales. But while more useful than the first query, this second query is still not very actionable. If sales are trending up or down we will probably want to understand why that is happening — is it a particular country, a specific interface (Android, for example), an age bracket? Being able to slice-and-dice the metrics across multiple dimensions will allow us a better understanding of what’s going on in our business.
We can do that by bringing in some additional dimensions to the query:
SELECT
  -- dimensions:
  DATE_TRUNC('day', orderdate) AS order_day,
  customer.mktsegment,
  nation.name AS country,
  -- metrics:
  SUM(totalprice) AS sales,
  COUNT(*) AS cnt
FROM orders
JOIN customer ON orders.custkey = customer.custkey
JOIN nation ON customer.nationkey = nation.nationkey
GROUP BY 1, 2, 3
ORDER BY 1;
The query above is much better: it has a couple metrics (sales, cnt) and a few dimensions (order_day, mktsegment, country), allowing us to build a dashboard that shows the metrics over time and by each of the selected dimensions. In the real world we might want to bring in even more metrics and dimensions, since we would try to anticipate the needs of anyone using the dataset in the near future. In fact, it’s not uncommon to have denormalized tables with hundreds of columns, for this exact reason.
Let’s prepare the data so we can build an Apache Superset dashboard where users can slice-and-dice the sales data.
Building the dashboard
In order to build the dashboard we should first have some data. In this blog post we’re going to use Trino as a virtual data warehouse. We can spin it up very quickly using this minimal docker-compose.yml file:
# docker-compose.yml
version: "3.9"
services:
  trino:
    ports:
      - "8080:8080"
    image: "trinodb/trino:455"
    volumes:
      - ./docker/trino/etc:/usr/lib/trino/etc:ro
      - ./docker/trino/catalog:/etc/trino/catalog
(All the files used in this blog post are available in the repository https://github.com/preset-io/dashboard-optimization.)
We can start it with:
docker compose upTo connect Superset to it we use the following SQLAlchemy URI:
trino://user@localhost:8080/tpchNote that we’re connecting to the tpch catalog, from the TPC-H benchmark — a standard benchmark for decision support systems and includes several tables that model a simplified business scenario. The catalog has multiple schemas of increasing size: the sf1 (scale factor 1) schema represents approximately 1GB of data, while the sf1000 schema has the same tables with approximately 1000x more data (with the exception of the nation and region tables). The data is synthetic and generated on the fly.
In this blog post we’ll use the sf100 schema, since it has enough data so that performance becomes a problem, but not too much so we can still run in a personal laptop. Anyone following along can adjust the schema, depending on the computational power of their systems.
Creating a dataset
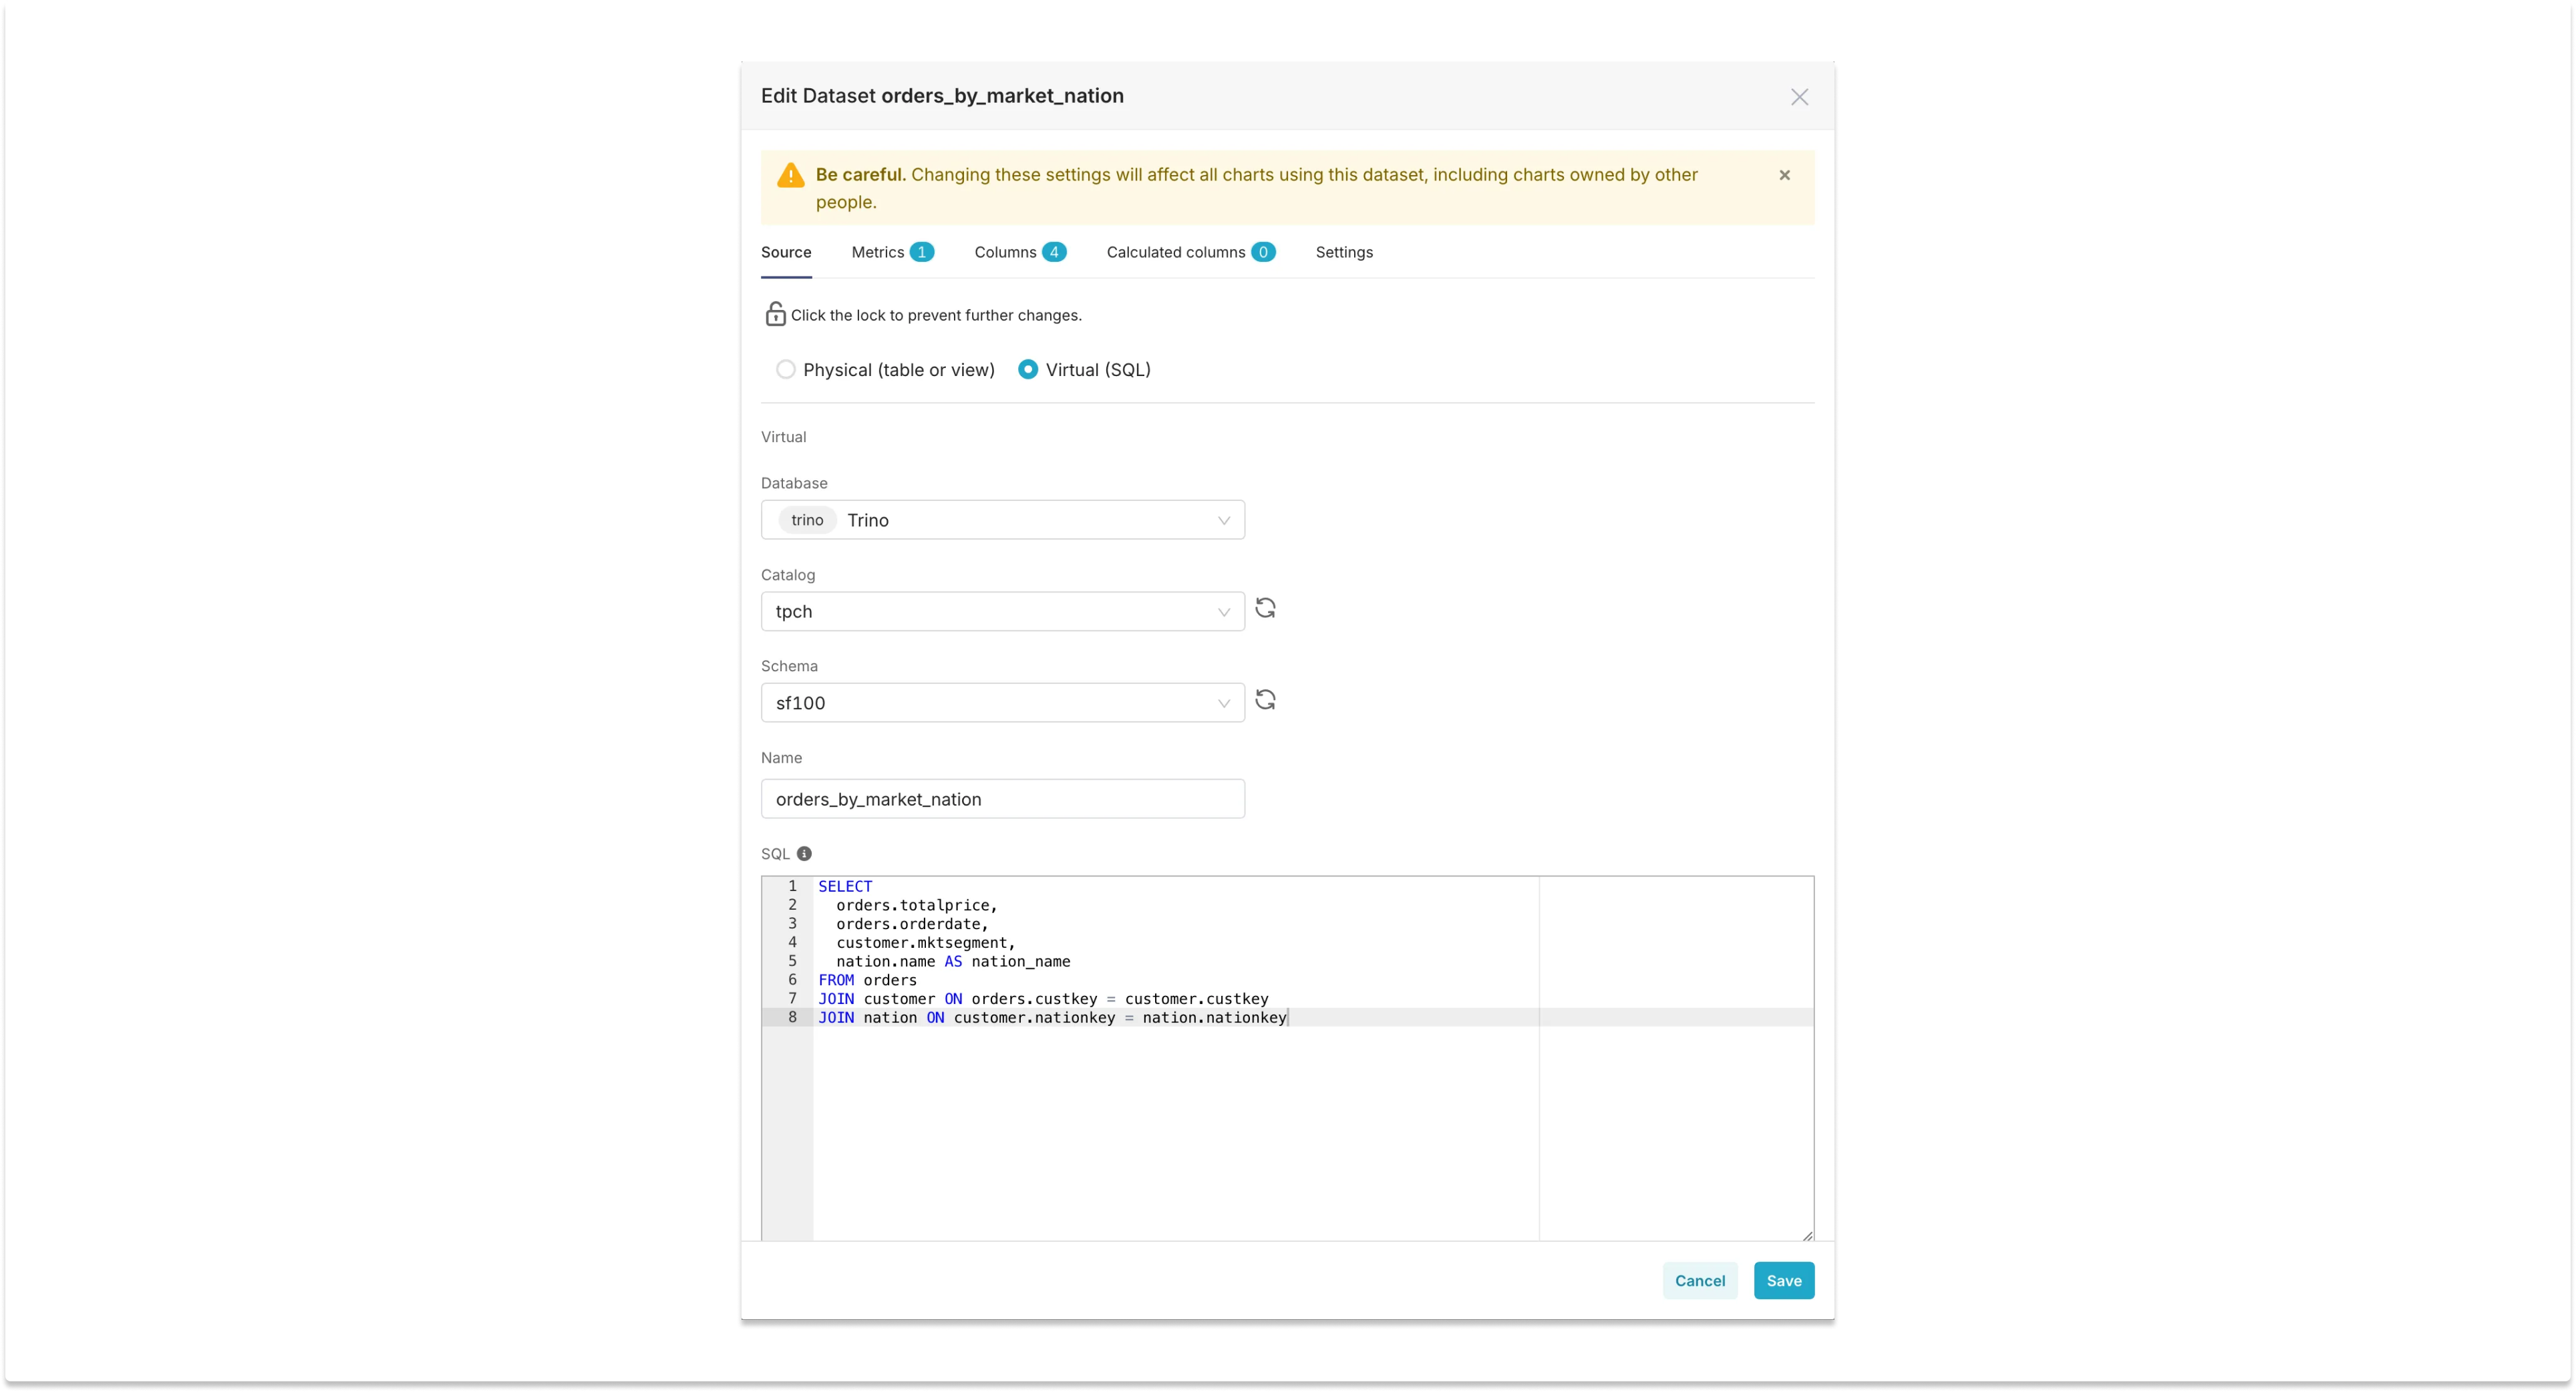
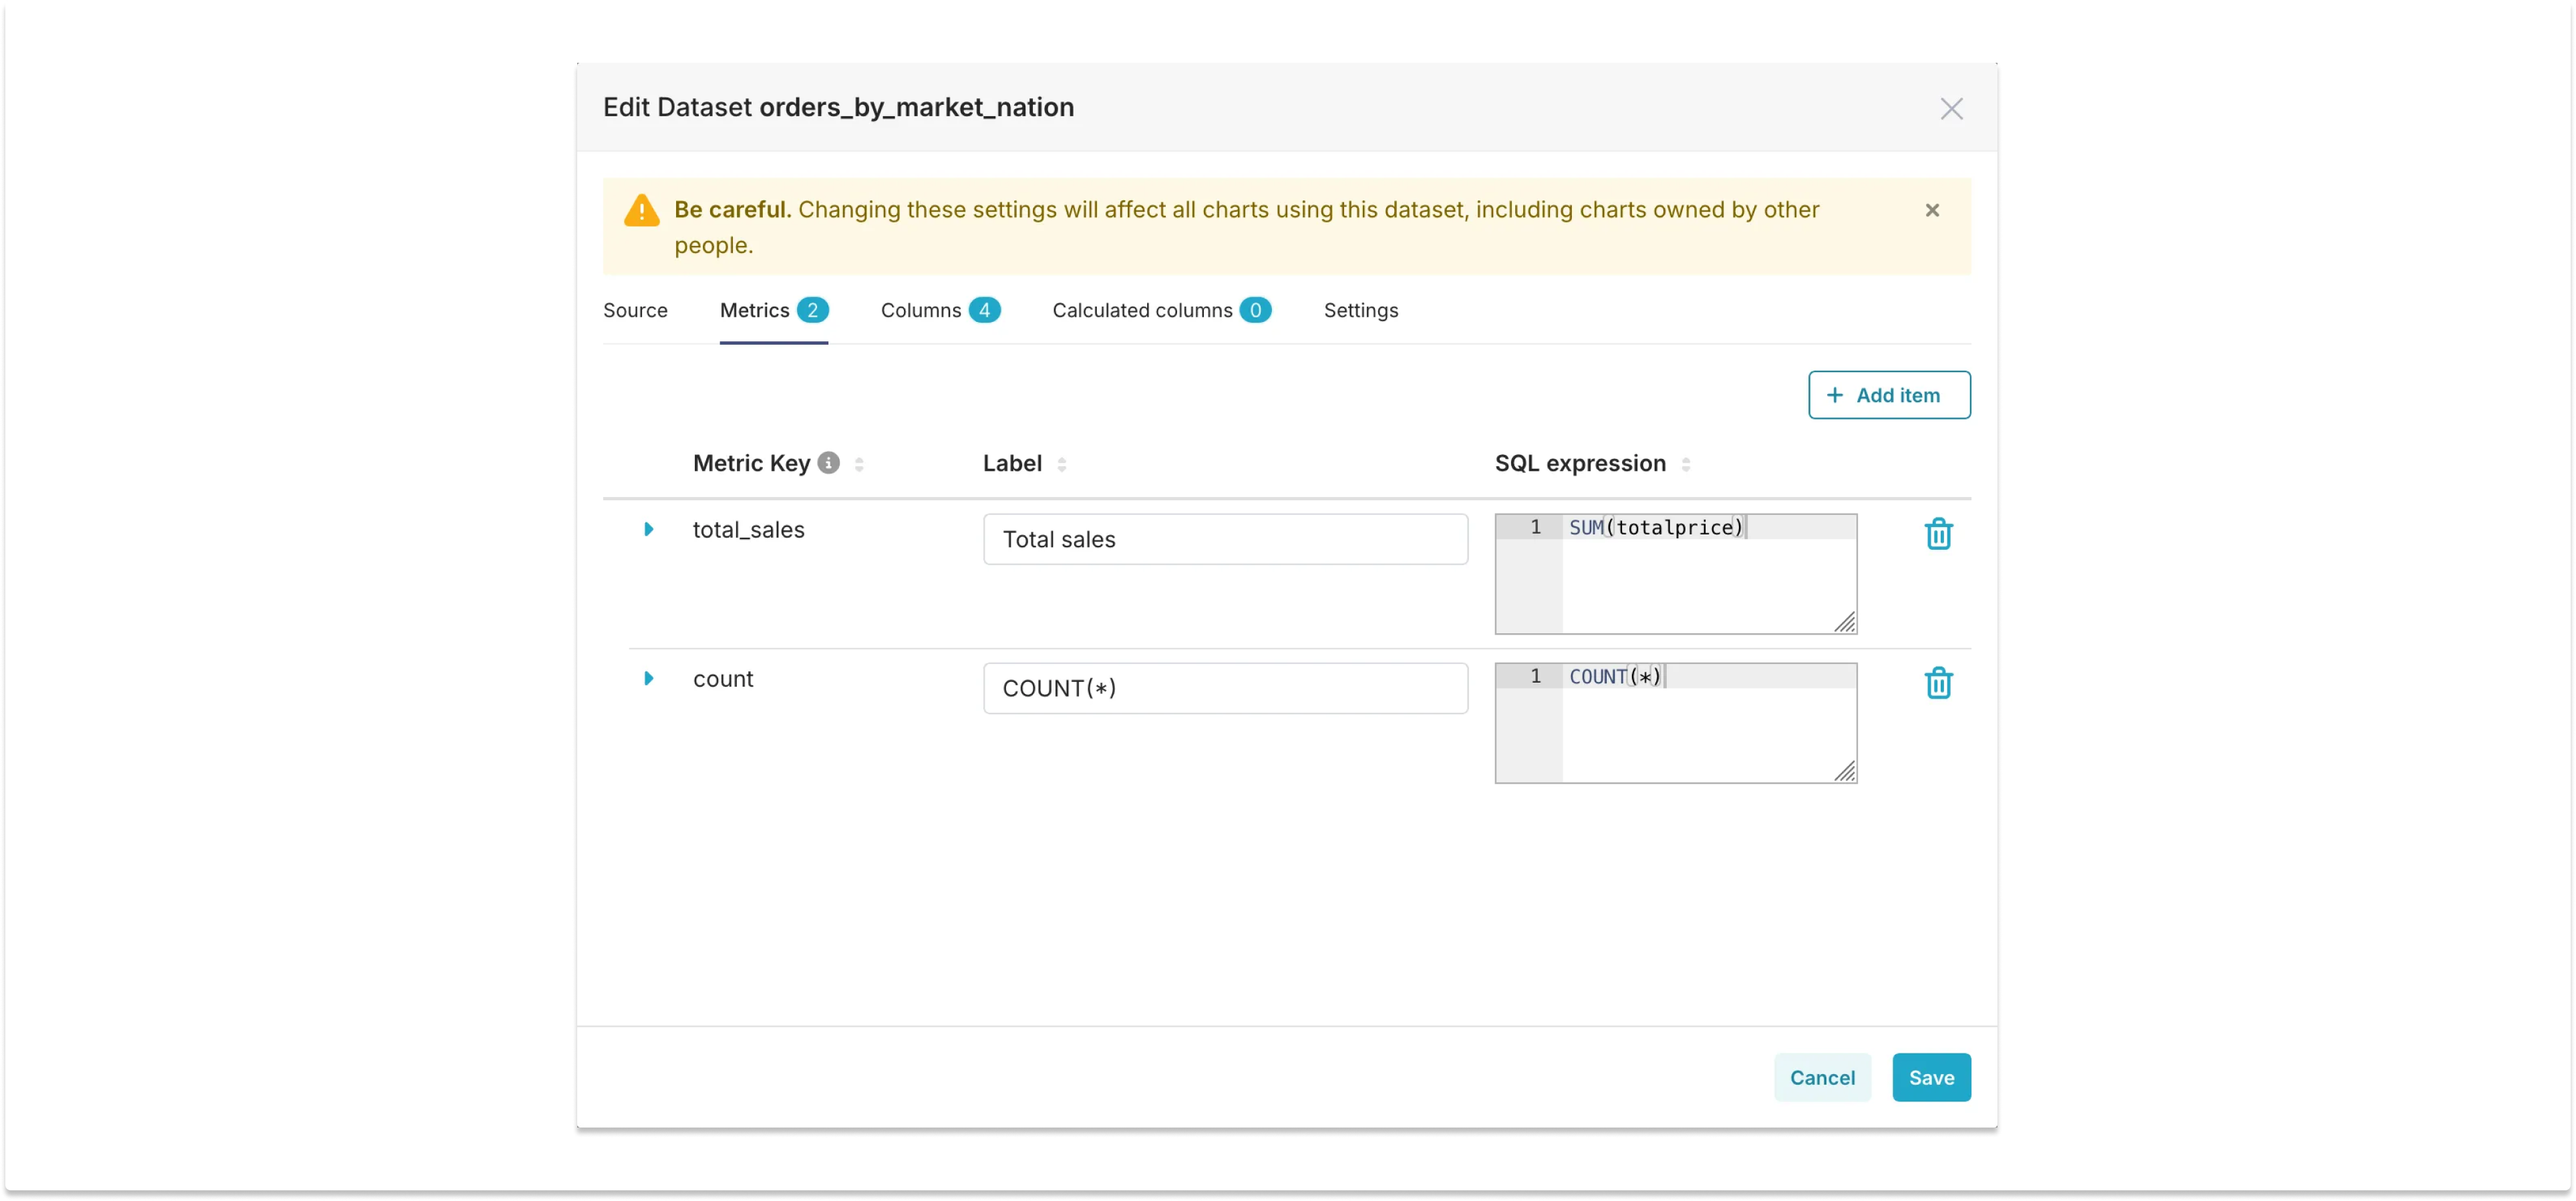
To build charts from the metrics and dimensions above we can create a virtual dataset in Superset. The virtual dataset will perform the join between the fact table and the dimension tables, and we can later add the metrics as SQL expressions to it. This way there are no aggregations in the SQL of the virtual dataset, since they are performed by Superset’s chart builder.
Here is how the query definition looks like for a dataset called orders_by_market_nation:
And the metrics (COUNT(*) is the default metric, so we only need to add total_sales):
Creating the chart
Now that we have our data, let’s build a timeseries of quarterly sales. We can do that by simply drag-n-dropping the total_sales metric we created, and setting the X axis to order_date, with a Time Grain of “Quarter”:
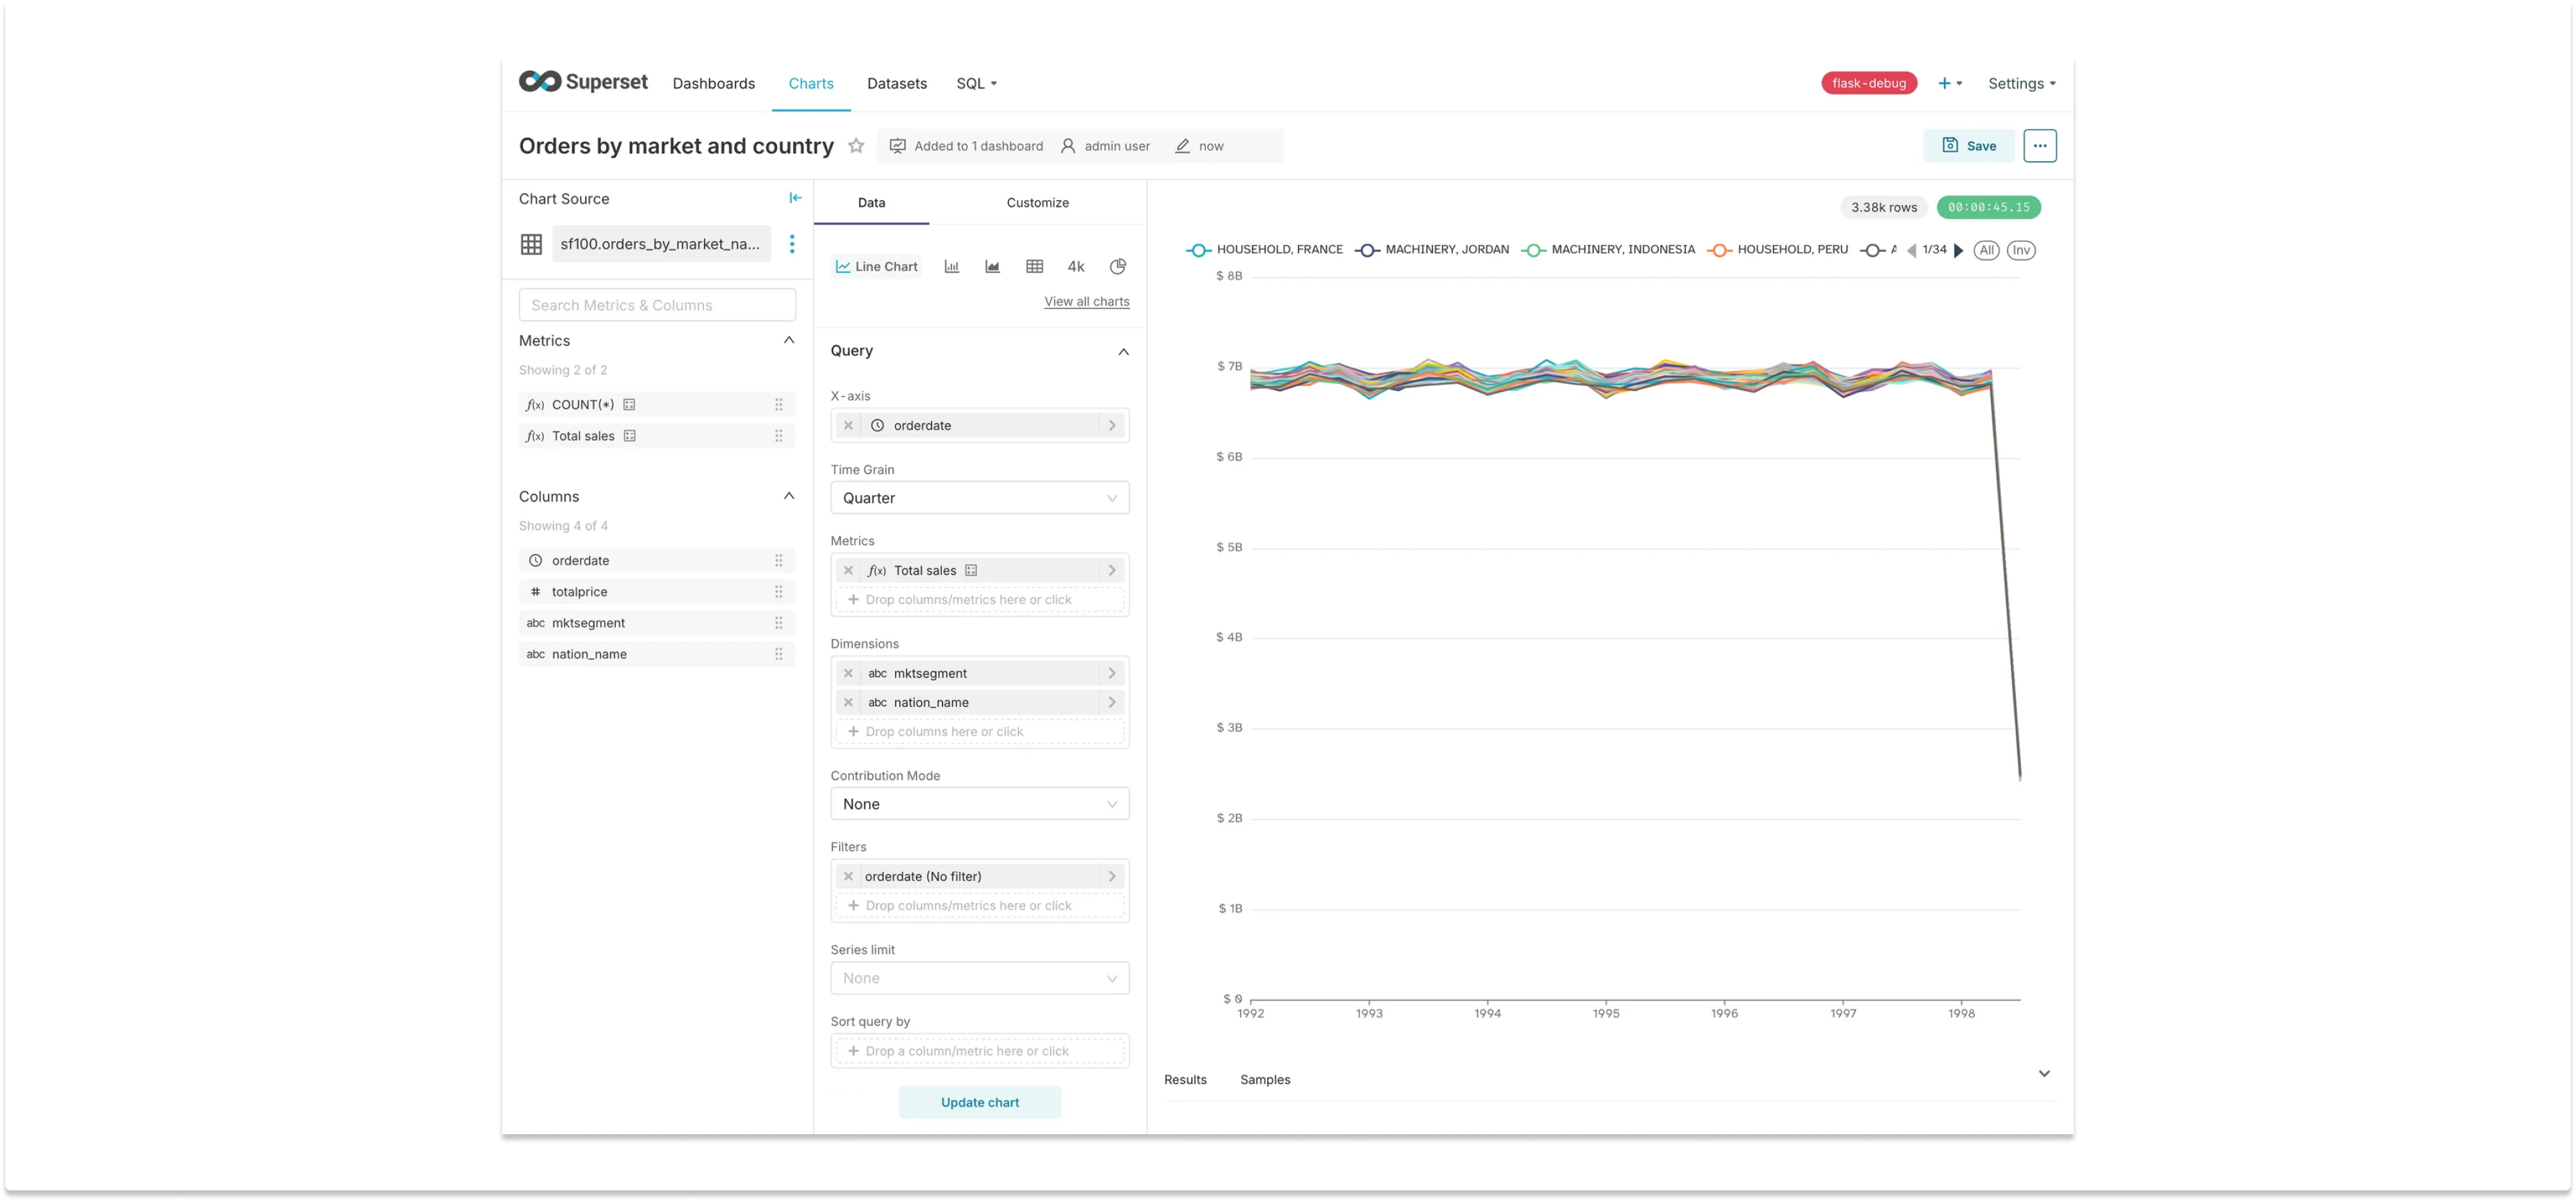
The chart doesn’t look very interesting because the data is synthetic. The important thing to notice is that the query took more than 45 seconds to run, very close to the default timeout limit of 1 minute that Superset has. If our datasets were slightly bigger (using the sf1000 schema instead of the sf100 schema, for example), the chart would definitely timeout. Even in the sf100 schema, if we build a dashboard that loads multiple charts from this dataset it will likely result in timeouts.
Improving performance
How can we make our chart load faster? Let’s look at a few common strategies for improving the performance of queries to make dashboards faster, as well as their pros and cons.
Query and storage optimization
The first thing that should be considered is optimizing the storage and the queries: are the proper indexes and partitions in place, is it possible to avoid expensive joins, are predicates pushed down to inner queries?
Execution time is often a direct factor of table-scan time, and one of the primary ways to reduce scans is by picking the right partition key. By aligning the partition key with time predicates, you can enable partition pruning and improve query performance. This is especially important when the dashboard’s filtering aligns with the partitioning strategy. Ensuring that your partitioning matches your most common query patterns will help you avoid unnecessary full-table scans.
Columnar formats, such as Parquet, offer another optimization by enabling more efficient scans. These formats store data column by column, which means that queries can avoid reading unnecessary columns. This can significantly reduce the size of the scans and, consequently, improve performance for queries that only need a subset of the columns in a table. In this case, the query execution time becomes really a factor of the size of the column-specific scans.
Note that Superset is a tool used for data visualization, and it doesn’t make sense to have queries producing result sets that have more rows than the screen has pixels — there's almost never a good reason to bring tens of thousands of rows into a chart. Make sure queries are leveraging sorting and limiting. For charts that support it (most time series do) you can also use the “series limit” option to reduce the number of subgroups being visualized.
Caching
Superset implements its own caching layer, and by default it caches queries for 1 day. A different timeout can be specified at the database, schema, dataset, or chart level. Caching is a simple and efficient solution: once cached in Redis, the chart above that takes 45 seconds to load can be generated in 0.09 seconds — that’s 90 milliseconds, a 500x improvement! This must be the best solution for faster dashboards, right?
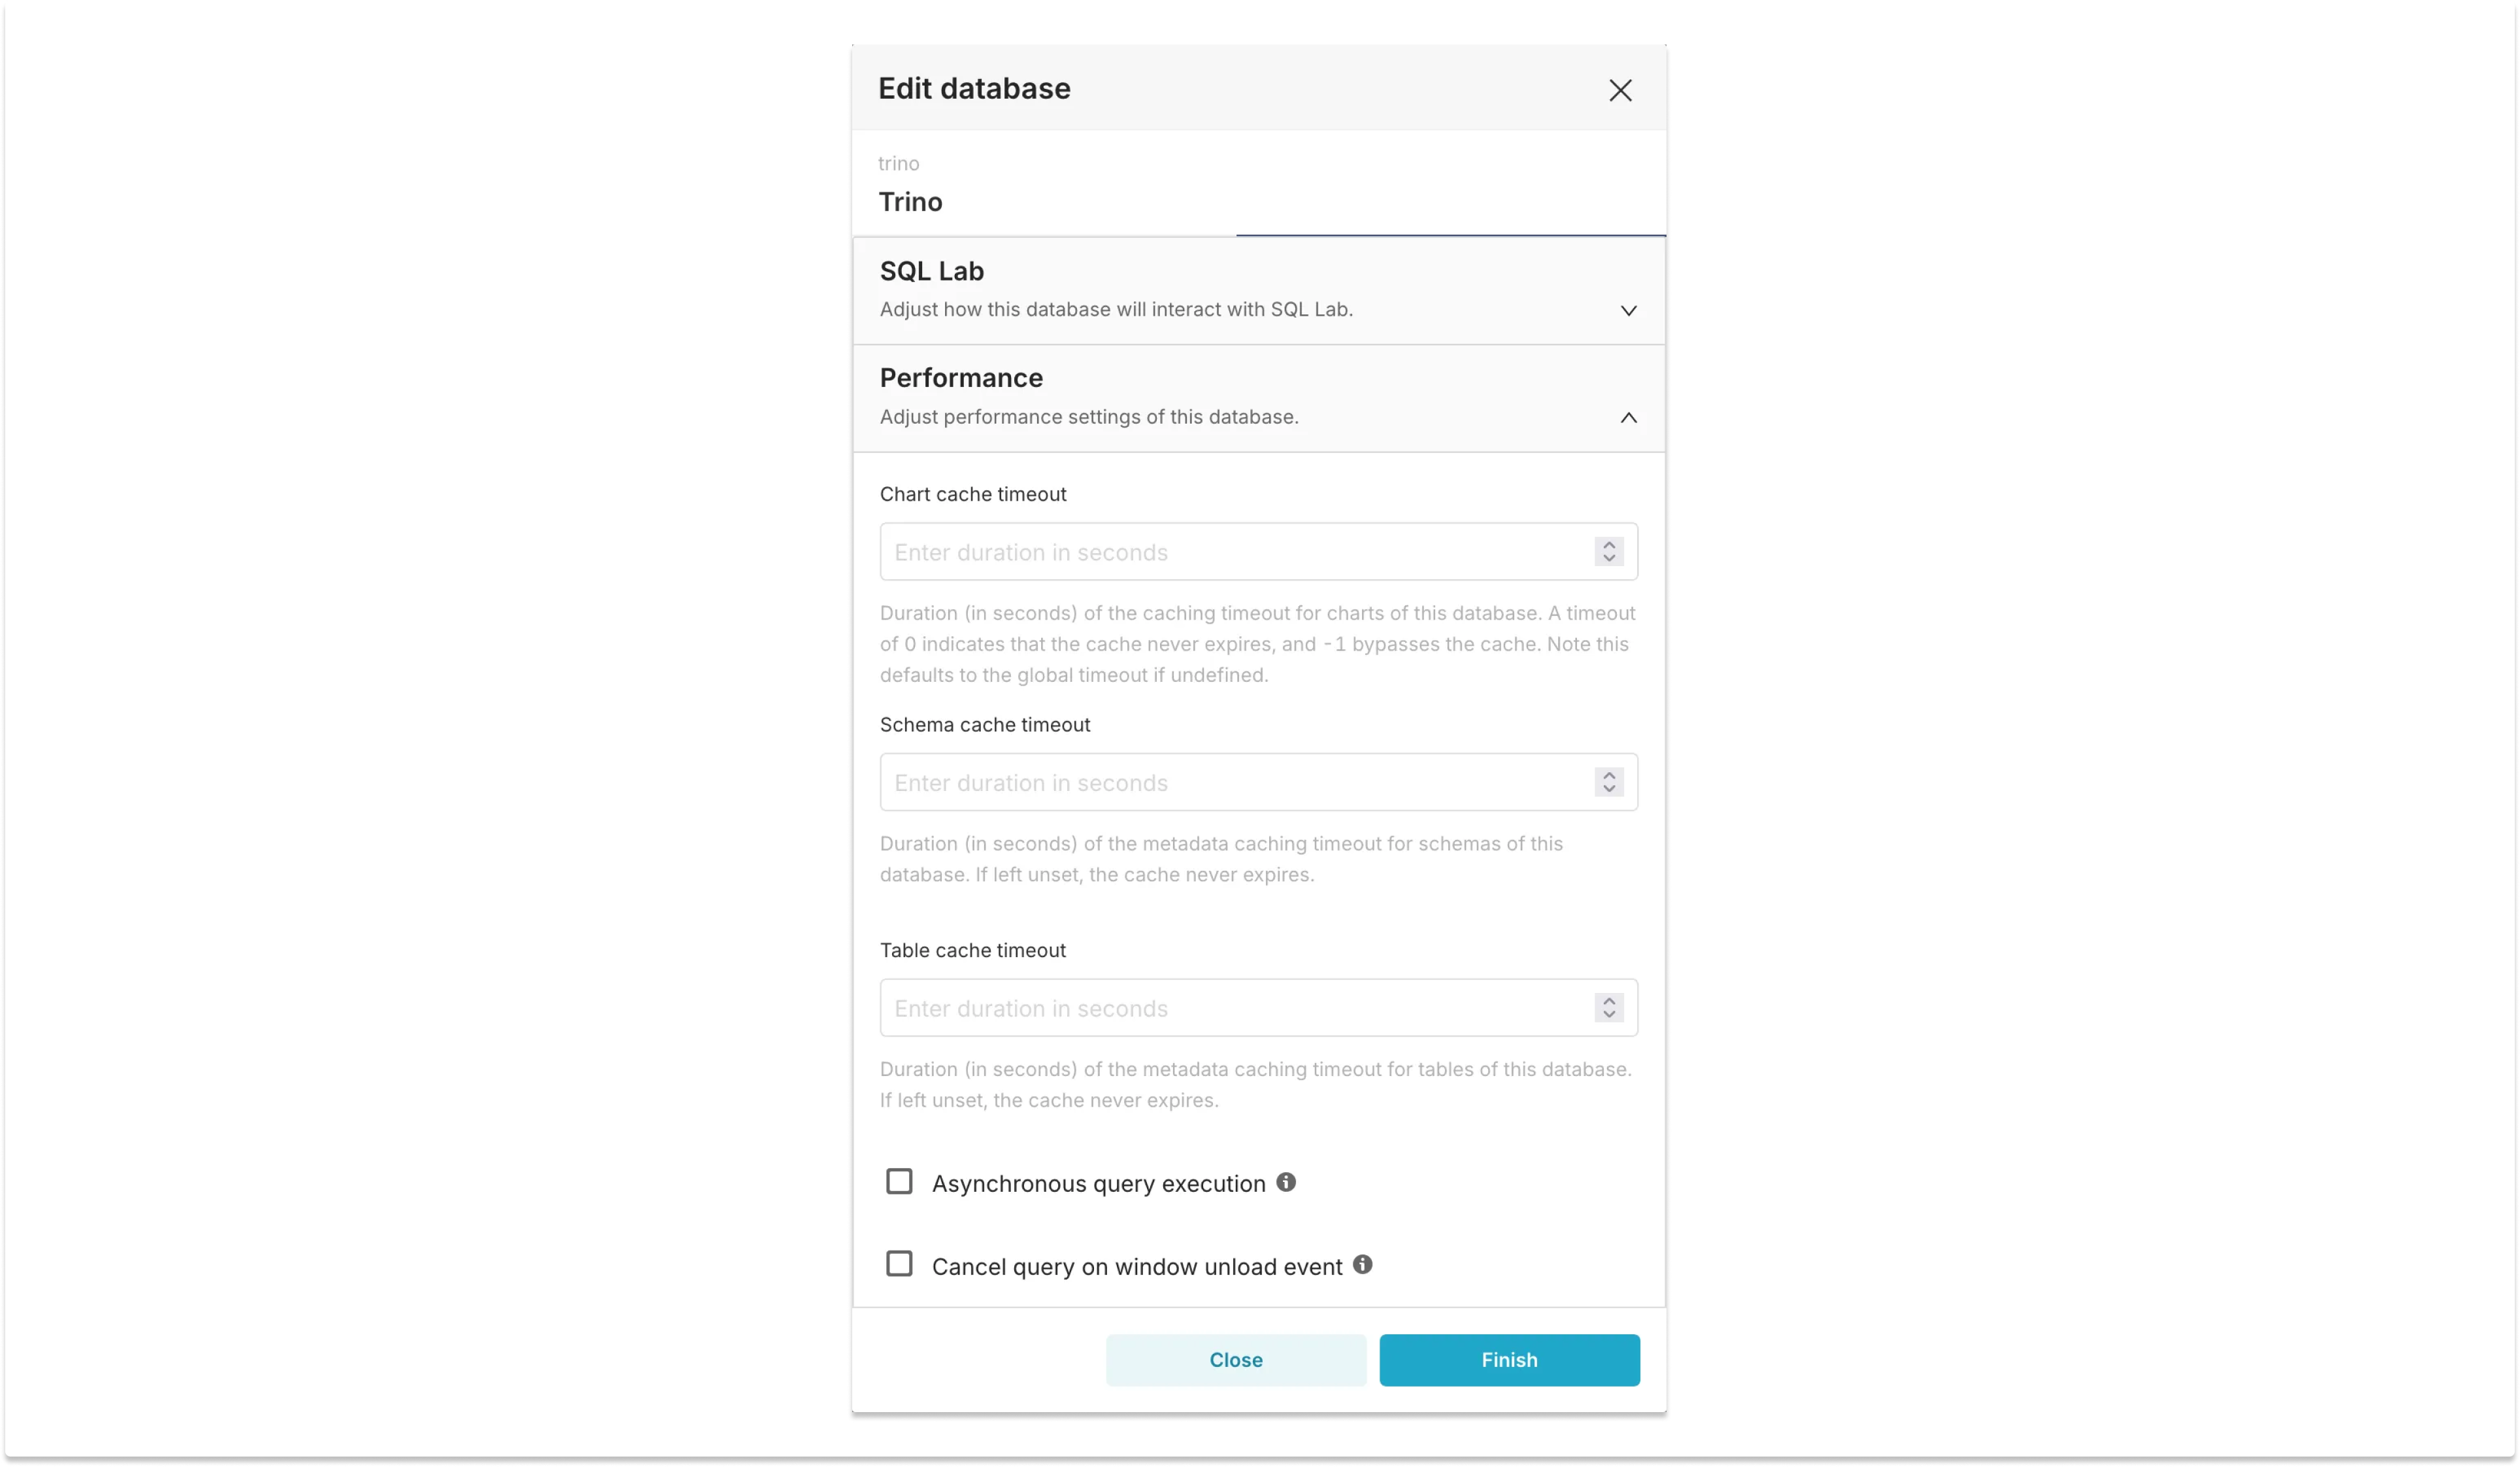
Database configuration, showing options related to performance, including different cache timeouts.
Well, not so fast (no pun intended). The following day, once the cache has expired, the chart will still take 45 seconds to load and, because the cache is not SQL-aware, queries with an additional filter will not hit the cache. For example, if somebody wants to look at sales only in Brazil, the chart will have to run the full query with the additional predicate, even though in theory the new results could be computed from the cache data.
And while dashboards have repeatable and predictable query patterns, Superset dashboards are very interactive, with additional dynamic filters that can be applied across multiple charts, as well as allowing users to drill-down the results or vary the time window. This interactivity results in ad-hoc queries that will more likely result in cache misses, making caches useful only for dashboards where the data is in the presentation stage — for example, a wall-mounted screen showing well-defined company metrics.
Sampling
Sampling is a technique were only a subset of the data is used for a query. It’s useful when only an approximate result is needed since, unless the data is completely homogeneous, sampling will introduce errors in the metrics.
To create a chart with sampling, first let’s create another virtual dataset, called orders_by_market_nation_sampled. The dataset will be defined by the following SQL query:
SELECT
  orders.totalprice,
  orders.orderdate,
  customer.mktsegment,
  nation.name AS nation_name
FROM orders TABLESAMPLE BERNOULLI (10)
JOIN customer TABLESAMPLE BERNOULLI (10) ON orders.custkey = customer.custkey
JOIN nation ON customer.nationkey = nation.nationkey
Here we're using the TABLESAMPLE clause, using the BERNOULLI method to randomly select approximately 10% of the rows from the orders and customer tables. A lower percentage can be used for faster, but less accurate, results.
Because of the sampling on both sides of the first JOIN the query should use 1% of the data, compared to the unsampled query. Note that applying sampling to joined tables independently (as we did here) means that some rows might not find their matching pairs after the join. This could potentially skew your results, especially for less common join keys.
Another important thing to consider is that additive metrics, like total_sales, need to be scaled accordingly. In this case, both metrics in the sampled dataset need to be multiplied by 100:
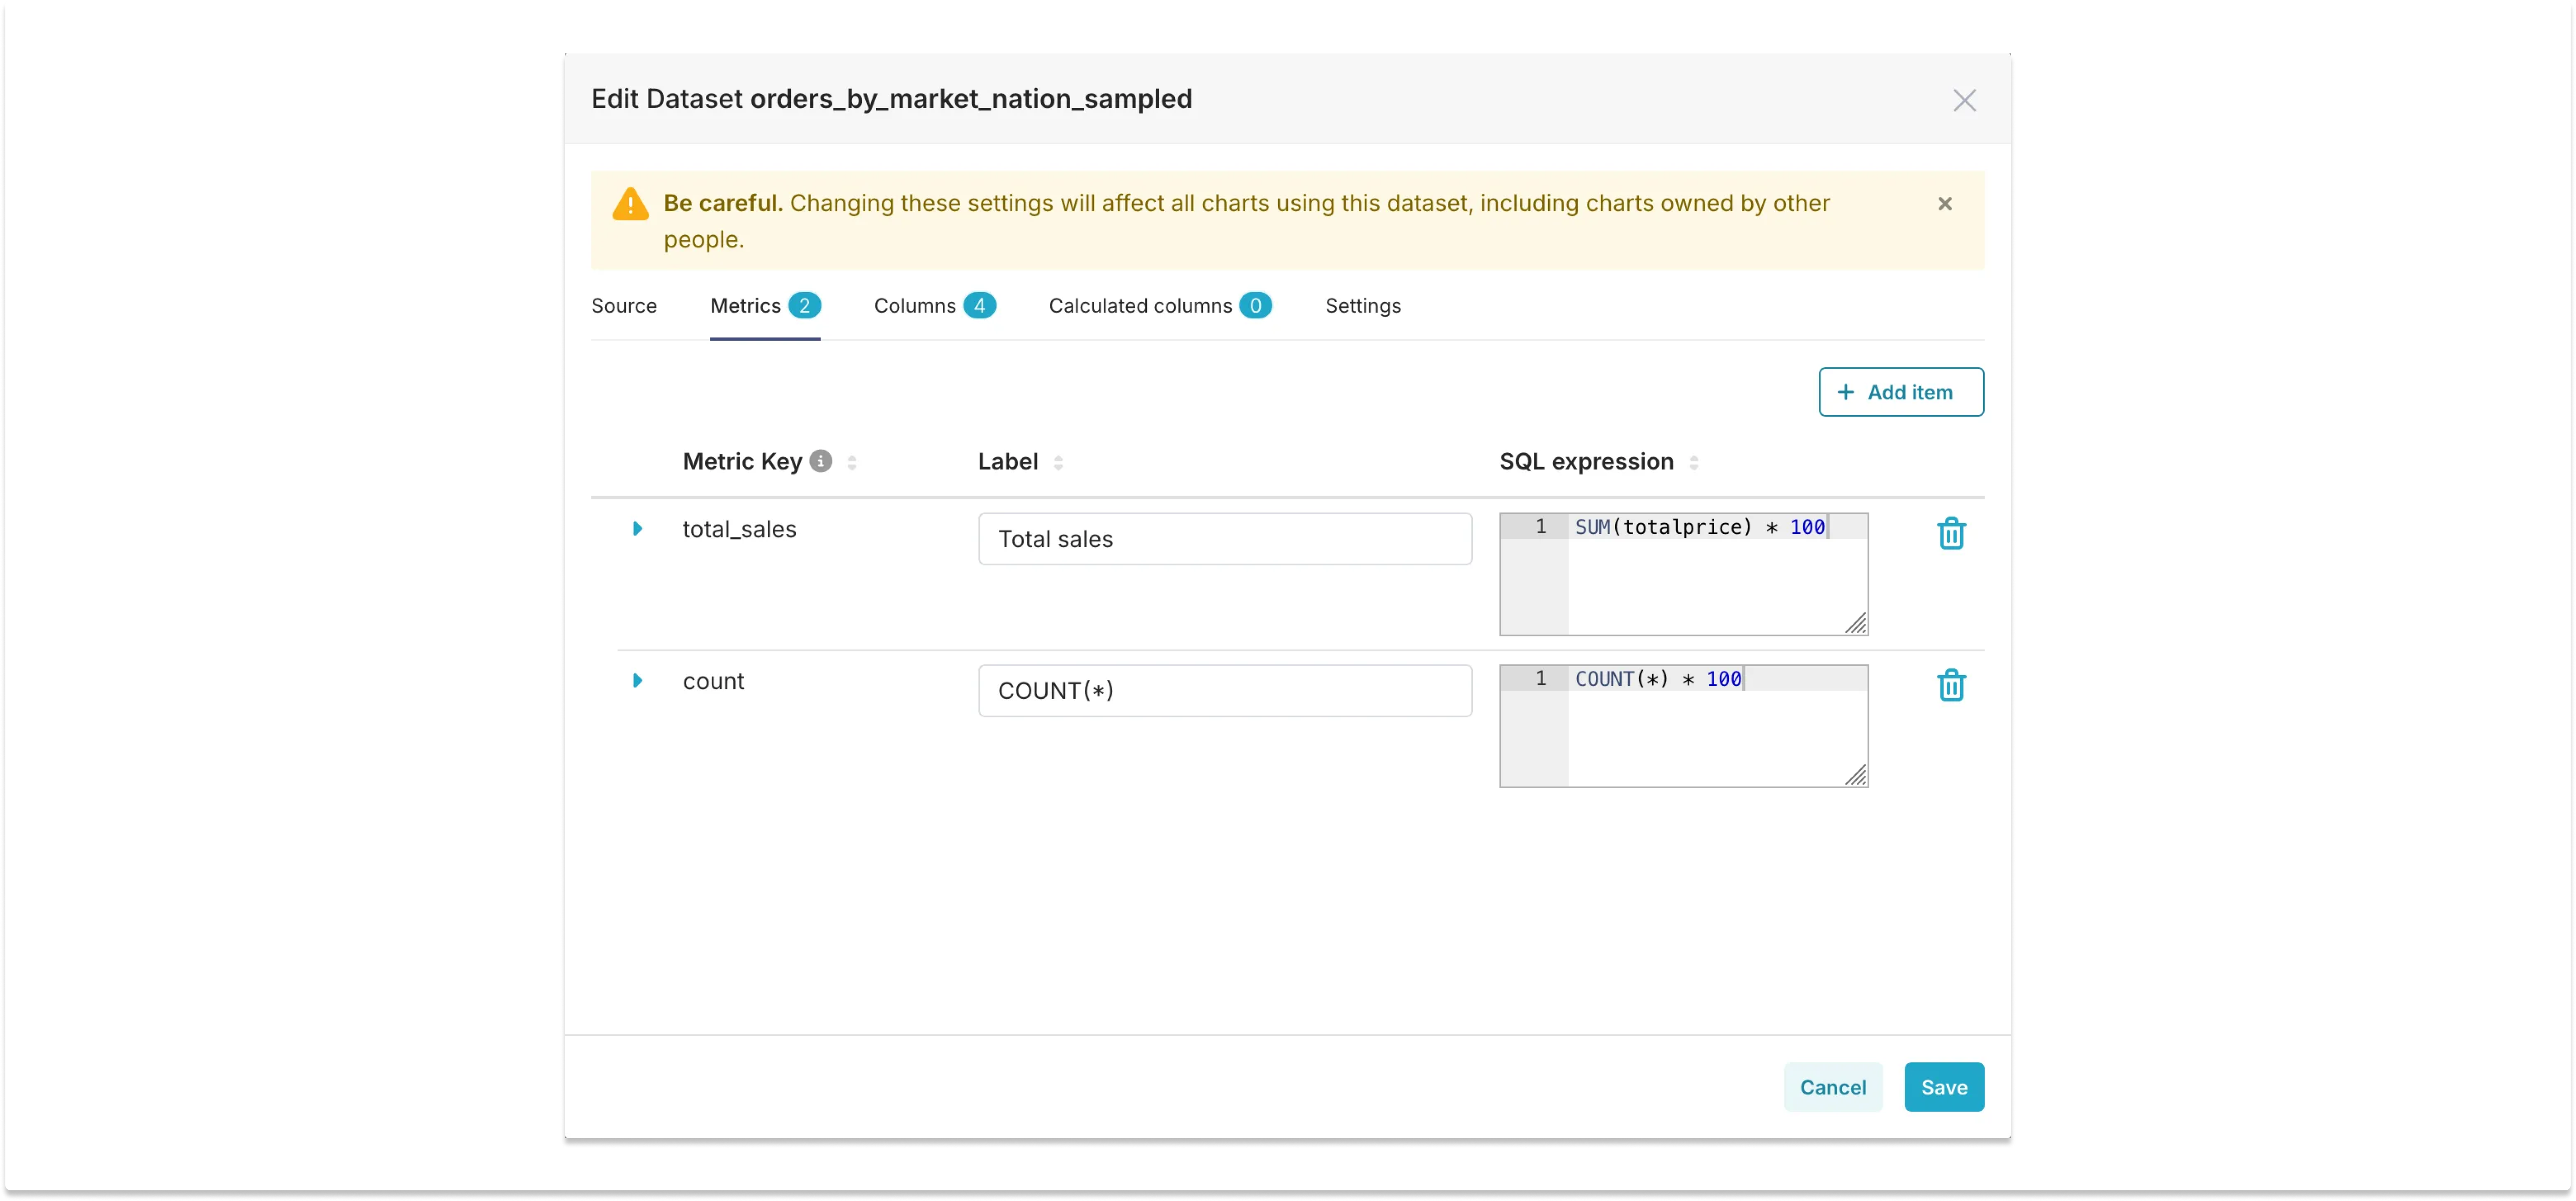
We can now generate the same chart for the sampled dataset:
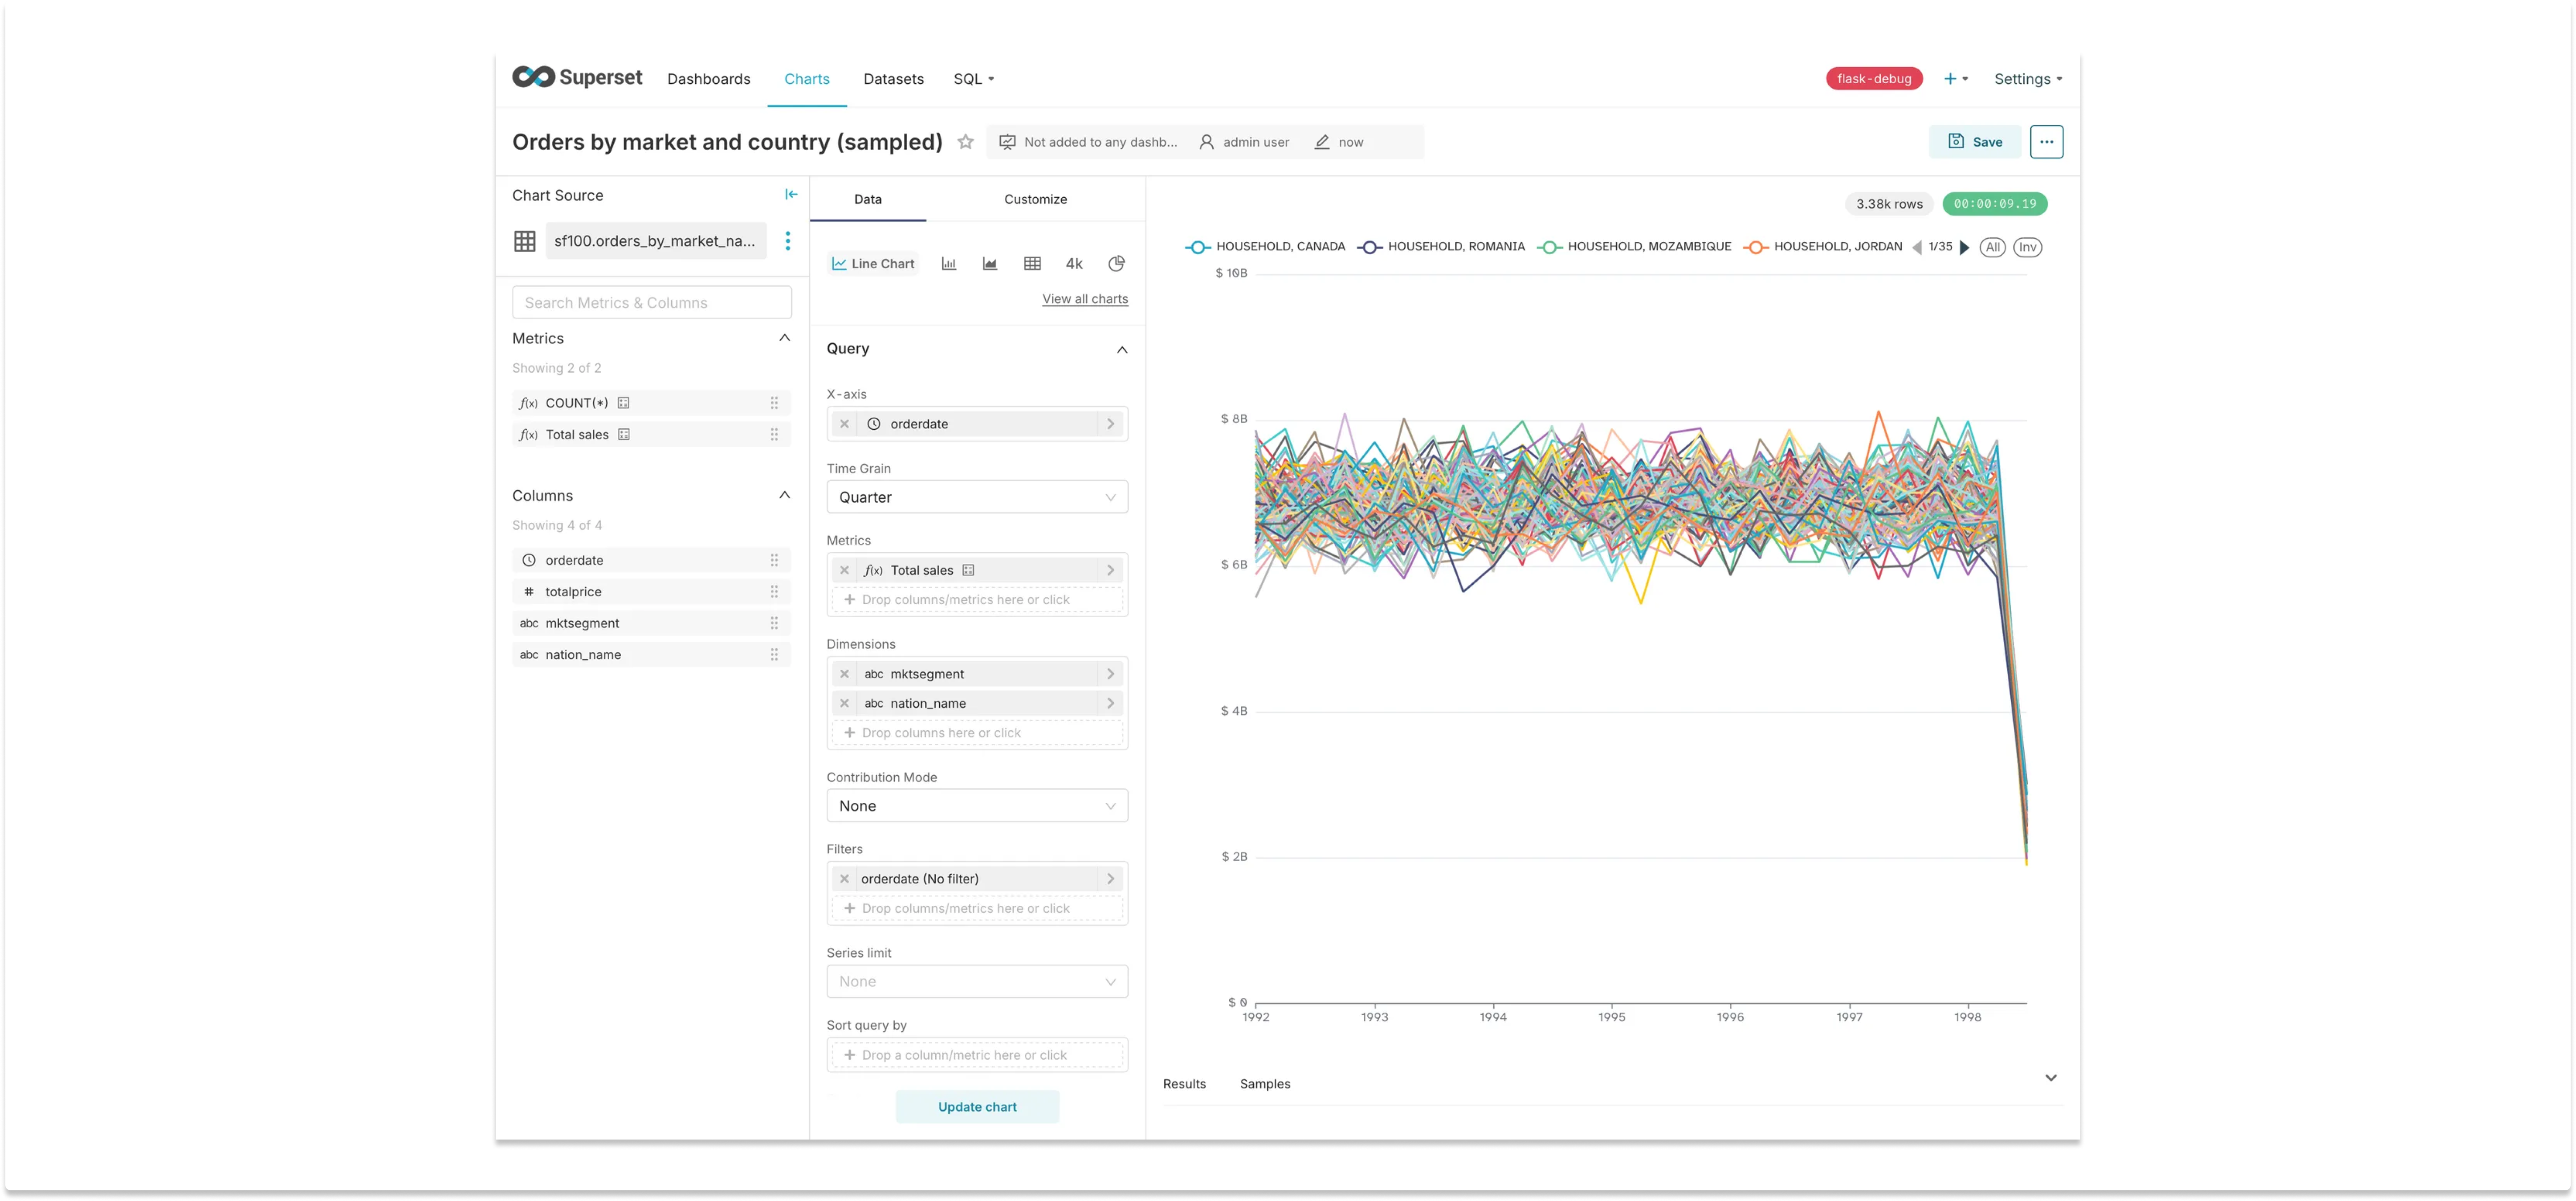
The results are not very impressive, to be honest: there’s much more noise in the metric (the standard deviation is much higher), and the chart is only approximately 3x faster, loading in 16 seconds. Nevertheless, sampling would bring the chart loading time away from the 1 minute default limit, making it much less likely to timeout at peak times. So, if approximate results are OK, this is a quick and easy solution that will help in many cases — even if not approved by the IBM research team.
Precomputing aggregations
One problem with all the solutions above is that the queries they need to run are highly inefficient.
The chart we created shows a timeseries of quarterly sales. Even if a cache is being used, every day that the dashboard is loaded it will trigger a query that computes sales for all quarters, including those that have already ended. In theory only the last quarter would need to be recomputed every day, until a new quarter starts. This will be the case for most metrics computed from fact tables, unless there is an error or change in business logic that requires backfilling the data.
A simple solution that benefits from this behavior is precomputing aggregations: metrics can be precomputed on a daily basis, as new data lands in the warehouse. This can be done using a scheduler like Apache Airflow, Dagster, or Prefect, with the results being stored in summary tables, either in the original warehouse or in a separate database. Even an OLTP database like Postgres and MariaDB could be used, since the volume of data is considerably smaller.
For this example, let’s use Postgres. We can add the following section to the docker-compose.yml file:
  postgres:
    ports:
      - "5432:5432"
    image: postgres:11
    container_name: postgres
    environment:
      POSTGRES_USER: trino
      POSTGRES_PASSWORD: trino
    volumes:
      - ./docker/postgres/init:/docker-entrypoint-initdb.d
Once we have Postgres up and running we can configure our scheduler to run the following query every day:
SELECT
  DATE(orders.orderdate) AS order_date,
  customer.mktsegment,
  nation.name AS nation_name,
  COUNT(*) AS order_count,
  SUM(orders.totalprice) AS total_price
FROM orders
JOIN customer ON orders.custkey = customer.custkey
JOIN nation ON customer.nationkey = nation.nationkey
WHERE DATE(orders.orderdate) = :target_date
GROUP BY 1, 2, 3
Here, :target_date is a variable representing a given day. The metrics for each day will be computed by the query above and stored in a summary table, which in this example will be created in Postgres by the file init.sql inside docker/postgres/init/:
-- docker/postgres/init/init.sql
CREATE TABLE IF NOT EXISTS daily_order_summary (
    order_date DATE NOT NULL,
    mktsegment VARCHAR(20) NOT NULL,
    nation_name VARCHAR(25) NOT NULL,
    order_count INTEGER NOT NULL,
    total_price DECIMAL(15, 2) NOT NULL,
    PRIMARY KEY (order_date, mktsegment, nation_name)
);
CREATE INDEX IF NOT EXISTS idx_daily_order_summary_date ON daily_order_summary (order_date);
How we run the query depends on the scheduler we want to use. In this blog post we’ll be using a simple Python script that is idempotent. The script takes a given day as a parameter, for example 2024-01-01, and runs the query for that day and stores the results in the summary table. This allows us to run the script in parallel for multiple days, and if any given day fails it can just be restarted independently. Here’s the compute-summary.py Python script that does that:
"""
Compute daily aggregates.

This Python script serves as a "poor person's ETL" pipeline. It reads data from a Trino
database for a given day, computes daily aggregates, and writes the results to a
PostgreSQL database.

The script is idempotent. Run as:

    python compute-summary.py YYYY-MM-DD

"""

import sys
from datetime import datetime

import pandas as pd
from sqlalchemy import create_engine, text

TRINO_ENGINE = "trino://user@localhost:8080/tpch/sf100"
POSTGRES_ENGINE = "postgresql://trino:trino@localhost:5432/trino"

SQL = """
    SELECT
      DATE(orders.orderdate) AS order_date,
      customer.mktsegment,
      nation.name AS nation_name,
      COUNT(*) AS order_count,
      SUM(orders.totalprice) AS total_price
    FROM orders
    JOIN customer ON orders.custkey = customer.custkey
    JOIN nation ON customer.nationkey = nation.nationkey
    WHERE DATE(orders.orderdate) = :target_date
    GROUP BY 1, 2, 3
"""

def parse_date(date_str: str) -> datetime:
    """
    Parse a date string in the format "YYYY-MM-DD" to a datetime object.
    """
    try:
        return datetime.strptime(date_str, "%Y-%m-%d").date()
    except ValueError:
        print("Error: Invalid date format. Please use YYYY-MM-DD.")
        sys.exit(1)

def main(date_str: str) -> None:
    """
    Main function to compute daily aggregates.
    """
    target_date = parse_date(date_str)

    # Create database connections
    trino_engine = create_engine(TRINO_ENGINE)
    postgres_engine = create_engine(POSTGRES_ENGINE)

    # Trino query
    trino_query = text(SQL)

    # Execute Trino query
    with trino_engine.connect() as conn:
        result = pd.read_sql(trino_query, conn, params={"target_date": target_date})

    # If no data for the given date, exit
    if result.empty:
        print(f"No data found for {date_str}")
        return

    # Upsert data into PostgreSQL
    with postgres_engine.begin() as conn:
        # First, delete existing records for the target date
        delete_query = text(
            """
        DELETE FROM daily_order_summary
        WHERE order_date = :target_date
        """
        )
        conn.execute(delete_query, {"target_date": target_date})

        # Then, insert new records
        insert_query = text(
            """
        INSERT INTO daily_order_summary
        (order_date, mktsegment, nation_name, order_count, total_price)
        VALUES (:order_date, :mktsegment, :nation_name, :order_count, :total_price)
        """
        )
        conn.execute(insert_query, result.to_dict("records"))

    print(f"Successfully processed data for {date_str}")

if __name__ == "__main__":
    if len(sys.argv) != 2:
        print("Usage: python compute-summary.py YYYY-MM-DD")
        sys.exit(1)

    main(sys.argv[1])
The script runs the query in Trino, stores the results in a Pandas dataframe, and later inserts the results into the summary table in Postgres. Note that in our example we could simplify the logic by connecting Trino directly to Postgres in a new catalog, and running an INSERT INTO ... FROM SELECT ... query, but the script above is a more generic solution, suitable for when two separate databases are used.
We can run the Python script using a bash script that parallelizes the calls, retrying for a number of times if a day fails. This is a hacky approach to running a proper scheduler, and should not be used in production. But for the sake of example only, here’s our backfill-parallel.sh:
#!/bin/bash

PARALLEL_JOBS=4
MAX_RETRIES=3
COMMAND="python compute-summary.py"

# Start and end dates
START_DATE="1992-01-01"
END_DATE="1998-08-02"

# Create a function that retries the command if it fails
run_command() {
    local date=$1
    local retries=0

    while [ $retries -lt $MAX_RETRIES ]; do
        echo "Running command: $COMMAND $date (Attempt: $((retries + 1)))"
        $COMMAND $date

        if [ $? -eq 0 ]; then
            echo "Command succeeded: $COMMAND $date"
            return 0
        else
            echo "Command failed: $COMMAND $date. Retrying..."
            retries=$((retries + 1))
        fi
    done

    echo "Command failed after $MAX_RETRIES retries: $COMMAND $date"
    return 1
}

export -f run_command
export COMMAND MAX_RETRIES

# Generate all dates between START_DATE and END_DATE
seq_dates() {
    local current_date=$START_DATE
    local end_date=$END_DATE

    while [ "$current_date" != "$end_date" ]; do
        echo $current_date
        current_date=$(date -j -f "%Y-%m-%d" -v+1d "$current_date" "+%Y-%m-%d")
    done
    echo $end_date
}

# Use GNU parallel to run the commands in parallel
seq_dates | parallel -j $PARALLEL_JOBS run_command {}
After running the backfill script we can create a physical dataset pointing to it in Superset. This is one of the reasons why it’s important to anticipate needs and bring in as many metrics and dimensions as possible: adding new columns later requires changing the schema of the summary table, and backfilling the data (which might not be trivial to do for just a single column).
One important thing to notice here is that, because the data is pre-aggregated on a daily basis, special attention is needed when defining the metrics. The order_count column in the summary table is a pre-aggregation computed as COUNT(*), so to compute the total number of orders we need to define a metric expressed by SUM(order_count), that expresses the sum of the number of orders in each day.
Here are the metric definitions in the physical dataset:
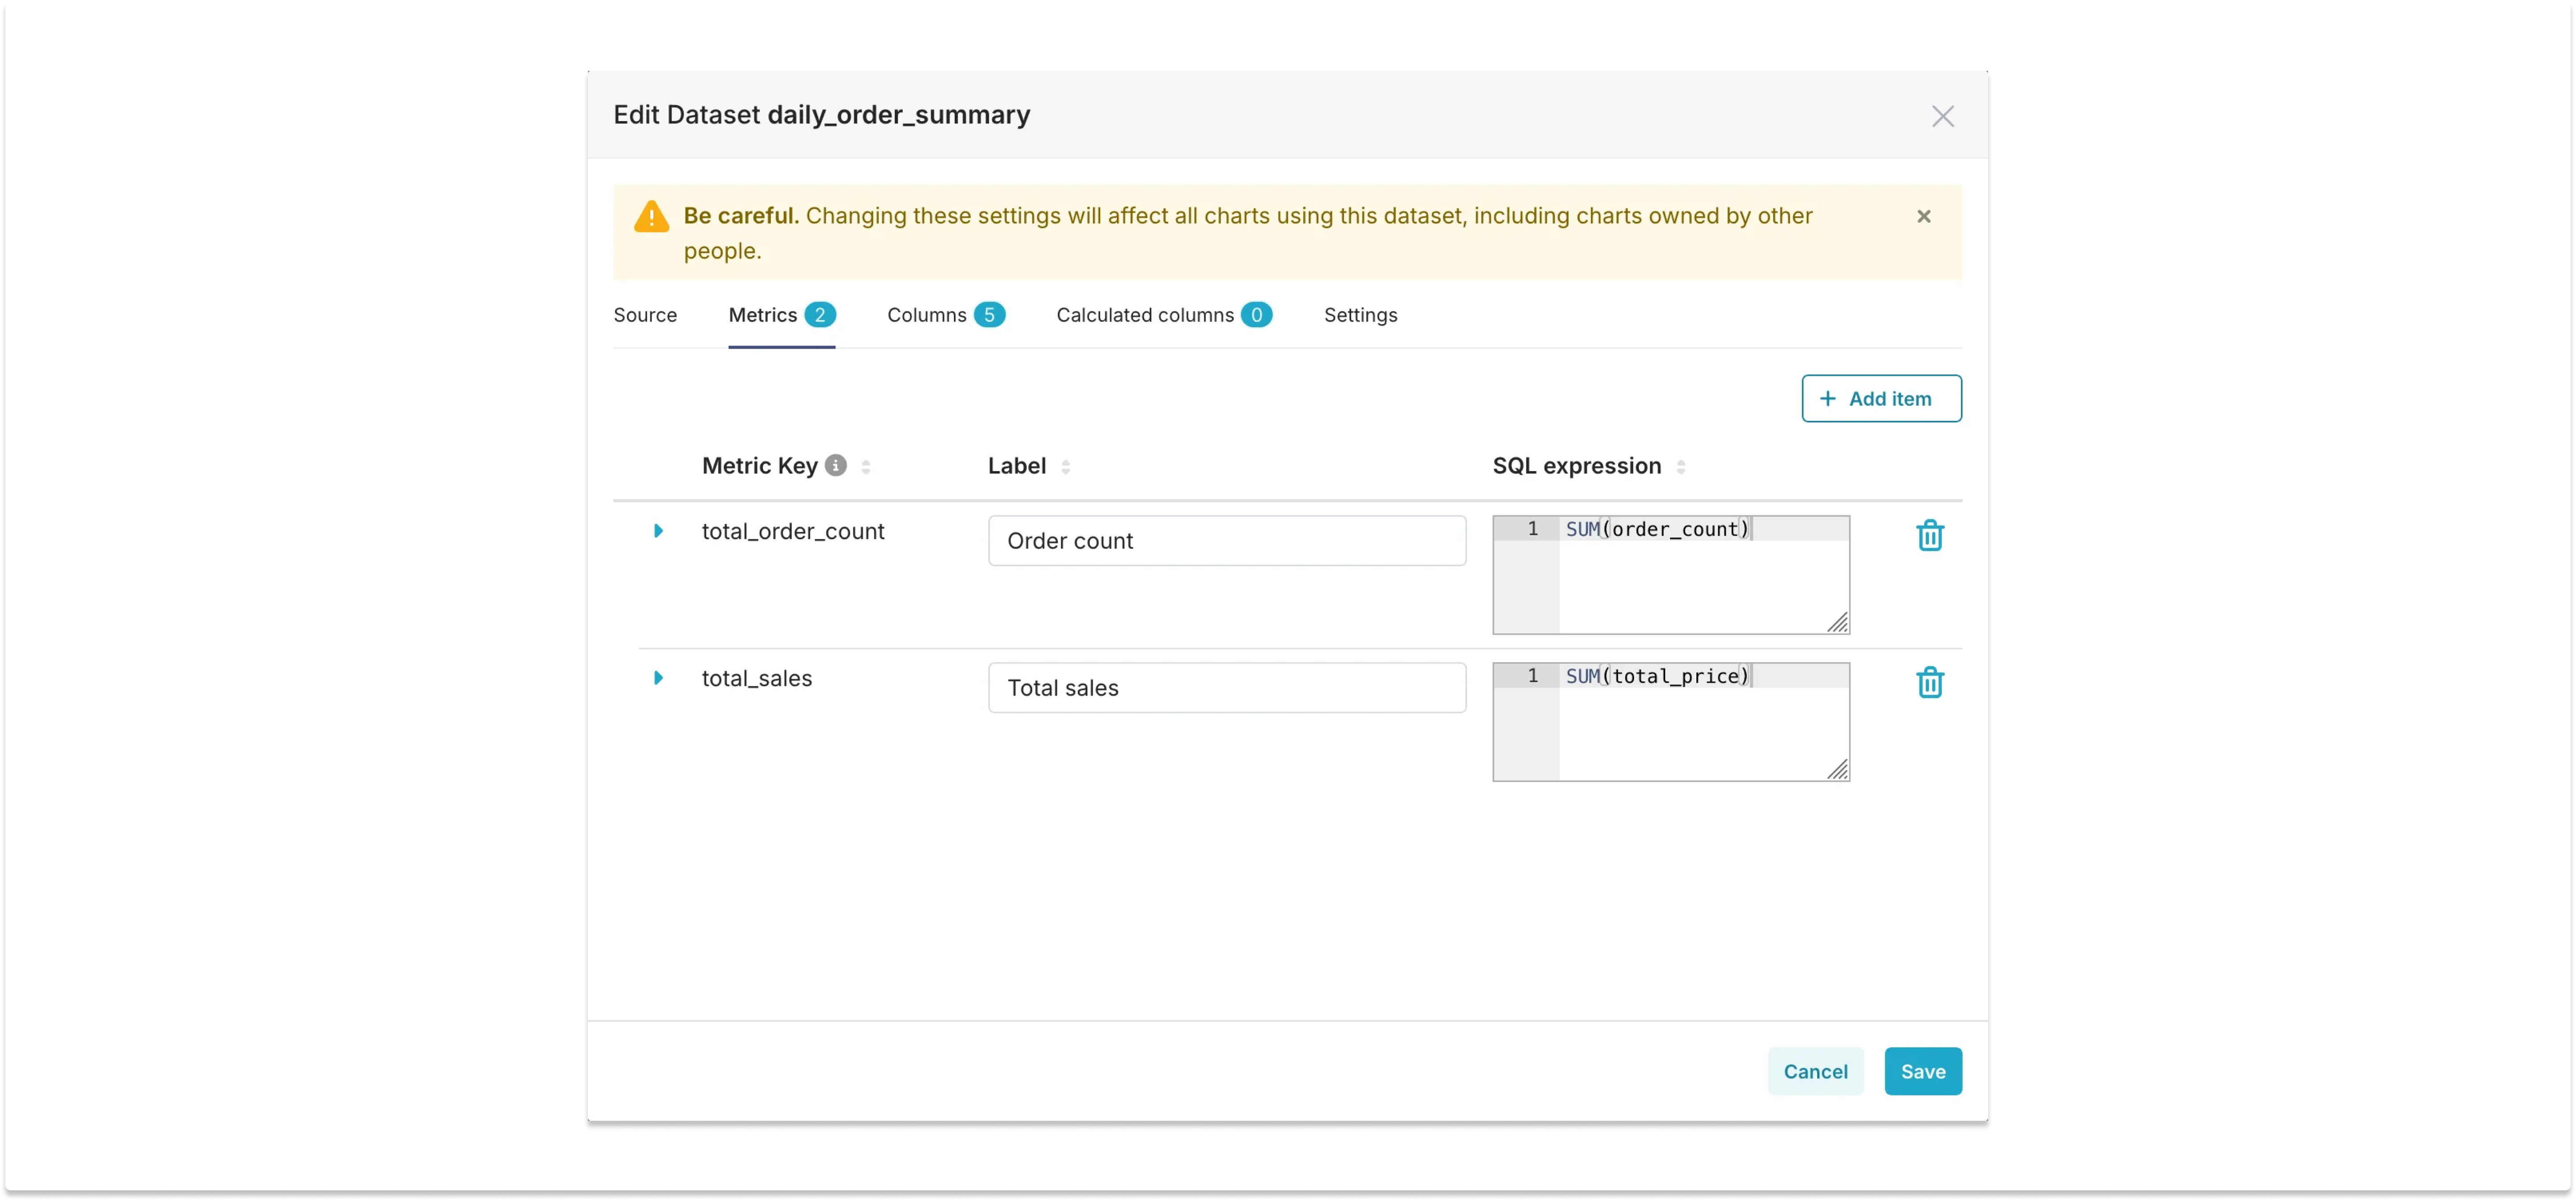
Another caveat is that this solution only works with solutions that can be aggregated linearly, like COUNT, SUM, MIN, MAX, etc. Special attention is needed for metrics like COUNT DISTINCT: if we compute a daily COUNT DISTINCT we can’t simply sum the values to get a monthly value, since that would very likely over count values. Trino offers a solution based on HyperLogLog, where the pre-aggregation is done using the approx_set function:
CREATE TABLE daily_summary AS
SELECT
  date_trunc('day', timestamp) AS day,
  approx_set(user_id) AS daily_distinct_users
FROM events
GROUP BY 1
And later we can query at the monthly grain, for example, using the cardinality and merge functions:
SELECT
  date_trunc('month', day) AS month,
  cardinality(merge(daily_distinct_users)) AS monthly_distinct_users
FROM daily_summary
GROUP BY 1
This is, as the name suggests, an approximate solution.
How does performance look querying our summary table? Here’s a chart built on the physical dataset:
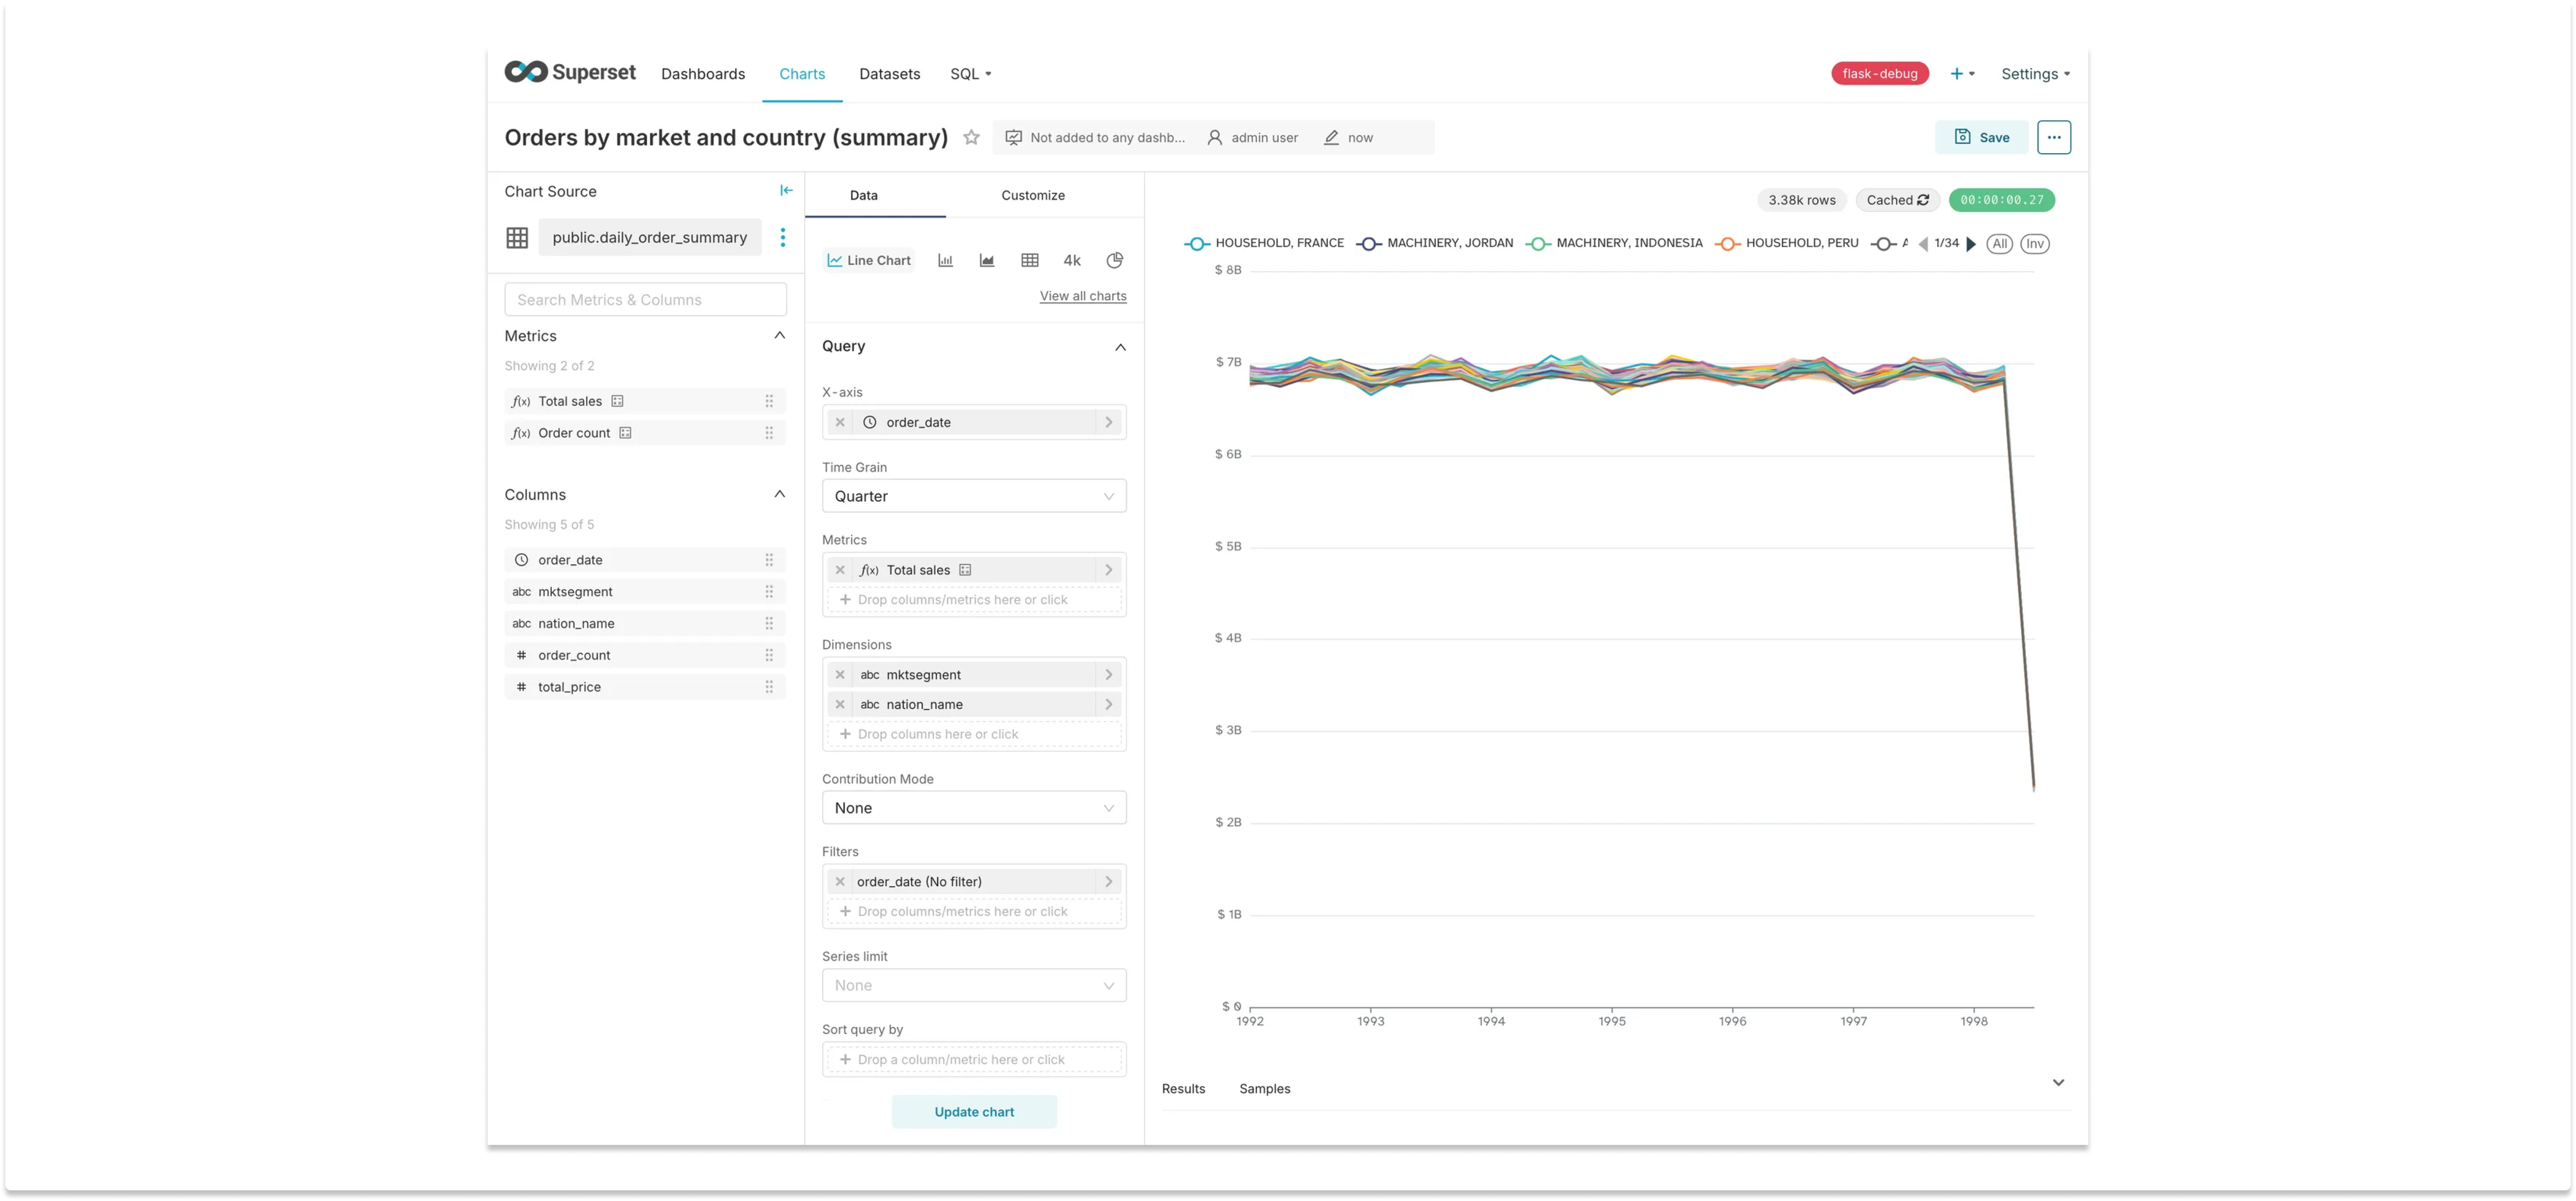
The chart is identical to the initial one, that queried Trino directly, but it only took 0.56 seconds to render — an 80x improvement! Other variations of the query are equally fast: we can filter by a specific country and group by only the market segment, for example, and the chart will still render under a second. All it required was some planning and a scheduler.
One important callout here is that if the number of dimensions pre-aggregated is too large — for example, having a query that aggregates by all key dimensions — the resulting summary table might not be much smaller than the original table. This is particularly true if those dimensions have high cardinality, like a user ID column. In that case, it’s often better to have a good database that can perform quick scans.
Other solutions
There are many other common solutions that can be used to make dashboards faster, and this blog post assumes they’re already in place. One simple (but costly) solution is to scale vertically, by upgrading the database hardware with more CPU and memory, as well as faster disks (as well as adjusting parameters like buffer pool size, query cache, and connection limits to make better use of the increased resources).
Scaling horizontally can be another possible solution, when the data can be sharded across multiple database servers. Even adding read-replicas of the database might help, if many clients are accessing the data concurrently. Also consider using a distributed database system that Superset supports, like ClickHouse, Druid, Pinot.
Many modern data warehouses support materialized views, which can precompute and store query results. This is another potential solution that can significantly speed up repetitive queries without moving data to a separate system.
Conclusion
In this blog post we explored a spectrum of optimization techniques to make dashboards faster, each with its own strengths and trade-offs. From simple caching to orchestrating the precomputation of aggregations, the path to more performant dashboards is one of trade-offs.
While caching offers quick wins for static dashboards, it falls short for highly interactive scenarios. Sampling provides a balance between speed and accuracy, albeit with some compromises in data precision. Precomputing aggregations emerges as a powerful solution, dramatically reducing query times while maintaining data integrity, though it requires more upfront planning and ongoing maintenance.
As we've seen, there's no one-size-fits-all approach; the best solution often involves a combination of techniques tailored to your specific use case, data volume, and user needs. Remember, the goal isn't just to make dashboards faster, but to create a seamless, responsive experience that empowers all users in the organization to derive insights quickly and effortlessly.