


Introduction to YugabyteDB and Apache Superset


This post was originally published over at the YugabyteDB blog.
Enterprises today collect and store vast amounts of data. However, realizing business value from this data requires modern data exploration and visualization tools.
Apache Superset is a widely popular, open source data exploration and visualization platform used and supported by enterprises such as Airbnb, Lyft, and Nielsen. More specifically, Superset enables users to quickly and easily explore and visualize large amounts of data stored in YugabyteDB. As a result, this distributed SQL database connects seamlessly with Superset using the standard PostgreSQL connector.
In this post, we demonstrate how business users can use Superset to get valuable insights from their data stored in YugabyteDB. We’ll also walk through a retail operations use case that keeps track of order processing efficiency in a specific business territory, as highlighted below.

Setup and Installation
Throughout this post, we’ll explore tables in the Northwind database (available as a sample database with YugabyteDB installation). Our goal is to create a chart showing the average time taken to ship an order once placed.
Step 1: Install YugabyteDB
You have multiple options to install or deploy YugabyteDBt if you don’t have one already available.
Step 2: Load the Northwind database
If using yugabyted, you can load the database with the ./bin/yugabyted demo connect command from your shell. Otherwise, you’ll need to follow these instructions.
Step 3: Install Superset and configure drivers
Install Superset from scratch using Python install (PIP) or Docker Compose (recommended).
Step 4: Launch Superset
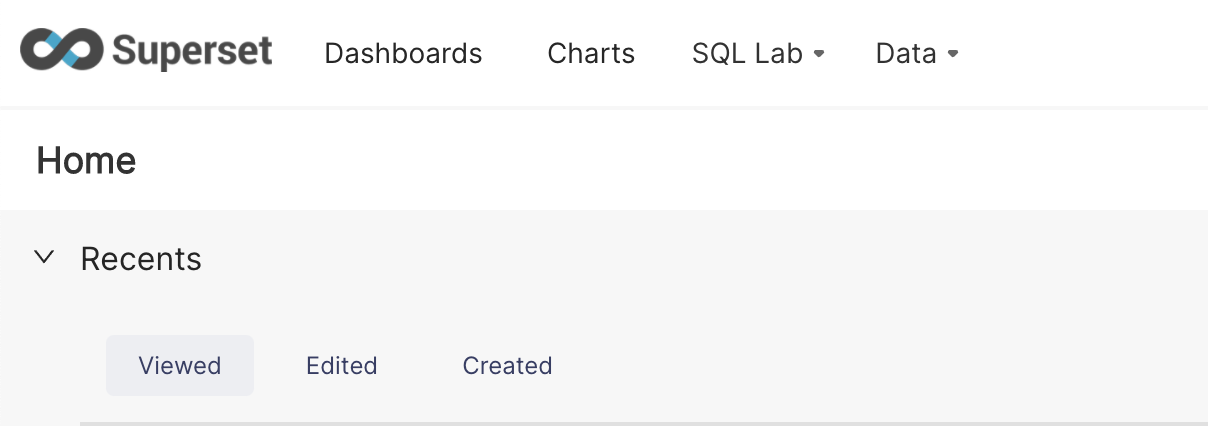
After successful installation, launch Superset in the browser at http://<hostname/IP>:8088. In case of local installation on your laptop, navigate to localhost:8088 or 127.0.0.1:8088. The Superset landing page will look something like this:
Exploration
With setup and installation complete, you’re now ready to connect Superset and explore your database.
Step 1: Connect Superset with YugabyteDB
Superset connects to YugabyteDB with the standard PostgreSQL driver that comes with Superset. Otherwise, you need to manually install the psycopg2 driver. For this example, we’ll connect a single Yugabyte DB node using the standard PostgreSQL connector with the below configurations.
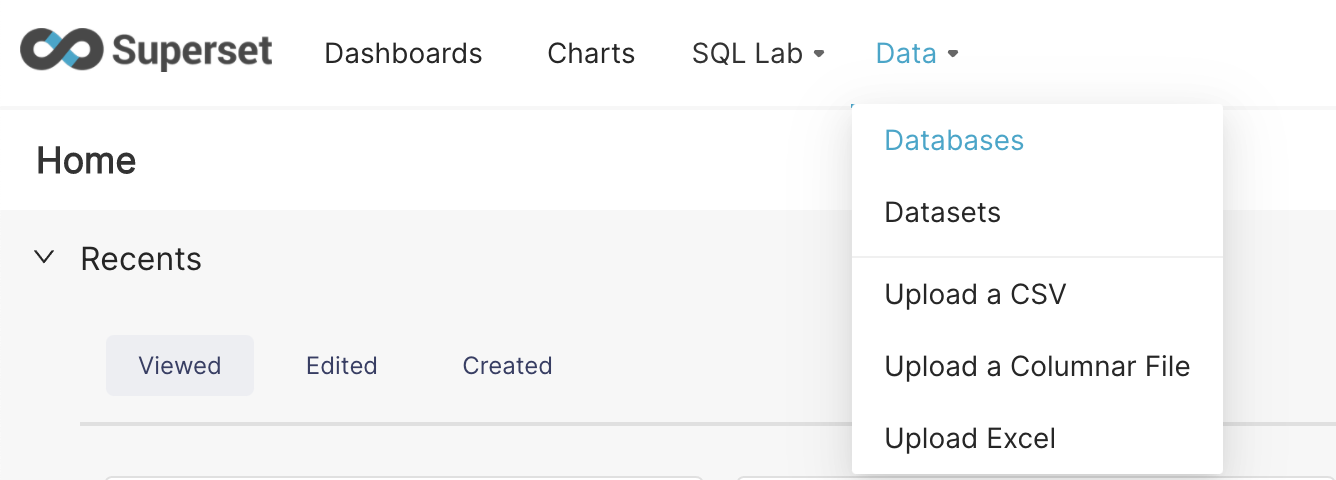
- Navigate to Data → Databases → + Databases as shown below.
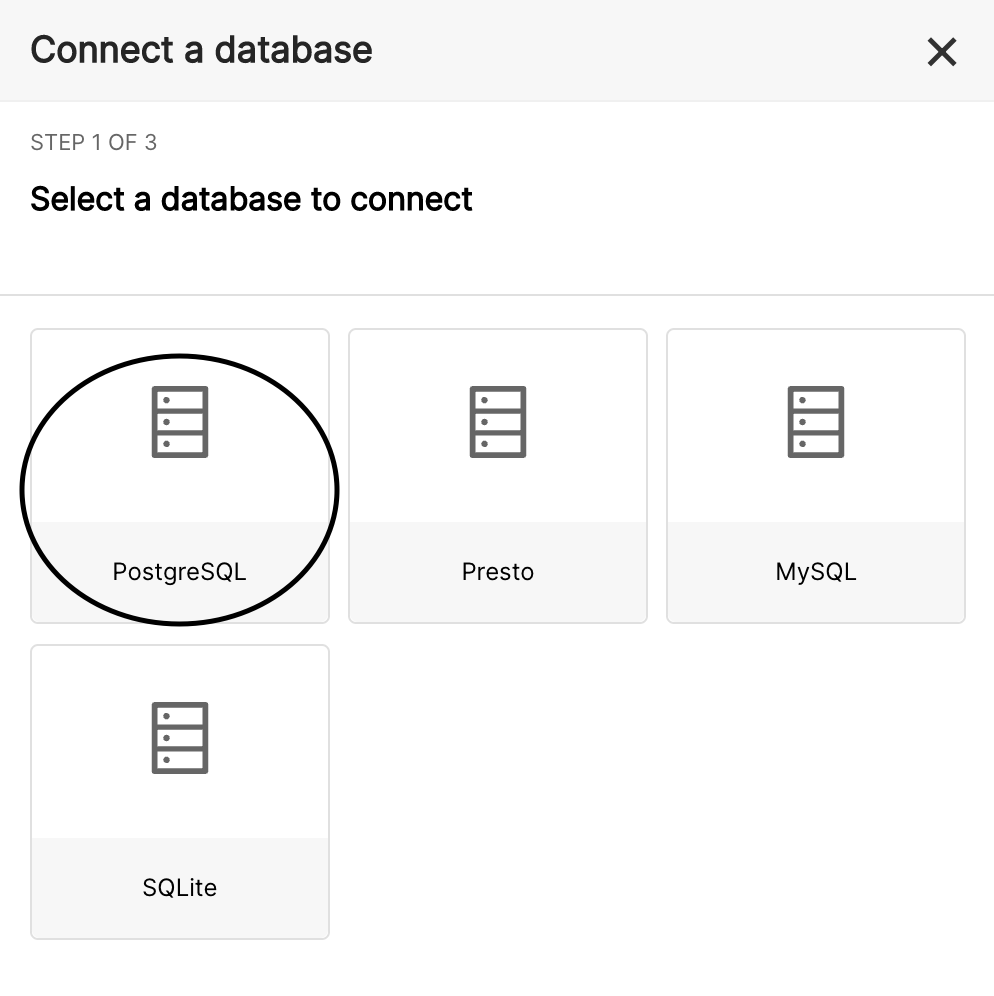
- Choose PostgreSQL from the “Connect a database” menu highlighted below.
- Finally, enter the hostname or IP Address of your YB-TServer with standard credentials.
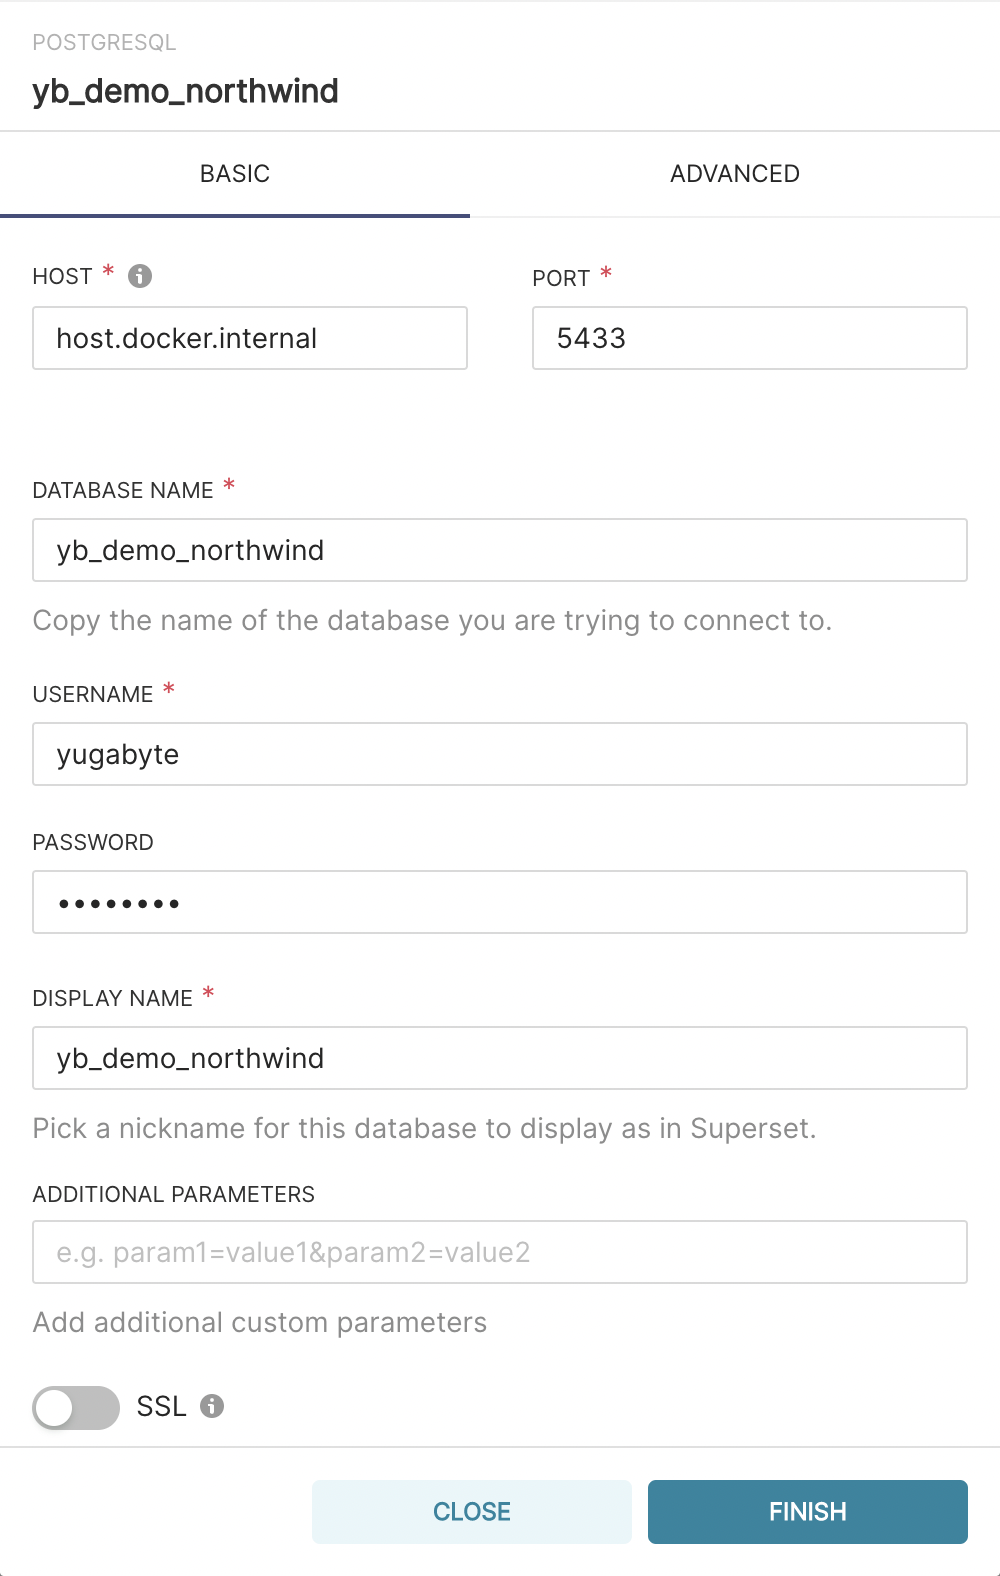
In addition, please refer to the settings captured in the above screenshot if you are using a localhost-based cluster installed on your laptop with Superset and docker-compose.
Note: As of Docker version 18.03, the host.docker.internal hostname connects to your Docker host from inside a Docker container.
Step 2: Explore the Northwind Dataset
Once you're connected to YugabyteDB, you need to load specific tables to explore as datasets.
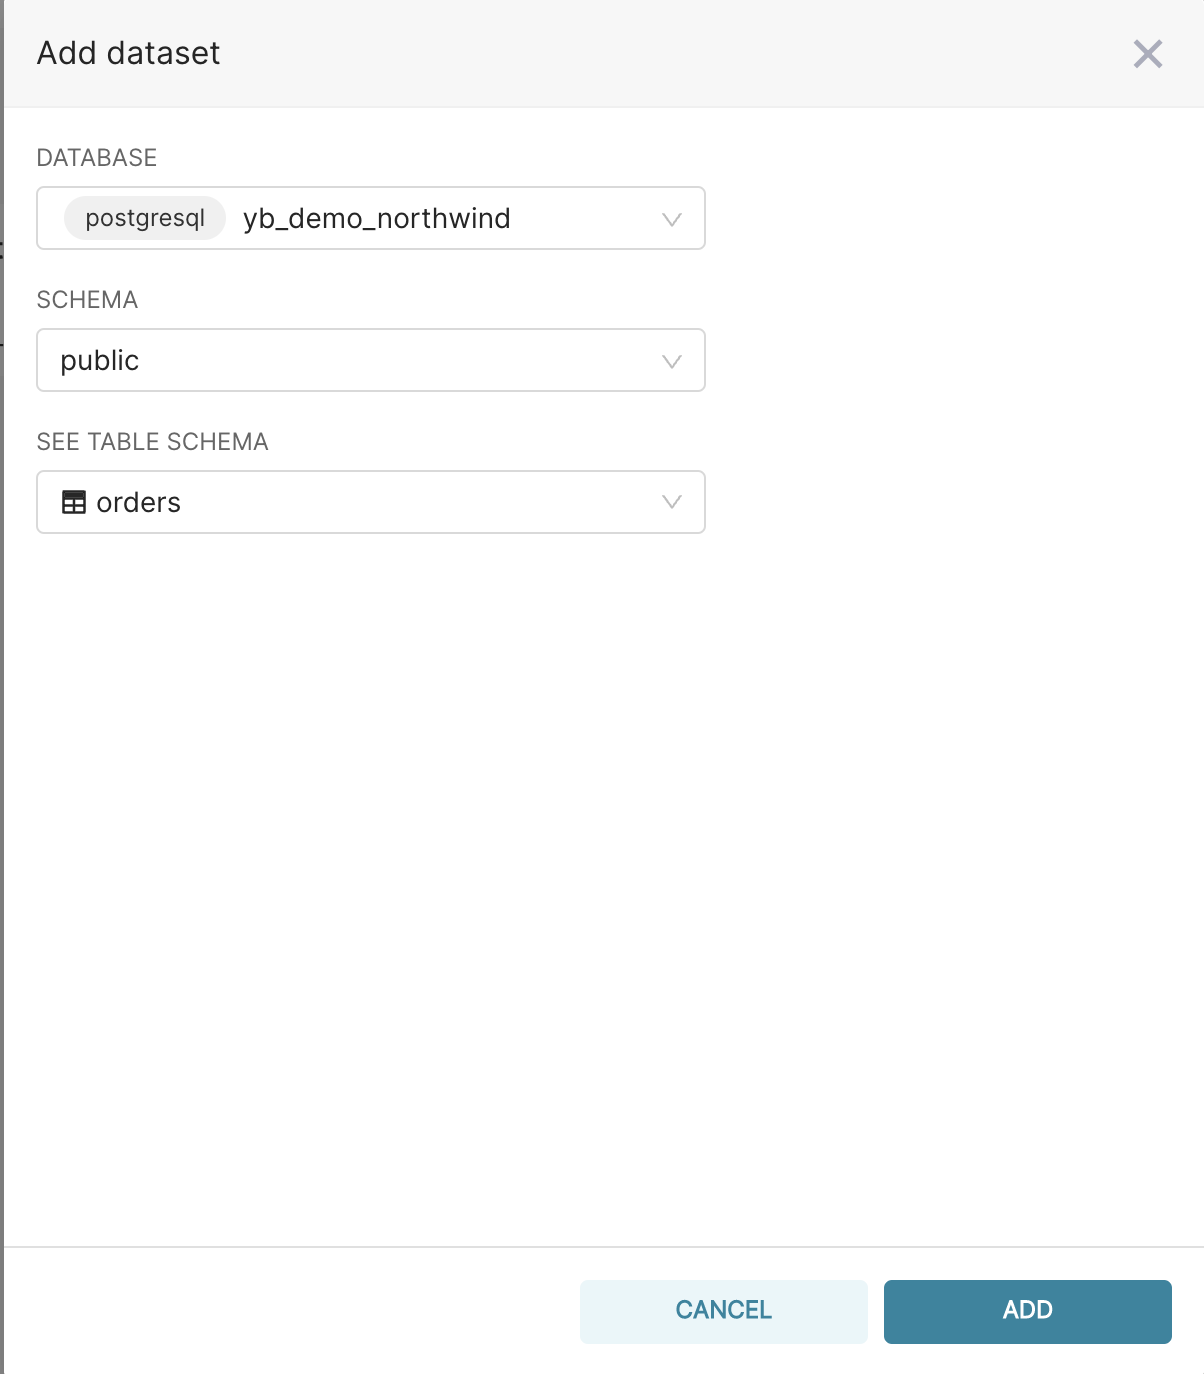
- Navigate to Data → Datasets → +Datasets and configure as shown below. Since we’re interested in order processing timelines, let’s explore the orders table.
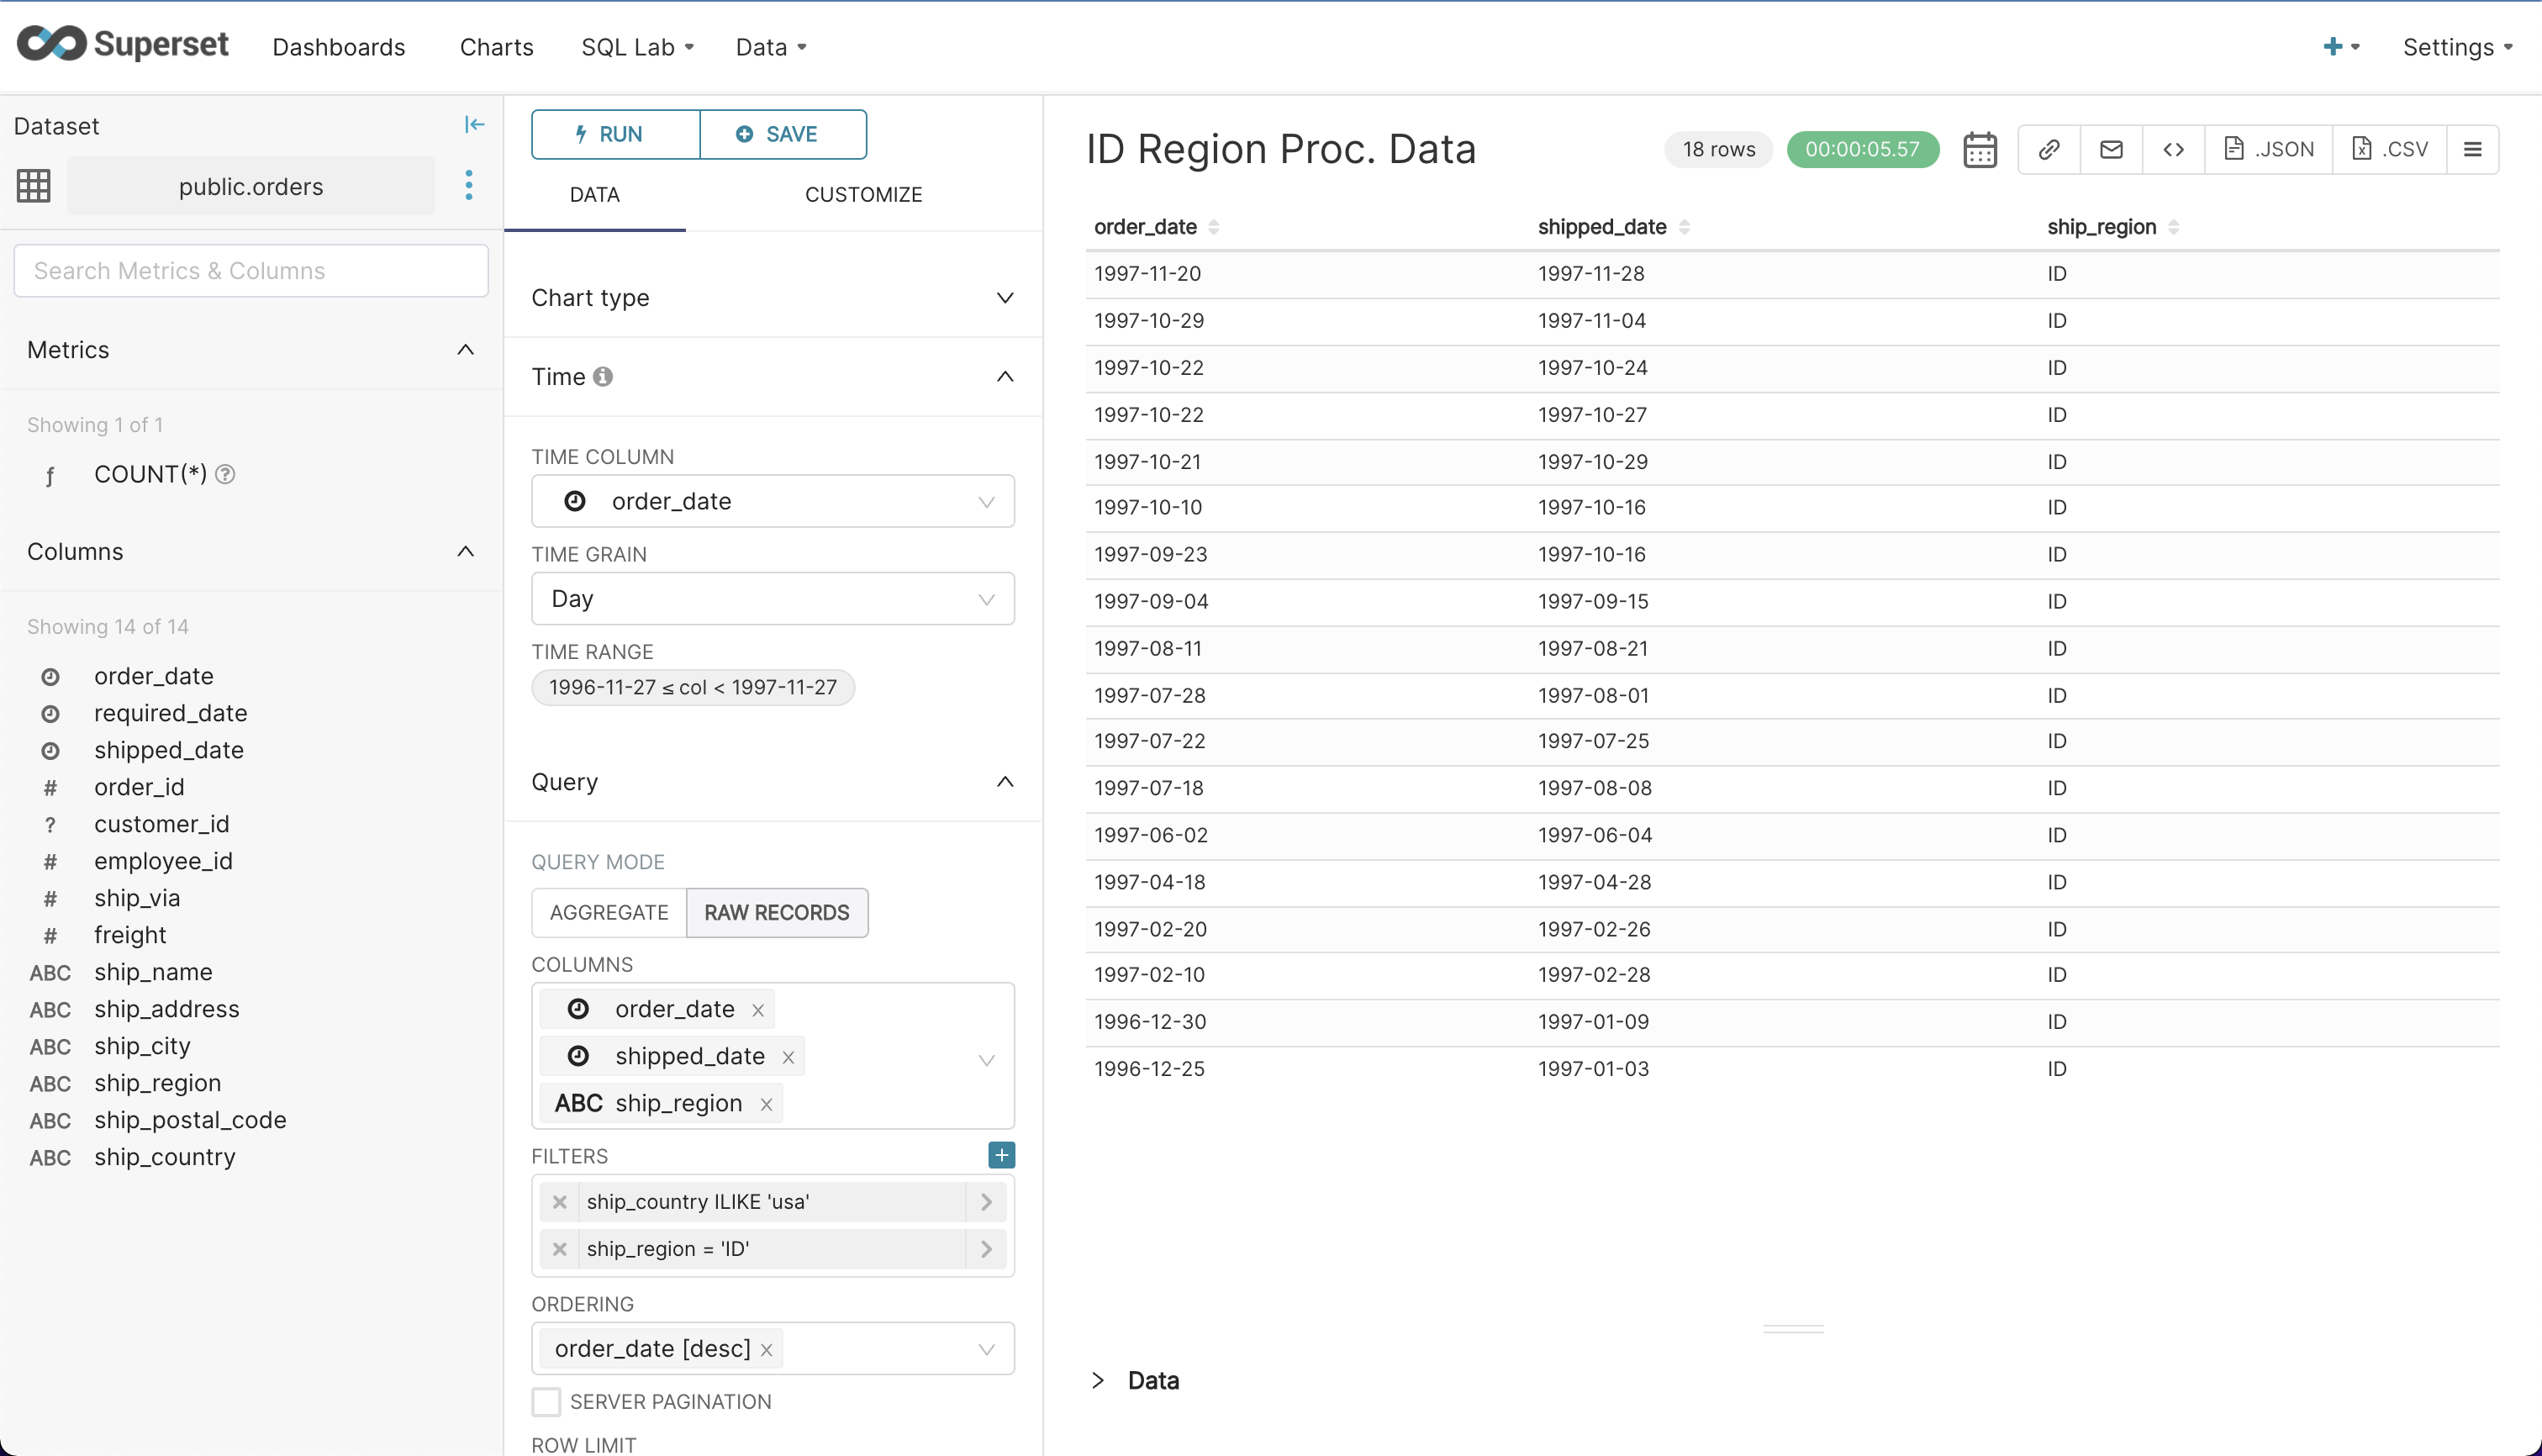
- Specifically, ‘orders’ will now be listed on the available datasets tab. Click on it to explore this dataset. You can explore this dataset in multiple charts, tables, and filtered rows without writing complex queries.
- The below screenshot shows order placement and shipment dates for a particular region in the US within a specific date range.
- Finally, explore some other tables and more columns to get a good understanding of the database. Try filters and date ranges.
Step 3: Create a report
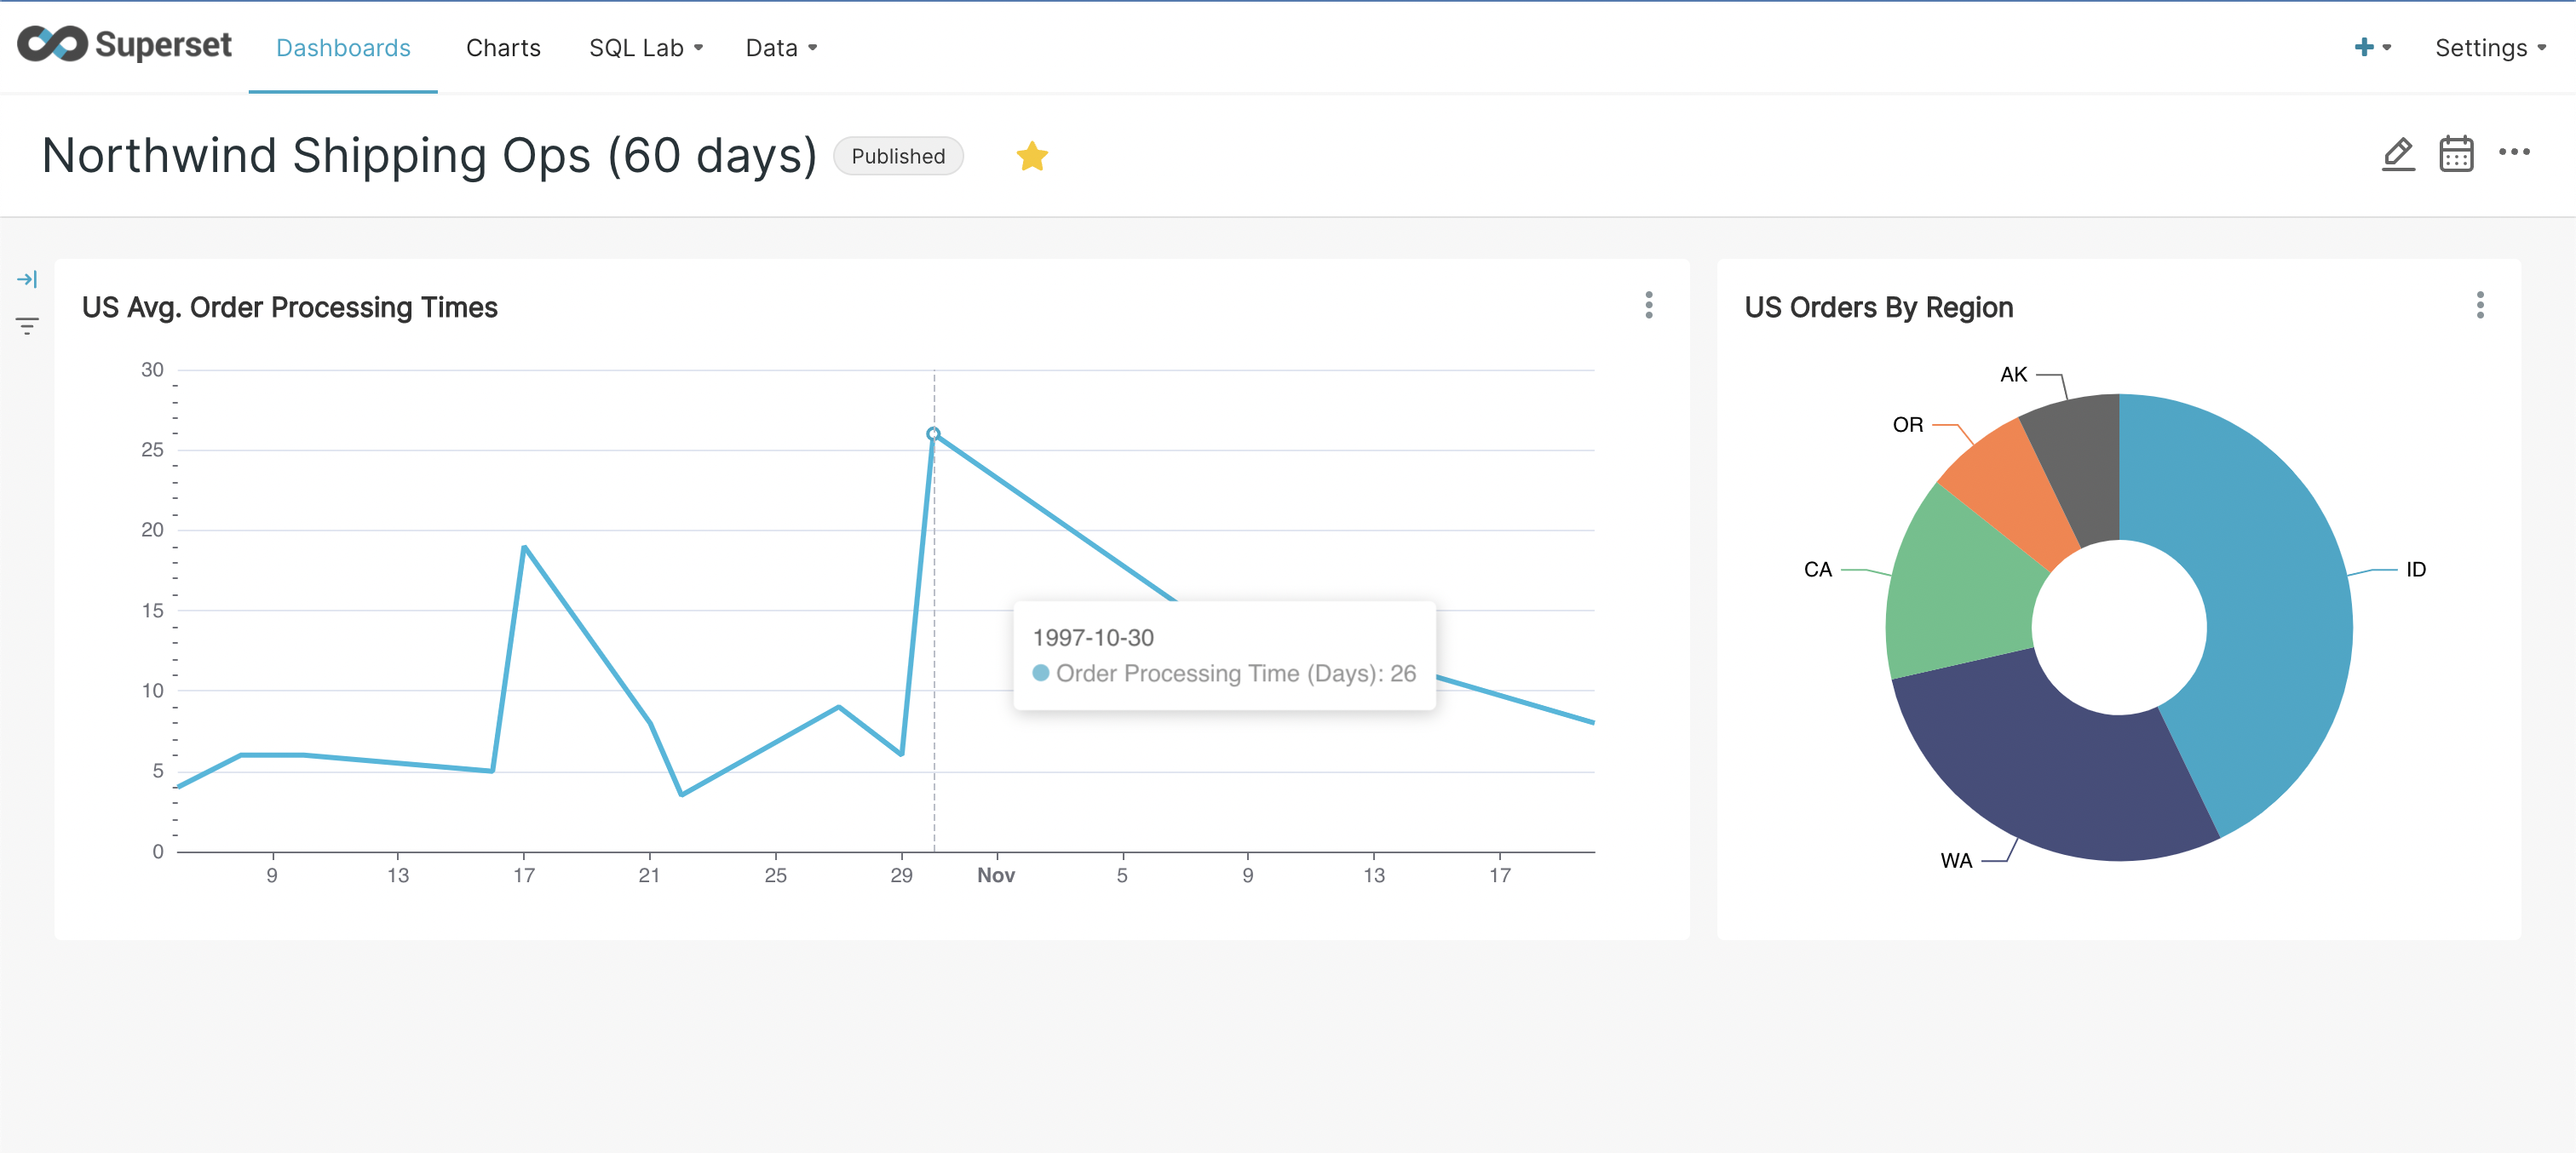
In conclusion, let’s create a report to see how order processing times vary over a period of interest.
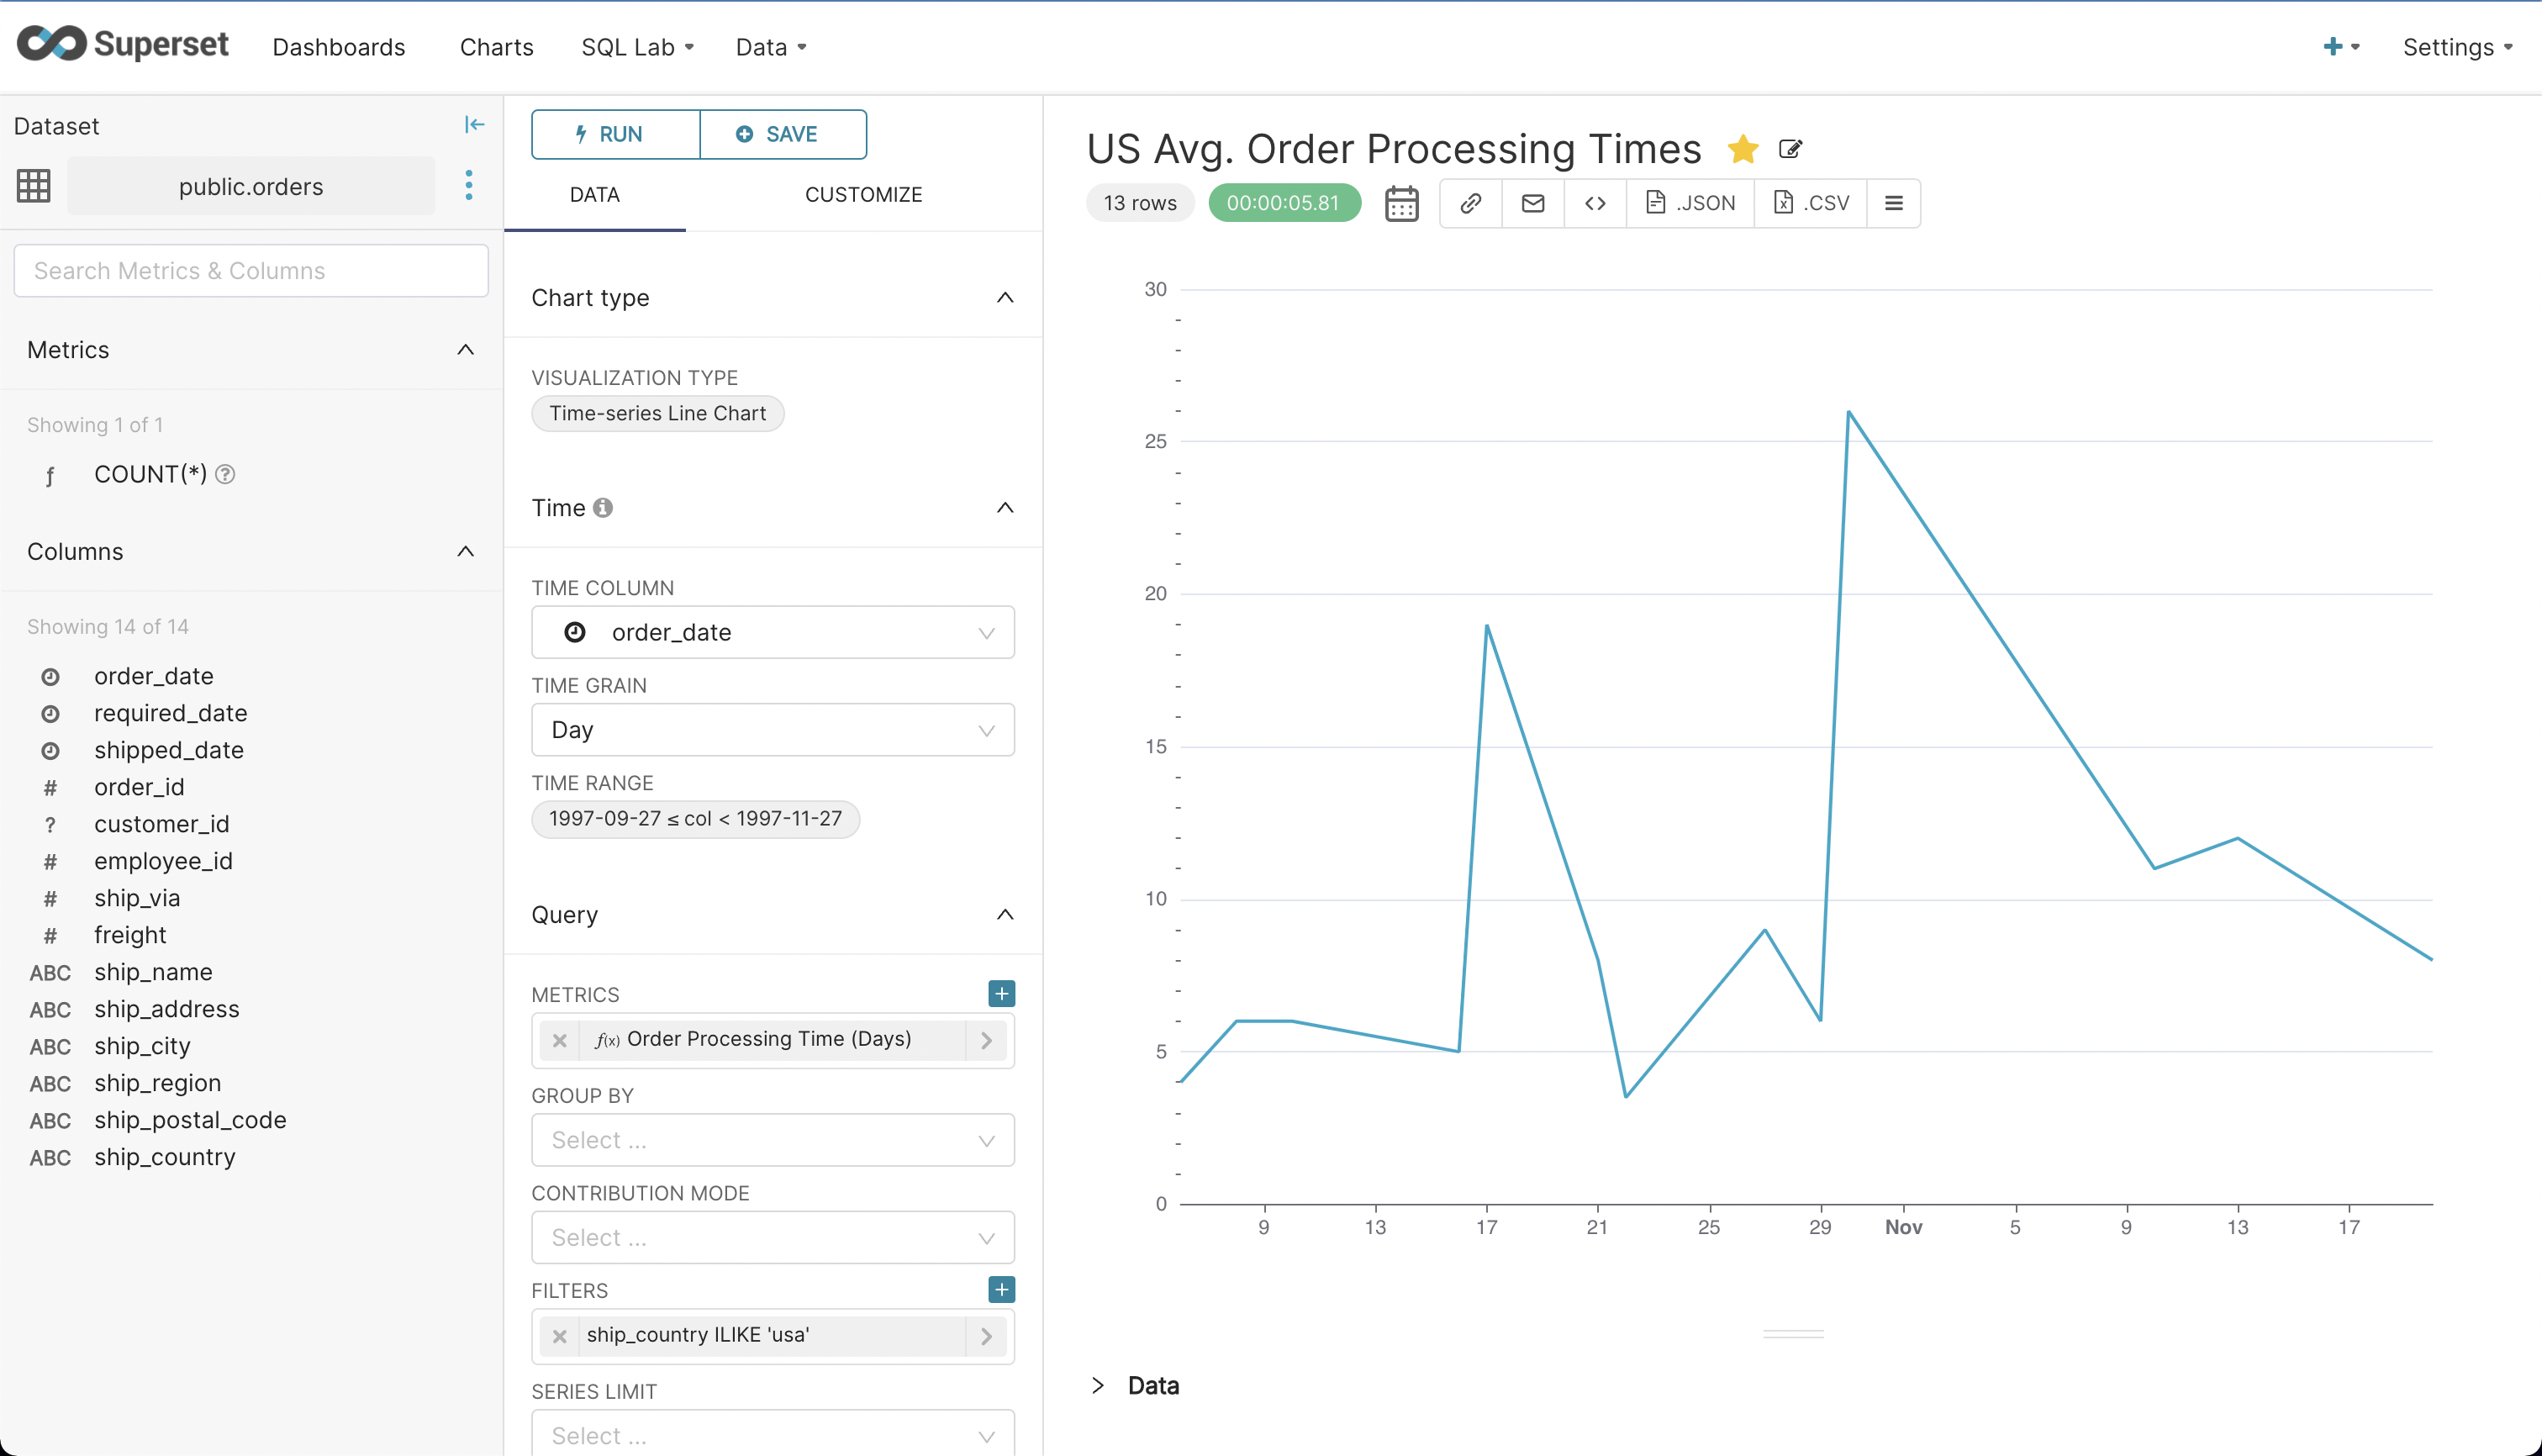
- Navigate to Charts → +Chart from the main menu, select ‘orders’ as the dataset, and an appropriate chart style. To keep it simple, we’ll select ‘Time-Series Line Chart’ under ‘Popular’ and click the ‘Create New Chart’ button.
- Configure it as shown below to visualize the varying average order processing times for U.S. orders over a period of 60 days. We’re using a simple ‘avg.(shipped_date – order_date)’ metric to calculate this. Play with time range, filters, and group by to visualize different periods, regions, or countries. And don’t forget to click ‘Run Query’ to refresh the chart.
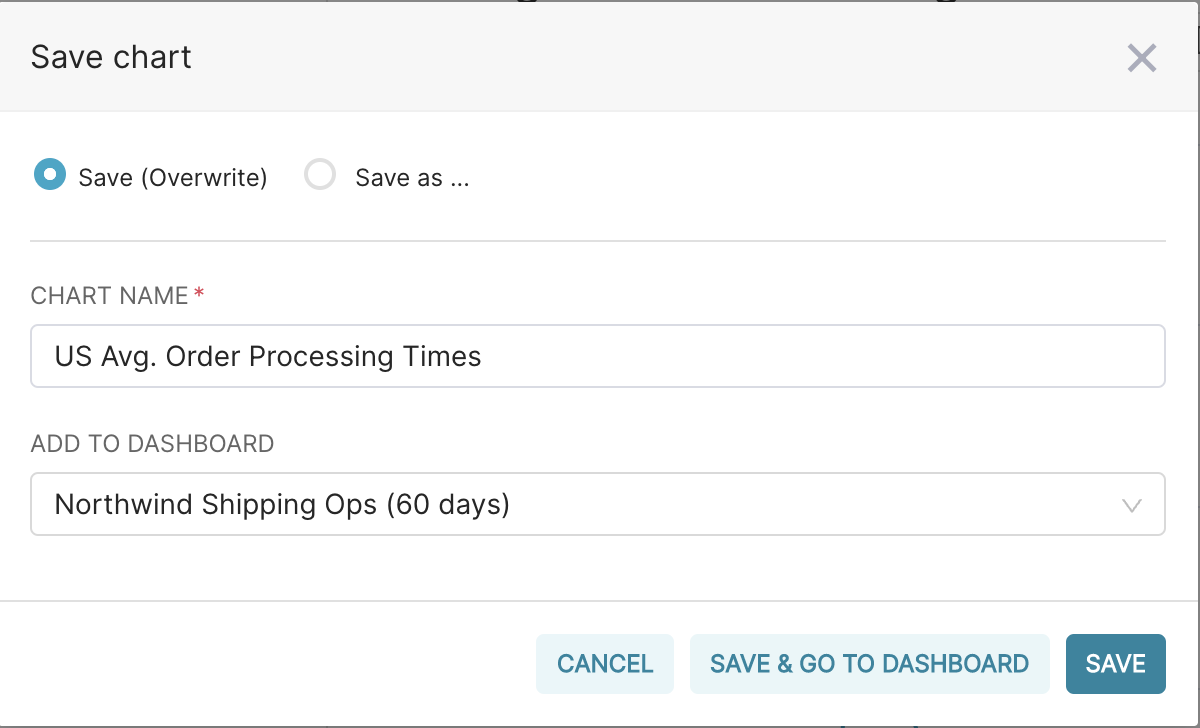
- Once you have the desired chart, click ‘Save’ to save the chart and add it to a dashboard.
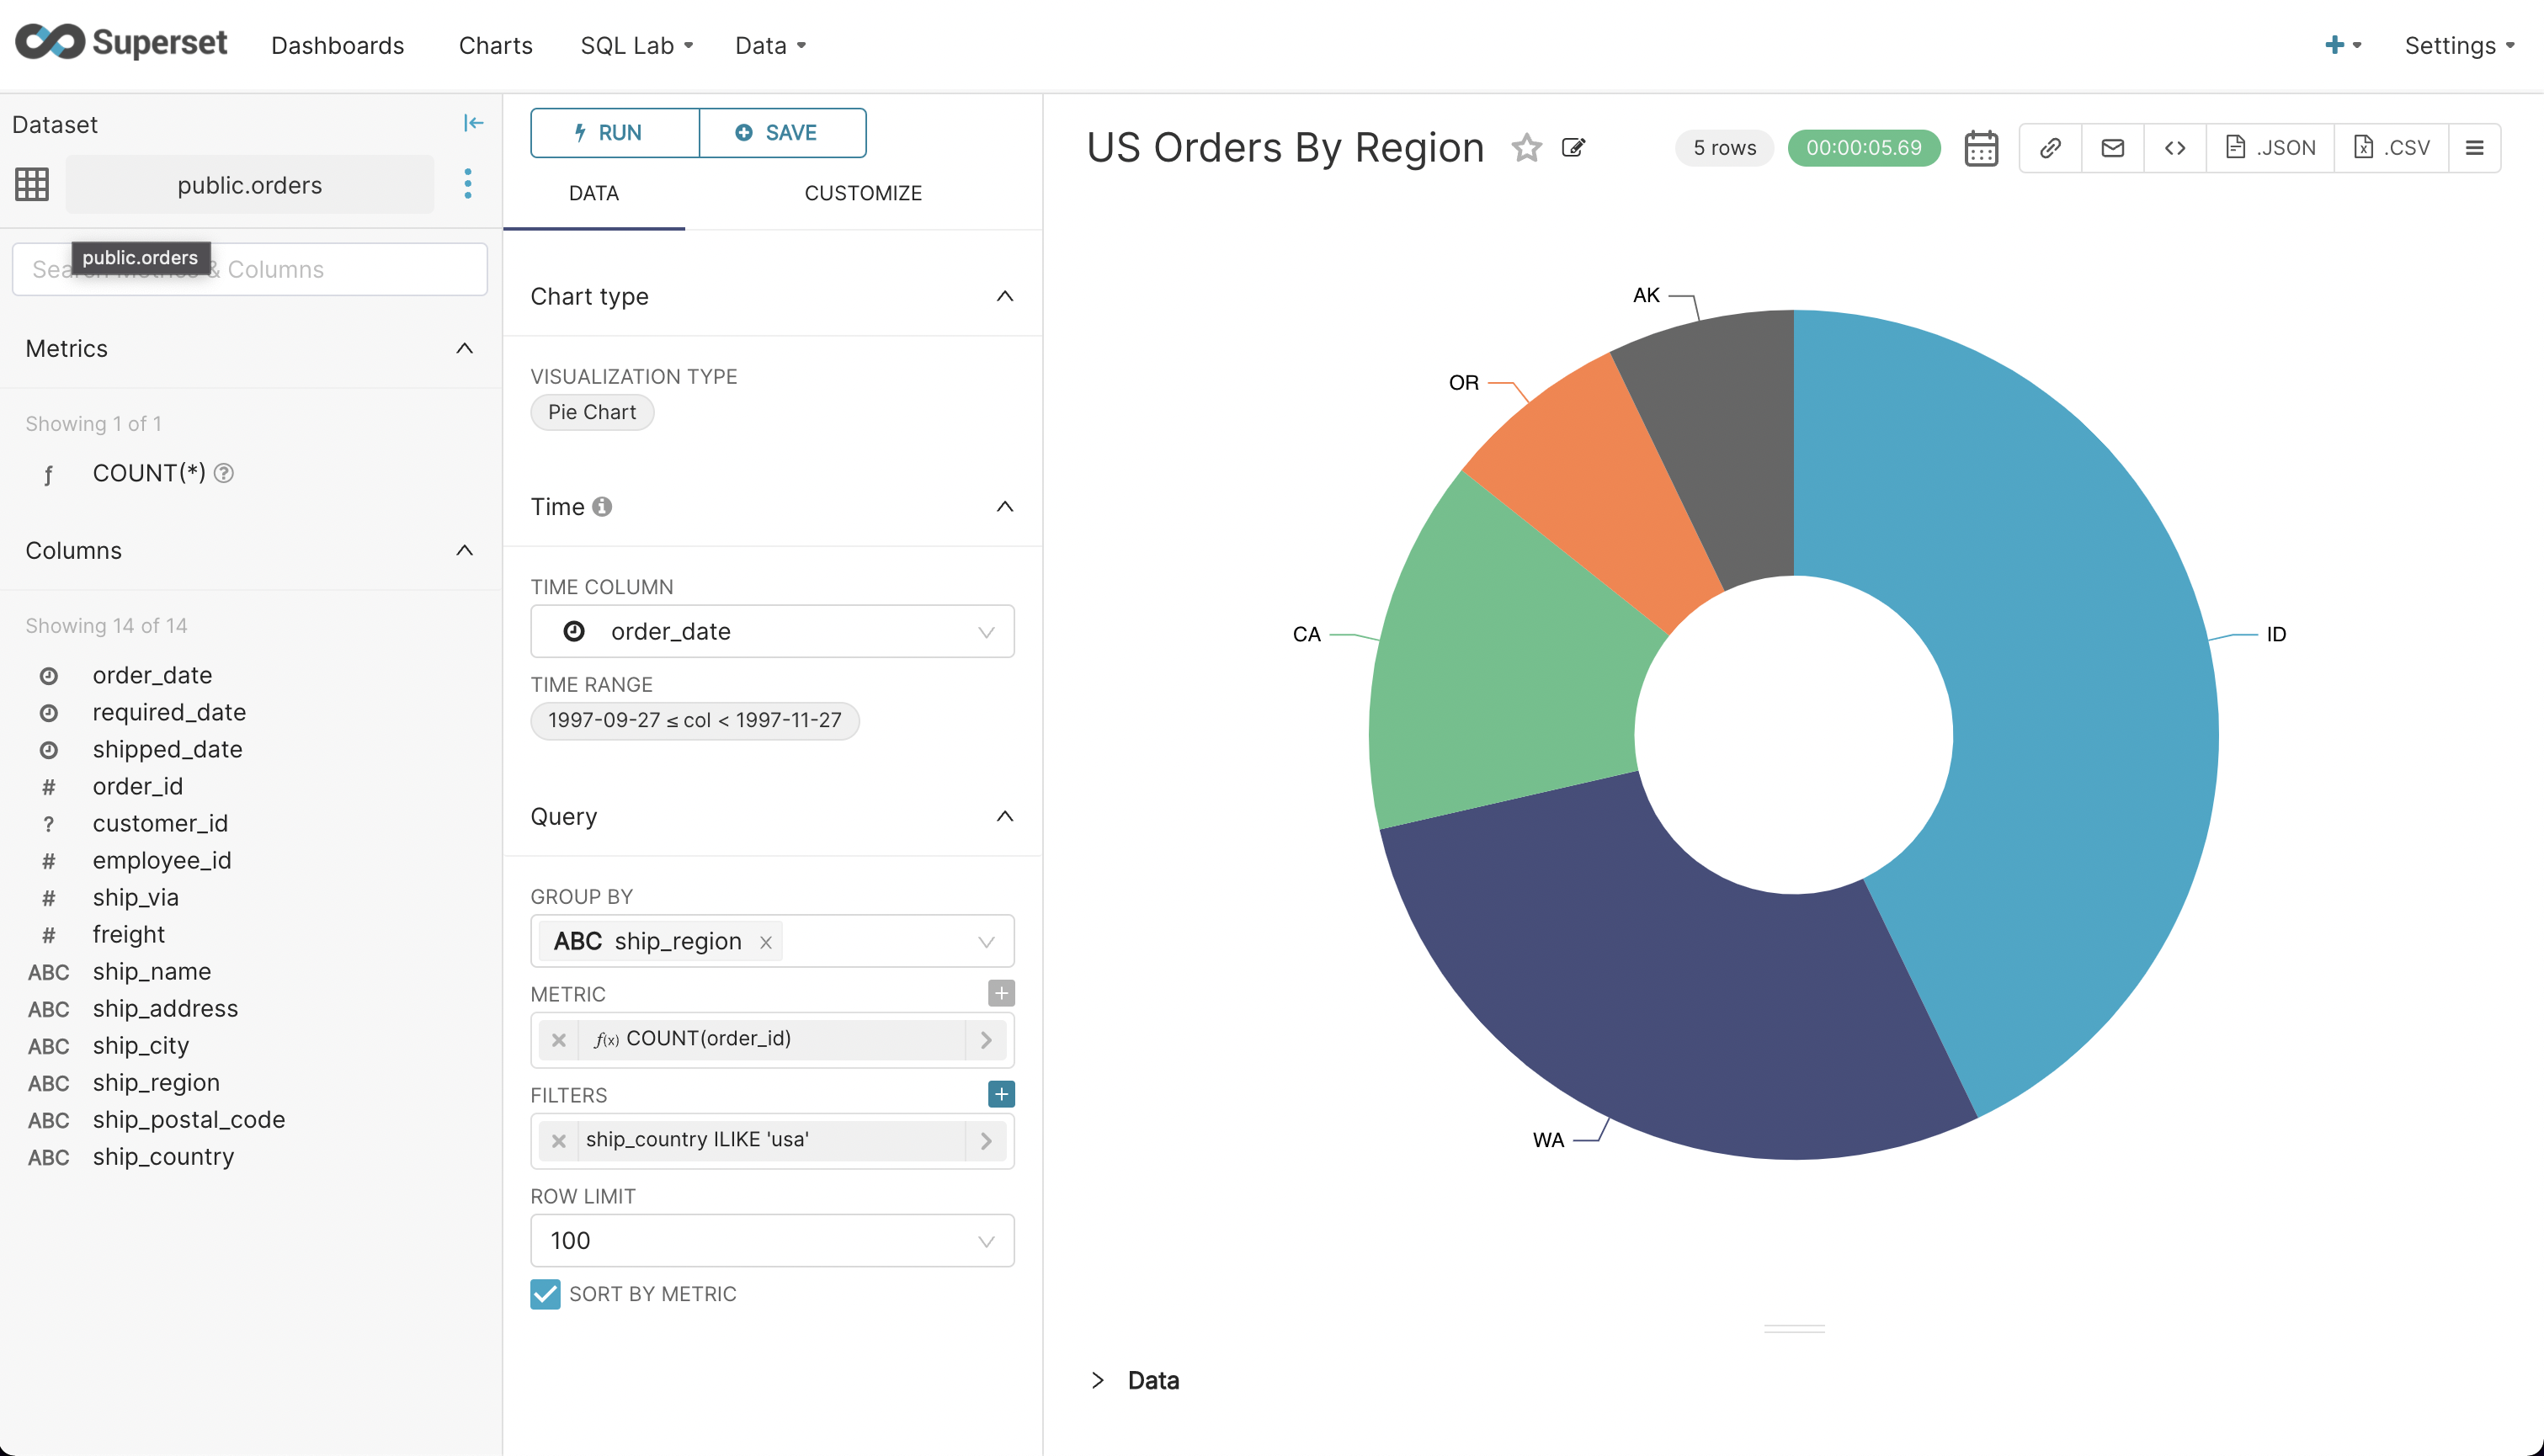
- Try creating another chart as shown below to visualize order distribution by regions within the U.S. Save this chart and add it to the dashboard you created earlier.
- Finally, navigate to ‘Dashboards’ from the main menu and click on the dashboard you created. Click on the ‘draft’ status button to publish the dashboard.
Conclusion
In this blog post, we presented how to explore and visualize data stored in YugabyteDB with Apache Superset. YugabyteDB is PostgreSQL compatible and you can seamlessly connect Superset with YugabyteDB using the standard PostgreSQL connector that is part of the Superset docker installation.
More specifically, YugabyteDB and Superset are both designed for modern enterprises leading digital transformation. When combined, these tools create business value from large amounts of data they collect and store. Both come with great documentation and have excellent developer and community support.
If you haven’t already, check out our docs and blog blog sites to learn more about YugabyteDB. Any questions? Ask them in the YugabyteDB community Slack channel.
