From Data Drill Down to Drill By: A Better Way to Explore Your Data
Data drilling is a popular business intelligence (BI) feature that allows users to analyze information by providing different data views in charts, dashboards, spreadsheets, and tables. Drilling is commonly used to explore granular details, highlight valuable insights behind the summary data, and understand factors driving trends or anomalies.
What is data drill down?
A common type of data drilling is Drill Down, a simple interaction that implies one or many pre-defined hierarchies. For example, clicking on ‘vehicle revenue’ would apply a filter on vehicle sales data (in dollars) and drill into its pre-defined hierarchy (e.g., sales revenue by regions). Building an intuitive hierarchical relationship that matches user intent can be complicated as users may expect or desire different granular views of the different levels that are non-hierarchical. For example, a user may want to drill into the ‘manufacturers’ of the vehicles (e.g., Honda, General Motors), while another user may want to drill into ‘vehicle types’ (e.g., sedans, trucks, motorcycles).
Introducing Drill By
At Preset, we believe that Drill By, an approach built on a “contextual menu” (e.g., right-clicking a chart element like a wedge on a pie chart), is the future of data drilling. Drill By is similar to Drill Down except it does not expect a pre-defined hierarchical dimension. It acts by filtering on one dimension (the selected chart element) and performs the “group by” function on the dimension the user selects from a contextual menu. For instance, you may filter on ‘vehicles’ and can select to expose ‘manufacturer’, ‘vehicle type’, ‘vehicle color’, or ‘make year’. Drill By is a more versatile version of Drill Down that can do everything Drill Down can do without imposing any hierarchy semantics upfront. On the other hand, building Drill Down would require one or more “downward” related columns, which is essentially a curated list of columns going in that direction to act as a shortcut.
We recently released Drill-to-Detail, which is also built on a contextual menu and is a milestone toward this vision. Read on to learn more about Drill-to-Detail and how you can use it to draw insights from Apache Superset and Preset's charts and dashboards today.
Exploring data as you intended
A contextual menu lets users define how they want to dive deeper into their data. This ensures that subsequent granular information matches the user intent and helps to accelerate their data analysis and exploration.
Drill-to-Detail shows you atomic events related to the filter (contextual menu) applied to a chart or a dashboard. For example, if you are looking at an ‘invoices’ dataset, clicking on a ‘country’ and drilling through it should show a pop-up of individual invoices that compose the summary data for the chosen country. Ideally, there are semantics that define clearly which subset of the columns should be surfaced in the context of drilling operations. For example, a user could define which subset of columns should be shown for a particular dataset when anyone is drilling through it. In the absence of such semantics, surfacing all columns is probably the best bet; this is what Drill-to-Detail provides you today.
Use cases: Preset and Superset's Drill-to-Detail with dashboard filters
Drill-to-Detail combined with Preset’s dashboard filters can power insightful analyses for different teams. We highlight a few examples covering standard business functions and industries here, but the drilling operation can be applied to many more types of analyses.
i) Understanding revenue drivers
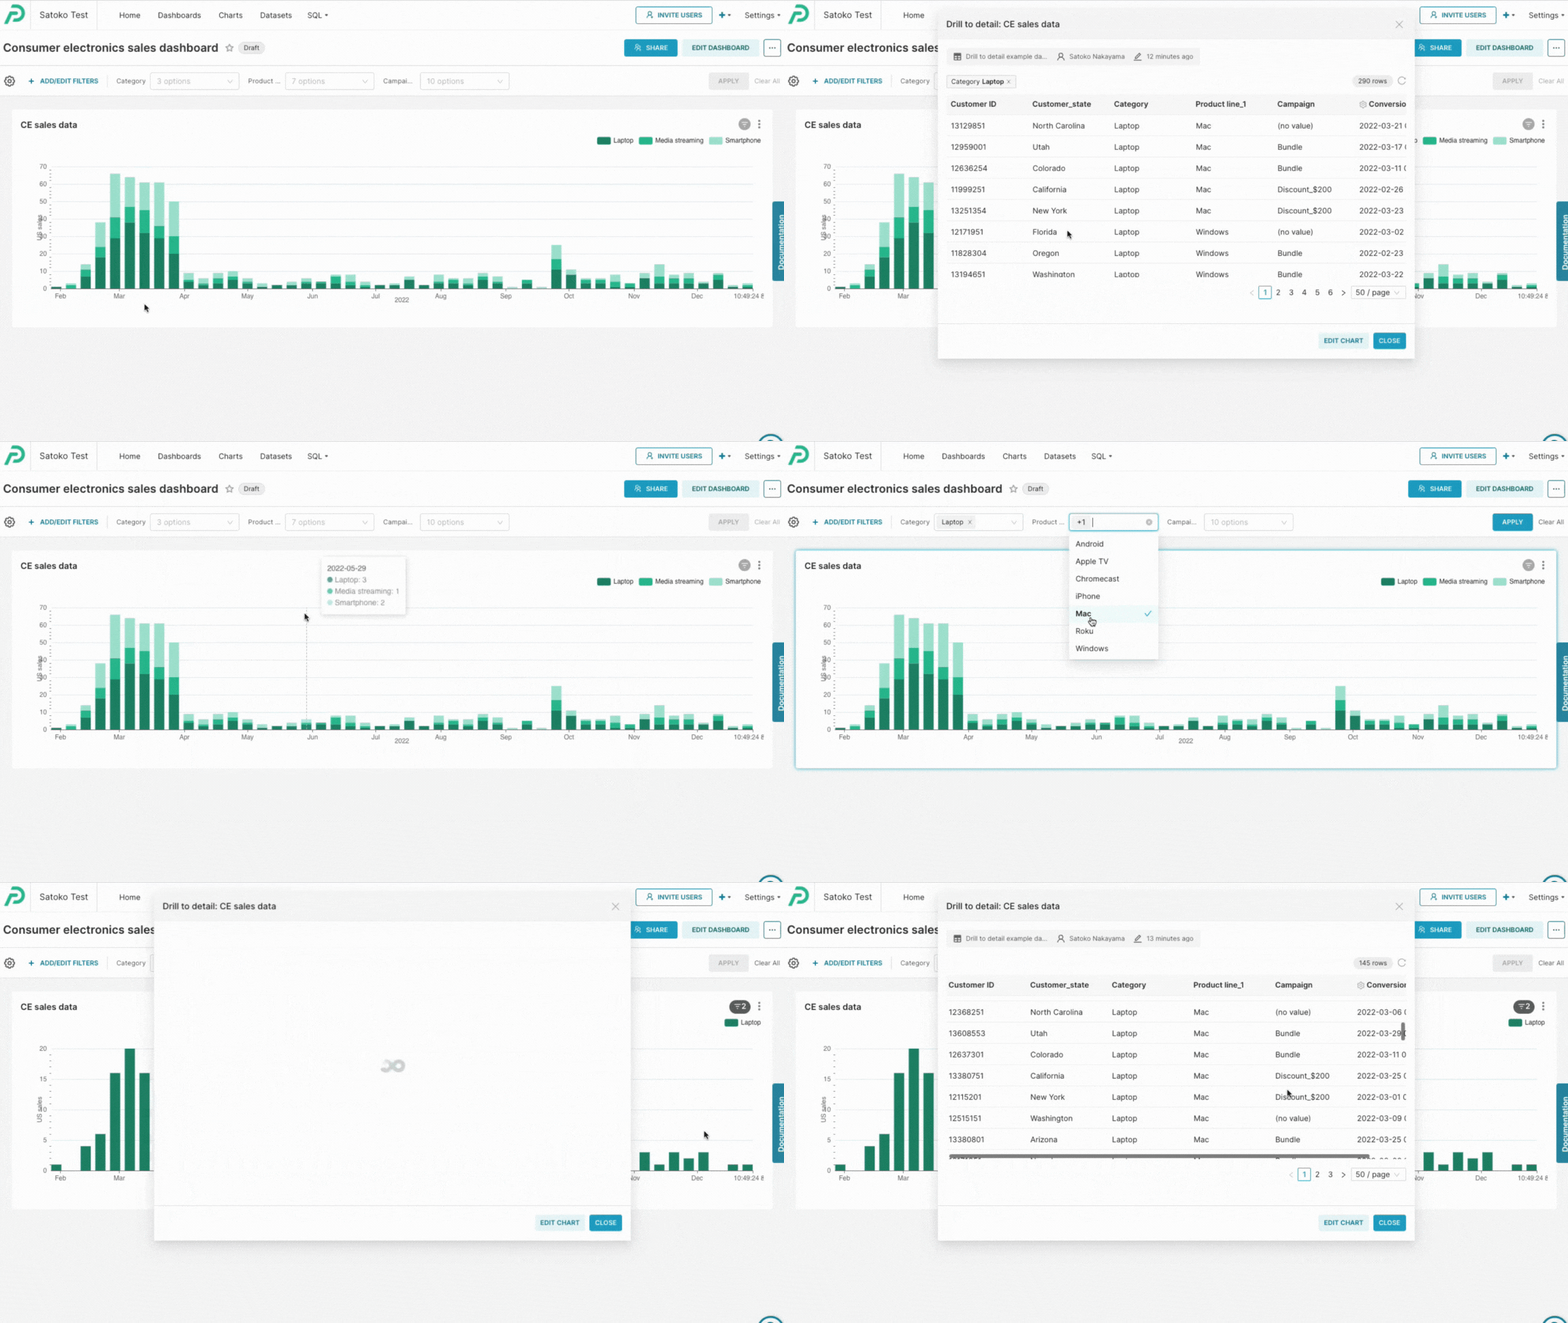
B2C companies (e.g., consumer packaged goods, consumer electronics, and video gaming) run promotional campaigns to drive one-time revenue increases, but the impact and profitability of the campaigns could vary significantly. Further, a campaign that works for one product line, a sales region, or a season may not be the most effective for others. Using Drill-to-Detail and custom filters, you can identify successful campaigns for any combination of criteria you select (Figure 1).

Figure 1: Identify which campaigns drive sales at the category level (laptop) or for a specific product line (Mac). Apply additional filters like ‘month’, ‘sales region’, ‘store ID’, etc to further drill through.
ii) Analyzing marketing funnel performance
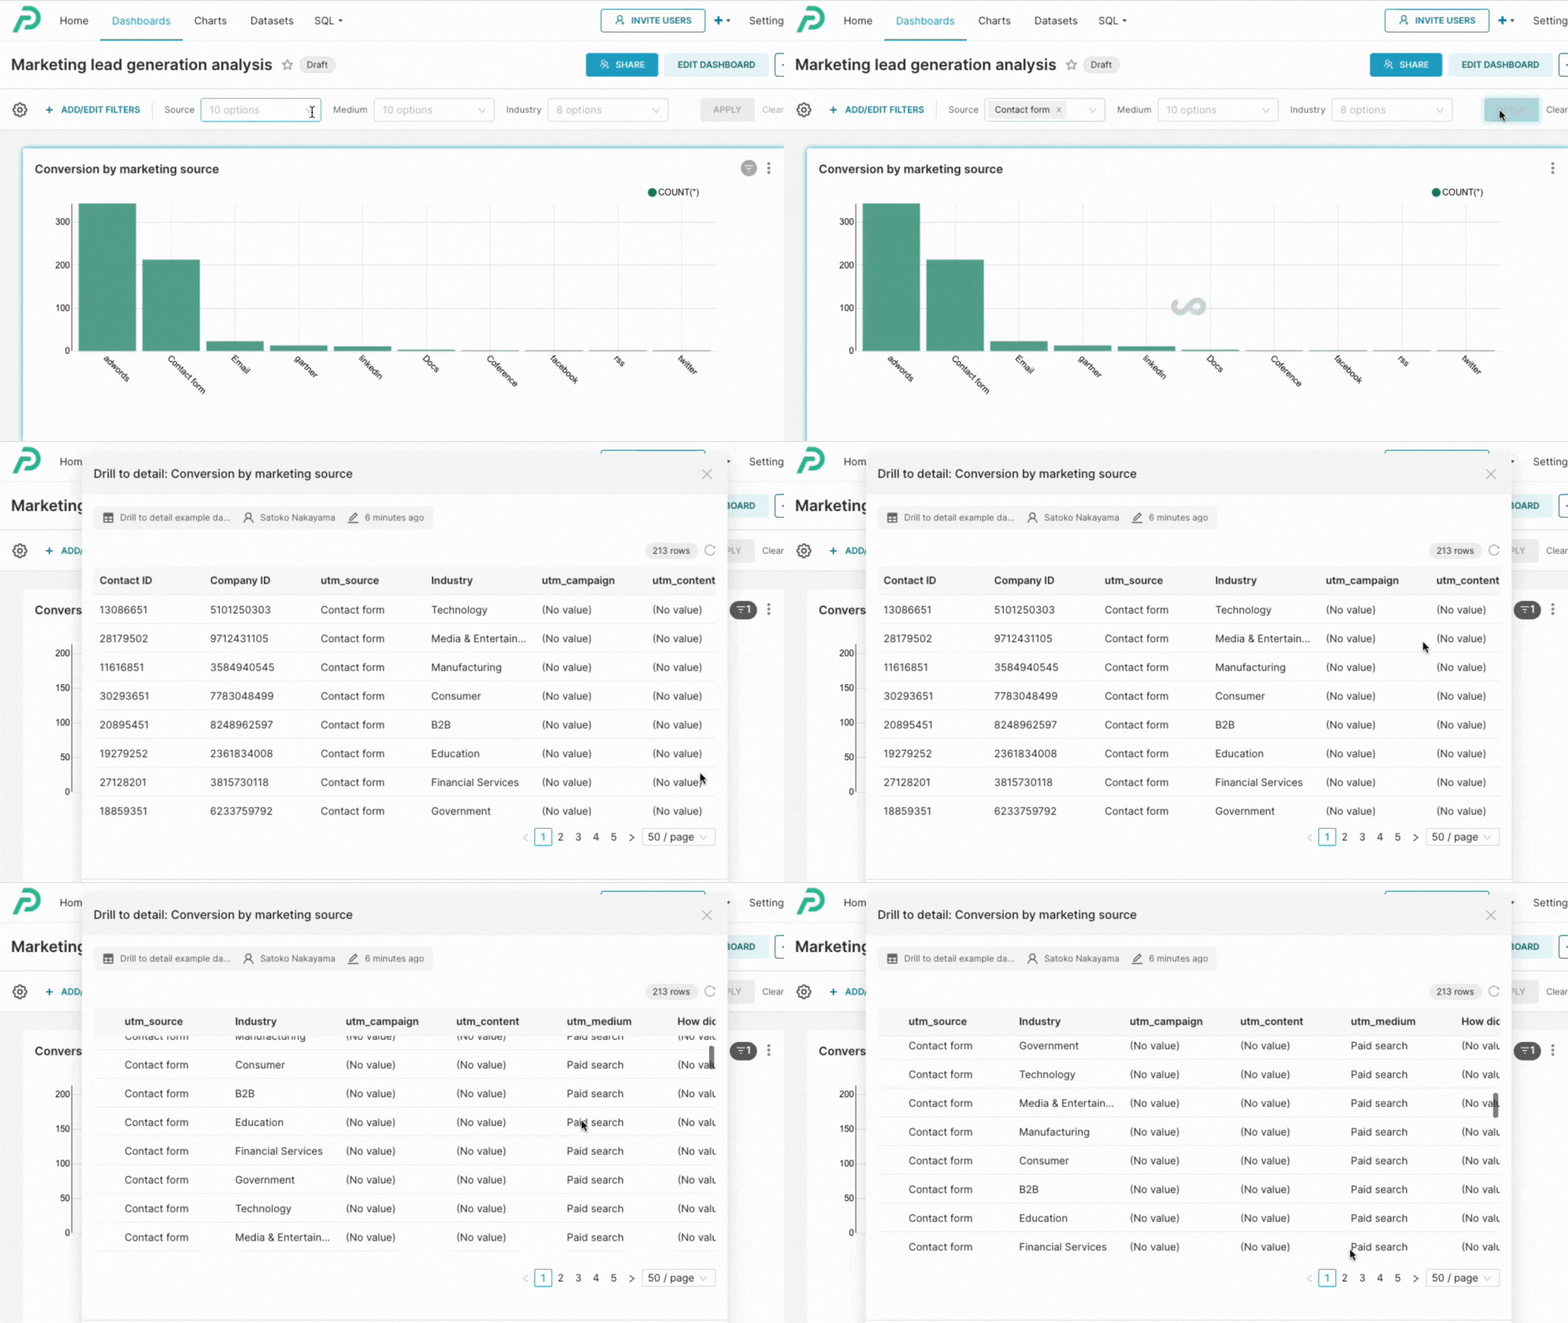
Today’s marketing teams are expected to use data to drive more qualified leads. While they often work with multiple media, sources, and channels, they may be interested in doubling down on the highest ROI channels. Similar to a tool like Google Analytics, Drill-to-Detail and dashboard filters can help you zoom into conversion sources (e.g., contact form, email nurture) and drill into traffic mediums (e.g., organic search, paid search, referrals) to evaluate the key drivers of their marketing funnels (Figure 2).

Figure 2: Explore which mediums are most contributing to leads generated through a web form.
iii) Evaluating operational metrics
Financial institutions rely on data to improve the quality and profitability of loan origination. Common metrics for loan origination may include average loan value, approval rate, abandonment rate, average cycle time, and profit per loan origination. The team may slice and dice historical loan data in different ways to identify performance drivers. Drill-to-Detail can be used to narrow down factors contributing to loan quality.
Get started
Drill-to-Detail is available for all visualization types and dashboards in Preset Cloud and Preset's embedded dashboards. Read the detailed information in our docs to get started. If you are using the open-source Apache Superset, you can access the feature after enabling the DRILL_TO_DETAIL feature flag.
If you are new to Preset, create an account for free to start exploring, or talk to our team to see a product demo.
And lastly, stay tuned for more updates on Drill By in the coming months!