Finding New Insights with Drill By
Data drilling lets users explore granular details behind summary data and understand the factors driving trends or anomalies. Today, we are releasing Drill By in Preset, a new approach to data drilling that enables Preset users to drill into charts and tables in the dashboards by any dataset dimension (column). Drill By makes data analysis easier by allowing the slicing and dicing of data directly in the visualizations and helps to uncover product, business, and operational insights.
In Preset, users at any Role-Based Access level can access the Drill By feature, including Workspace Admins, Contributors, and Viewers, on any subscription plan.
In this blog, we will demonstrate how Drill By works to help you get started with your self-serve analytics in Superset or Preset.
How Drill By differs from Drill-Down
As described in our earlier post, Drill By is built on a contextual menu, offering users a set of choices that are relevant and available for the specific visualization. Drill By is more flexible and versatile than Drill Down, a common drilling approach based on a pre-defined hierarchy of dimensions. This means that someone from the data team would need to invest a significant amount of upfront work in defining the hierarchy in order for the Drill Down feature to be useful.
Drill By performs the “group by” function on a dimension the user selects from a chart’s contextual menu and applies a filter for the column value selected. For instance, you may filter on a dimension ‘vehicles’ to expose the data split by any of ‘manufacturer’, ‘vehicle type’, ‘vehicle color’, or ‘make year’ and in any order. With Drill Down, on the other hand, you would only be able to filter on one dimension (e.g., ‘manufacturer’) or in a specific order because it is built based on a curated list of columns going in the downward direction to act as a shortcut.
Using Drill By in Preset
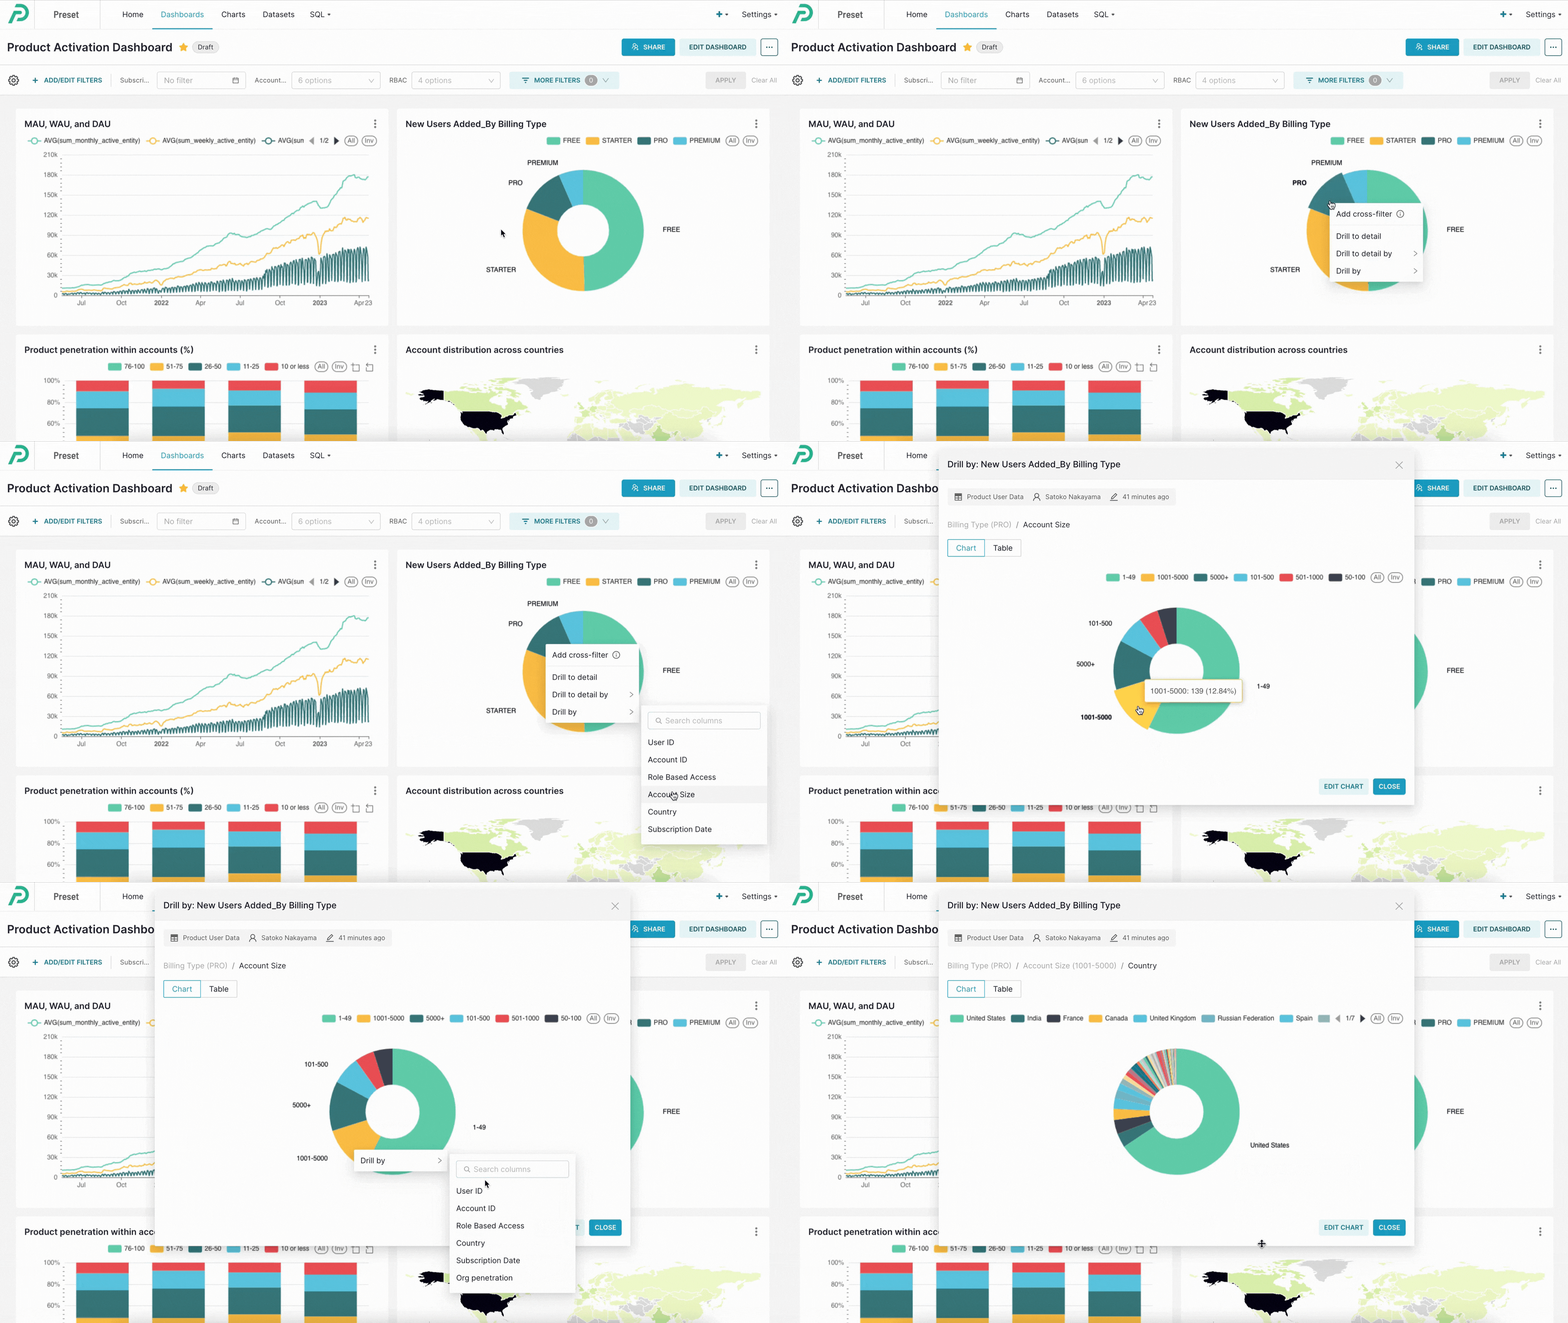
To use Drill By, hover over a Preset chart1, and right-click on a dimension to filter on. A set of dimensions you can group by the data will be displayed. You can apply multiple Drill By operations to the chart.

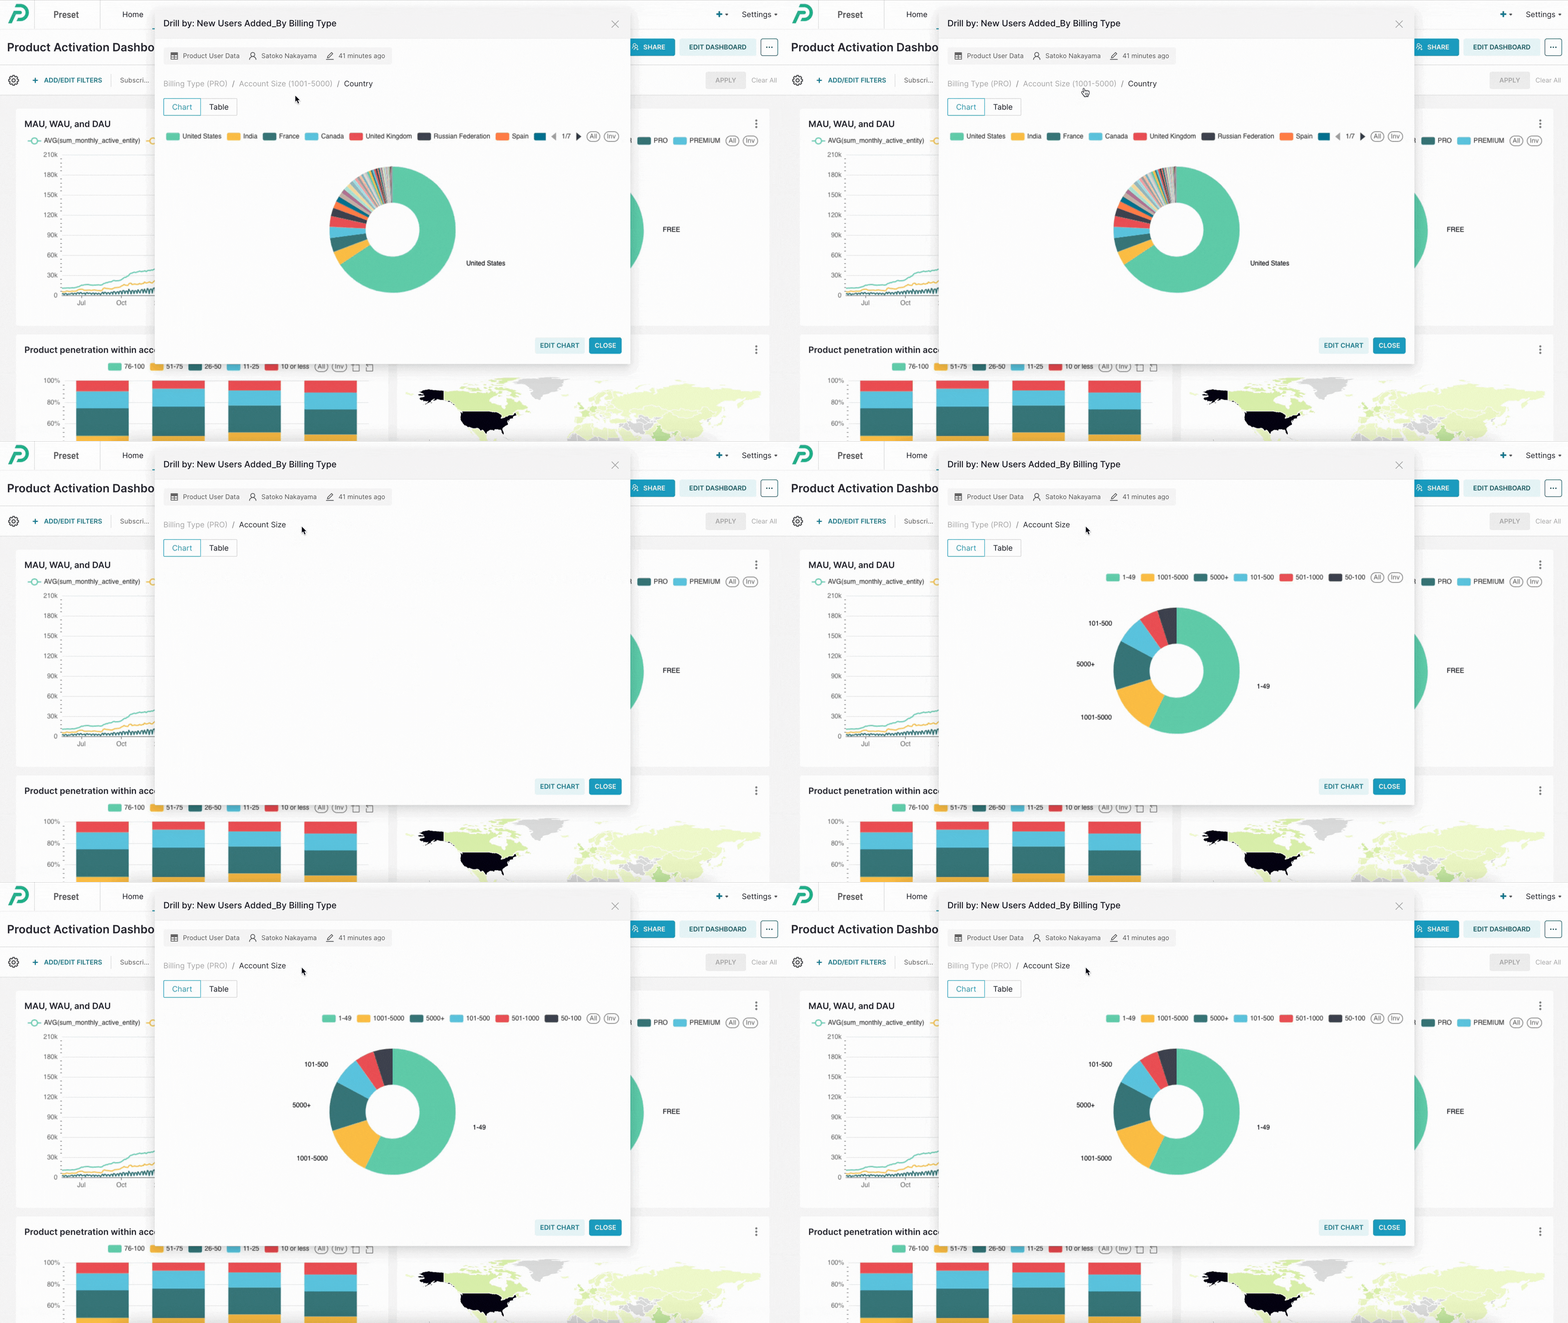
To return to the previous column (or earlier drilling operations), click on the breadcrumbs (previously used columns) in the modal.

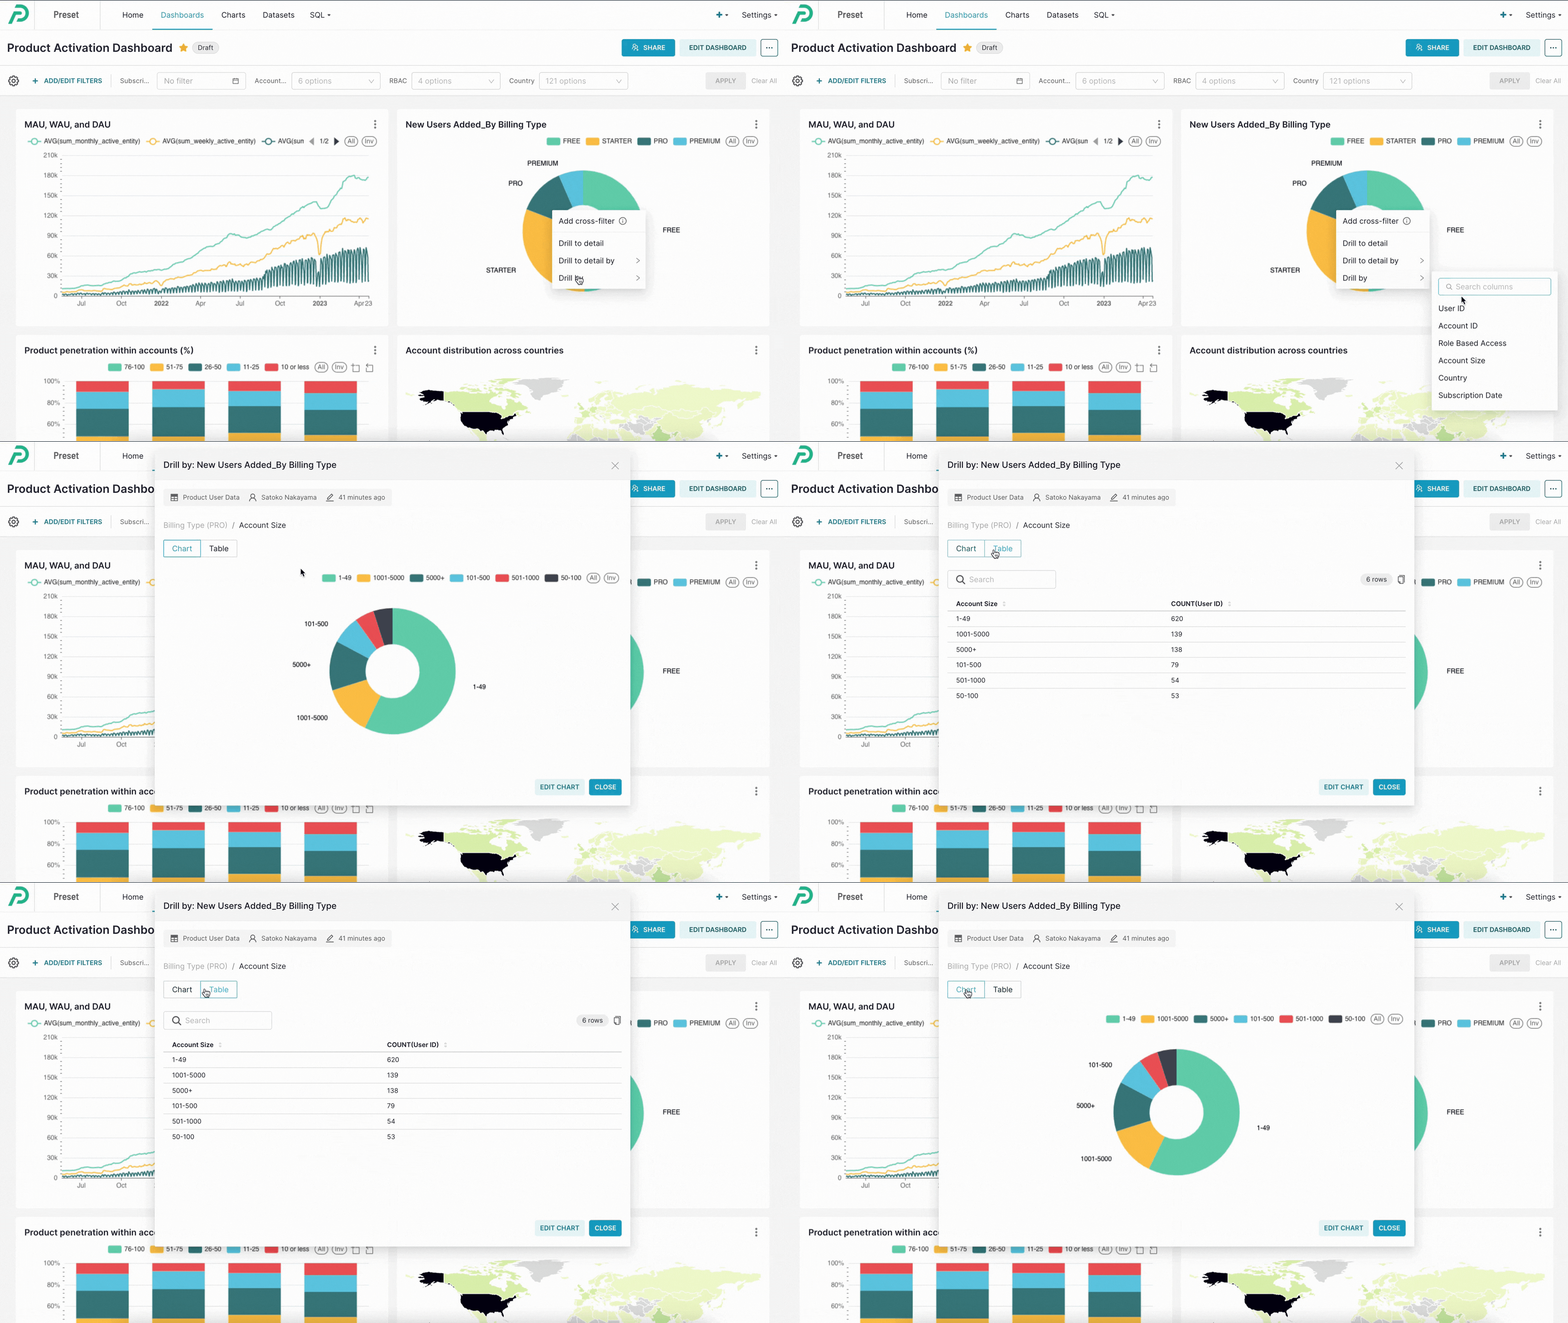
Switching between chart and table views
You can also view queried data in a tabular format.

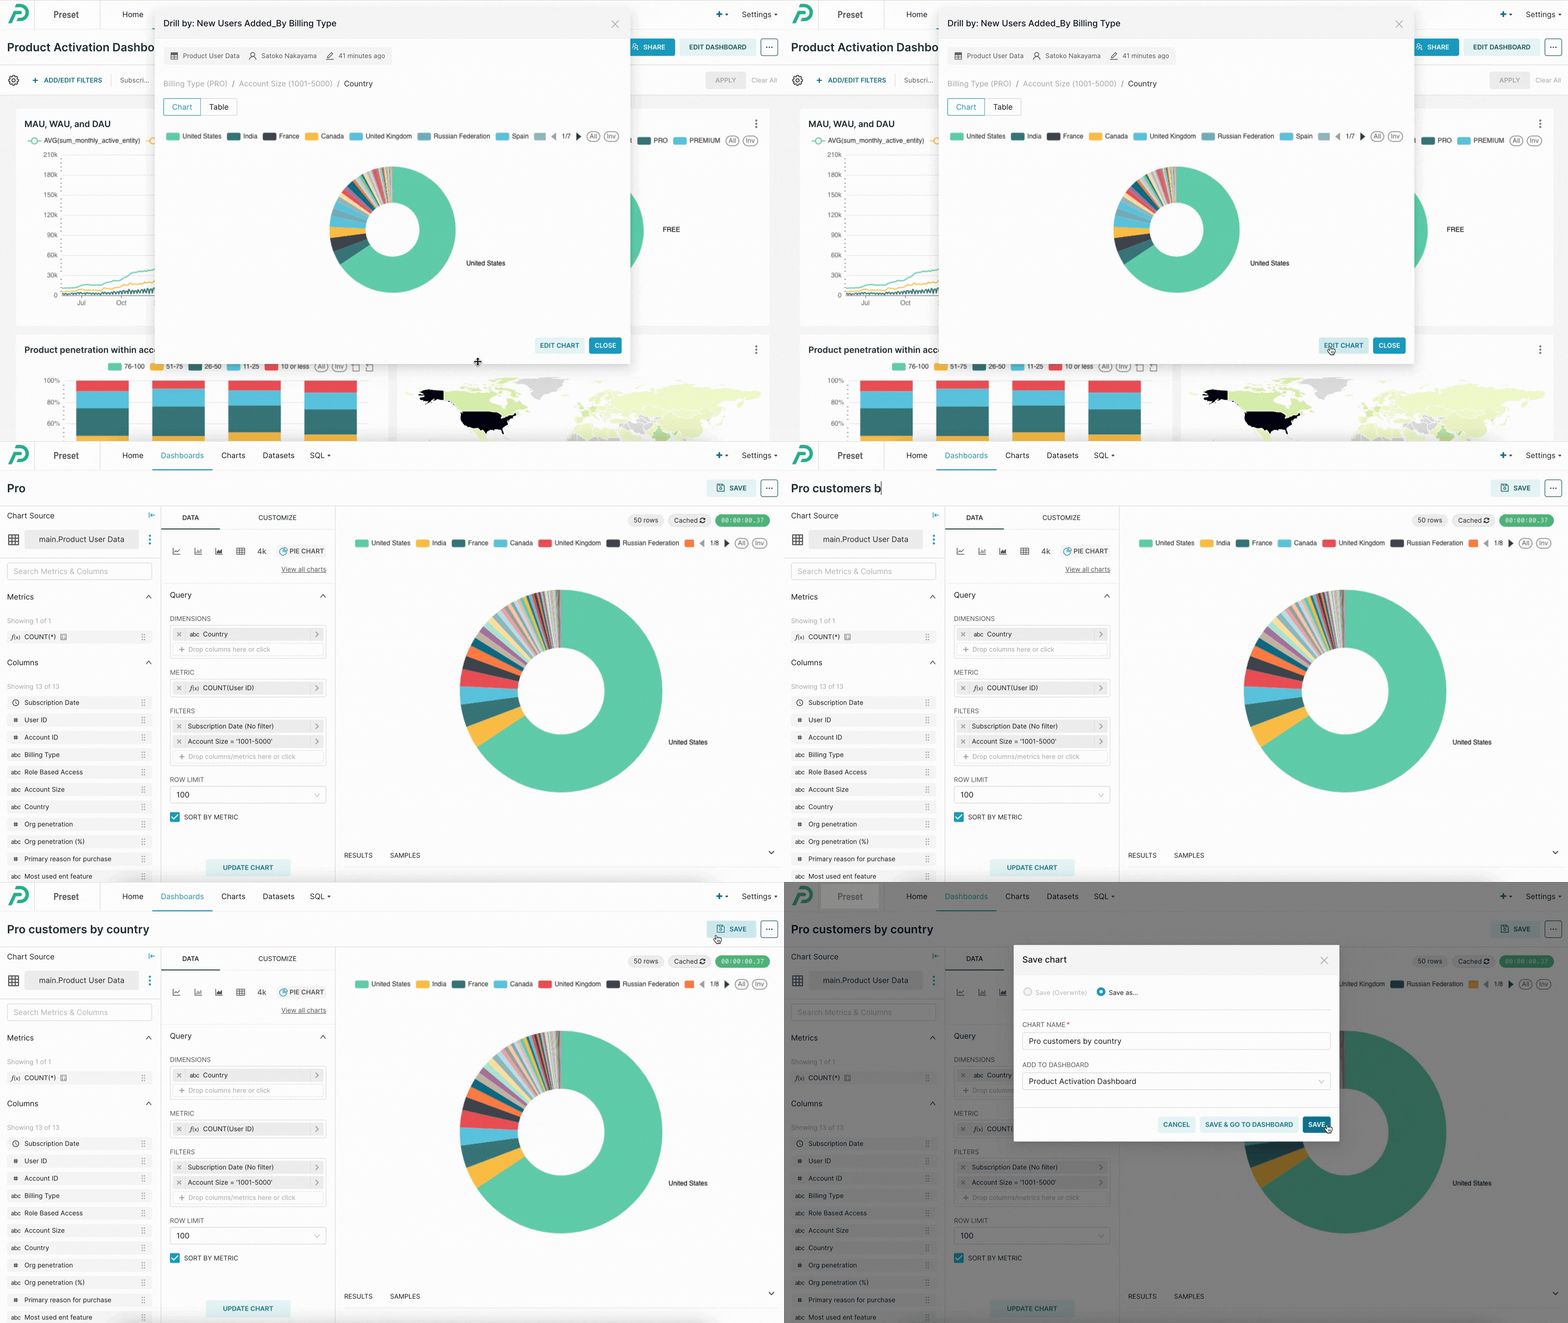
Creating new charts from Drill By operation
You can create and save the drilled results as a new chart, allowing you to add it to your dashboard or access it later. To do so, click on the “Edit chart” action in the Drill By modal in the Dashboard view (i.e., you don’t need to go to the Chart Builder!).

Supported chart types
Drill By is supported by popular Preset chart types including:
- Area Chart
- Bar Chart
- Box Plot
- Funnel Chart
- Gauge Chart
- Graph Chart
- Line Chart
- Mixed Chart
- Pie Chart
- Pivot Table
- Radar Chart
- Scatter Plot
- Smooth Line Chart
- Stepped Line Chart
- Table Chart
- Tree Chart
- Tree Map
- World Map
Try it yourself!
To start using the Drill By feature, log into your Preset account or create one for free in a few minutes. Follow our documentation to learn about how Drill By works in detail.