


Building Custom Viz Plugins in Superset v2 (Updated for Monorepo)


New viz plugin system
In July 2020, we published a blog post on how to create a custom "Hello World" visualization plugin for Apache Superset.
Back then Superset was based on a multirepo architecture, with the core logic split across two distinct code bases. Since then the architecture has changed significantly, and hence the steps detailing how to create a viz plugin are no longer up to date.
In this blog post we'll walk through what has changed since, and show how a viz plugin can now be created with much less effort than before.
History
(If you just want to skip to the juicy parts with code, feel free to proceed to the "Hello World v2" section!)
As recently as November 2021, Superset was still a multirepo, with the application-specific frontend logic contained in the apache/superset GitHub repo, and the key visualization-related logic in the apache-superset/superset-ui repo, with packages being published to the @superset-ui npm organization. The superset-ui project was originally started as an independent project following SIP-4, which aimed to make it possible to embed Superset charts in external web applications using React. The project also set a high standard for code quality, with all core code being written in TypeScript and CI checks ensuring 100 % test coverage.
However, while the project was originally independent of the Apache Superset project, over time superset-ui became a key component in the main Superset codebase in the form of a set of npm dependencies. Later on, the default visualizations were also relocated to superset-ui to centralize all core visualization code in a single repo.
While the stricter CI rules on superset-ui helped improve the quality of the default visualizations and core functionality, the added overhead of managing a distributed codebase and constantly having to pull in new versions of superset-ui to the main repo became increasingly unsustainable.
To streamline the process, SIP-58 set out to relocate superset-ui to the main repo, centralizing all code in one place and creating a single monorepo.
A few key benefits of the proposed SIP included:
- Changes that previously required multiple Pull Requests across multiple repos could now be contained in a single PR
- Simpler dependency management thanks to all dependencies being defined in a single place
- The possibility of cherry-picking
superset-uiPRs into release branches - Simpler developer experience, removing the need for npm linking.
After a huge migration effort carried out primarily by Yongjie Zhao, some 430k+ lines of code (originally 1900+ individual PRs) were migrated over to the main repo to create a single massive monorepo, and in the process, making the old superset-ui repo redundant.
Hello World v2
In order to create a custom viz plugin, you need the following:
- MacOS or Linux (Windows is not officially supported, but may work)
- Node.js 16
- npm 7 or 8
In addition, you need general familiarity with React and the npm/Node.js system.
To get started, you need the Superset Yeoman Generator. It is recommended to use the version of the template that ships with the version of Superset you are using. This can be installed by doing the following:
npm i -g yo
cd superset-frontend/packages/generator-superset
npm i
npm link
Here we first install Yeoman, and then install the Superset plugin generator template from the Superset repo.
After this you can proceed to create your viz plugin. Create a new directory for your viz plugin with the prefix superset-plugin-chart- and run the Yeoman generator:
mkdir /tmp/superset-plugin-chart-hello-world
cd /tmp/superset-plugin-chart-hello-world
yo @superset-ui/superset
After that the generator will ask a few questions (the defaults should be fine):
$ yo @superset-ui/superset

     _-----_     ╭──────────────────────────╮
    |       |    │      Welcome to the      │
    |--(o)--|    │    generator-superset    │
   `---------´   │        generator!        │
    ( _´U`_ )    ╰──────────────────────────╯
    /___A___\   /
     |  ~  |
   __'.___.'__
 ´   `  |° ´ Y `

? Package name: superset-plugin-chart-hello-world
? Description: Hello World
? What type of chart would you like? Regular chart
   create package.json
   create .gitignore
   create babel.config.js
   create jest.config.js
   create package-lock.json
   create README.md
   create tsconfig.json
   create src/index.ts
   create src/plugin/buildQuery.ts
   create src/plugin/controlPanel.ts
   create src/plugin/index.ts
   create src/plugin/transformProps.ts
   create src/types.ts
   create src/SupersetPluginChartHelloWorld.tsx
   create test/index.test.ts
   create test/__mocks__/mockExportString.js
   create test/plugin/buildQuery.test.ts
   create test/plugin/transformProps.test.ts
   create types/external.d.ts
   create src/images/thumbnail.png
To build the viz plugin, run the following commands:
npm ci
npm run build
This step pulls in the dependencies, builds the package and runs the predefined unit tests under the test/ subdirectory. Alternatively, to run the viz plugin in development mode (rebuilding whenever changes are made to the code), start the development server with the following command:
npm run devTo add the package to Superset, go to the superset-frontend subdirectory in your Superset source folder and run the following command:
npm i -S /tmp/superset-plugin-chart-hello-worldAfter this edit the superset-frontend/src/visualizations/presets/MainPreset.js and make the following changes:
import { SupersetPluginChartHelloWorld } from 'superset-plugin-chart-hello-world';Next, import the viz plugin and add the following to the array that's passed to the plugins property:
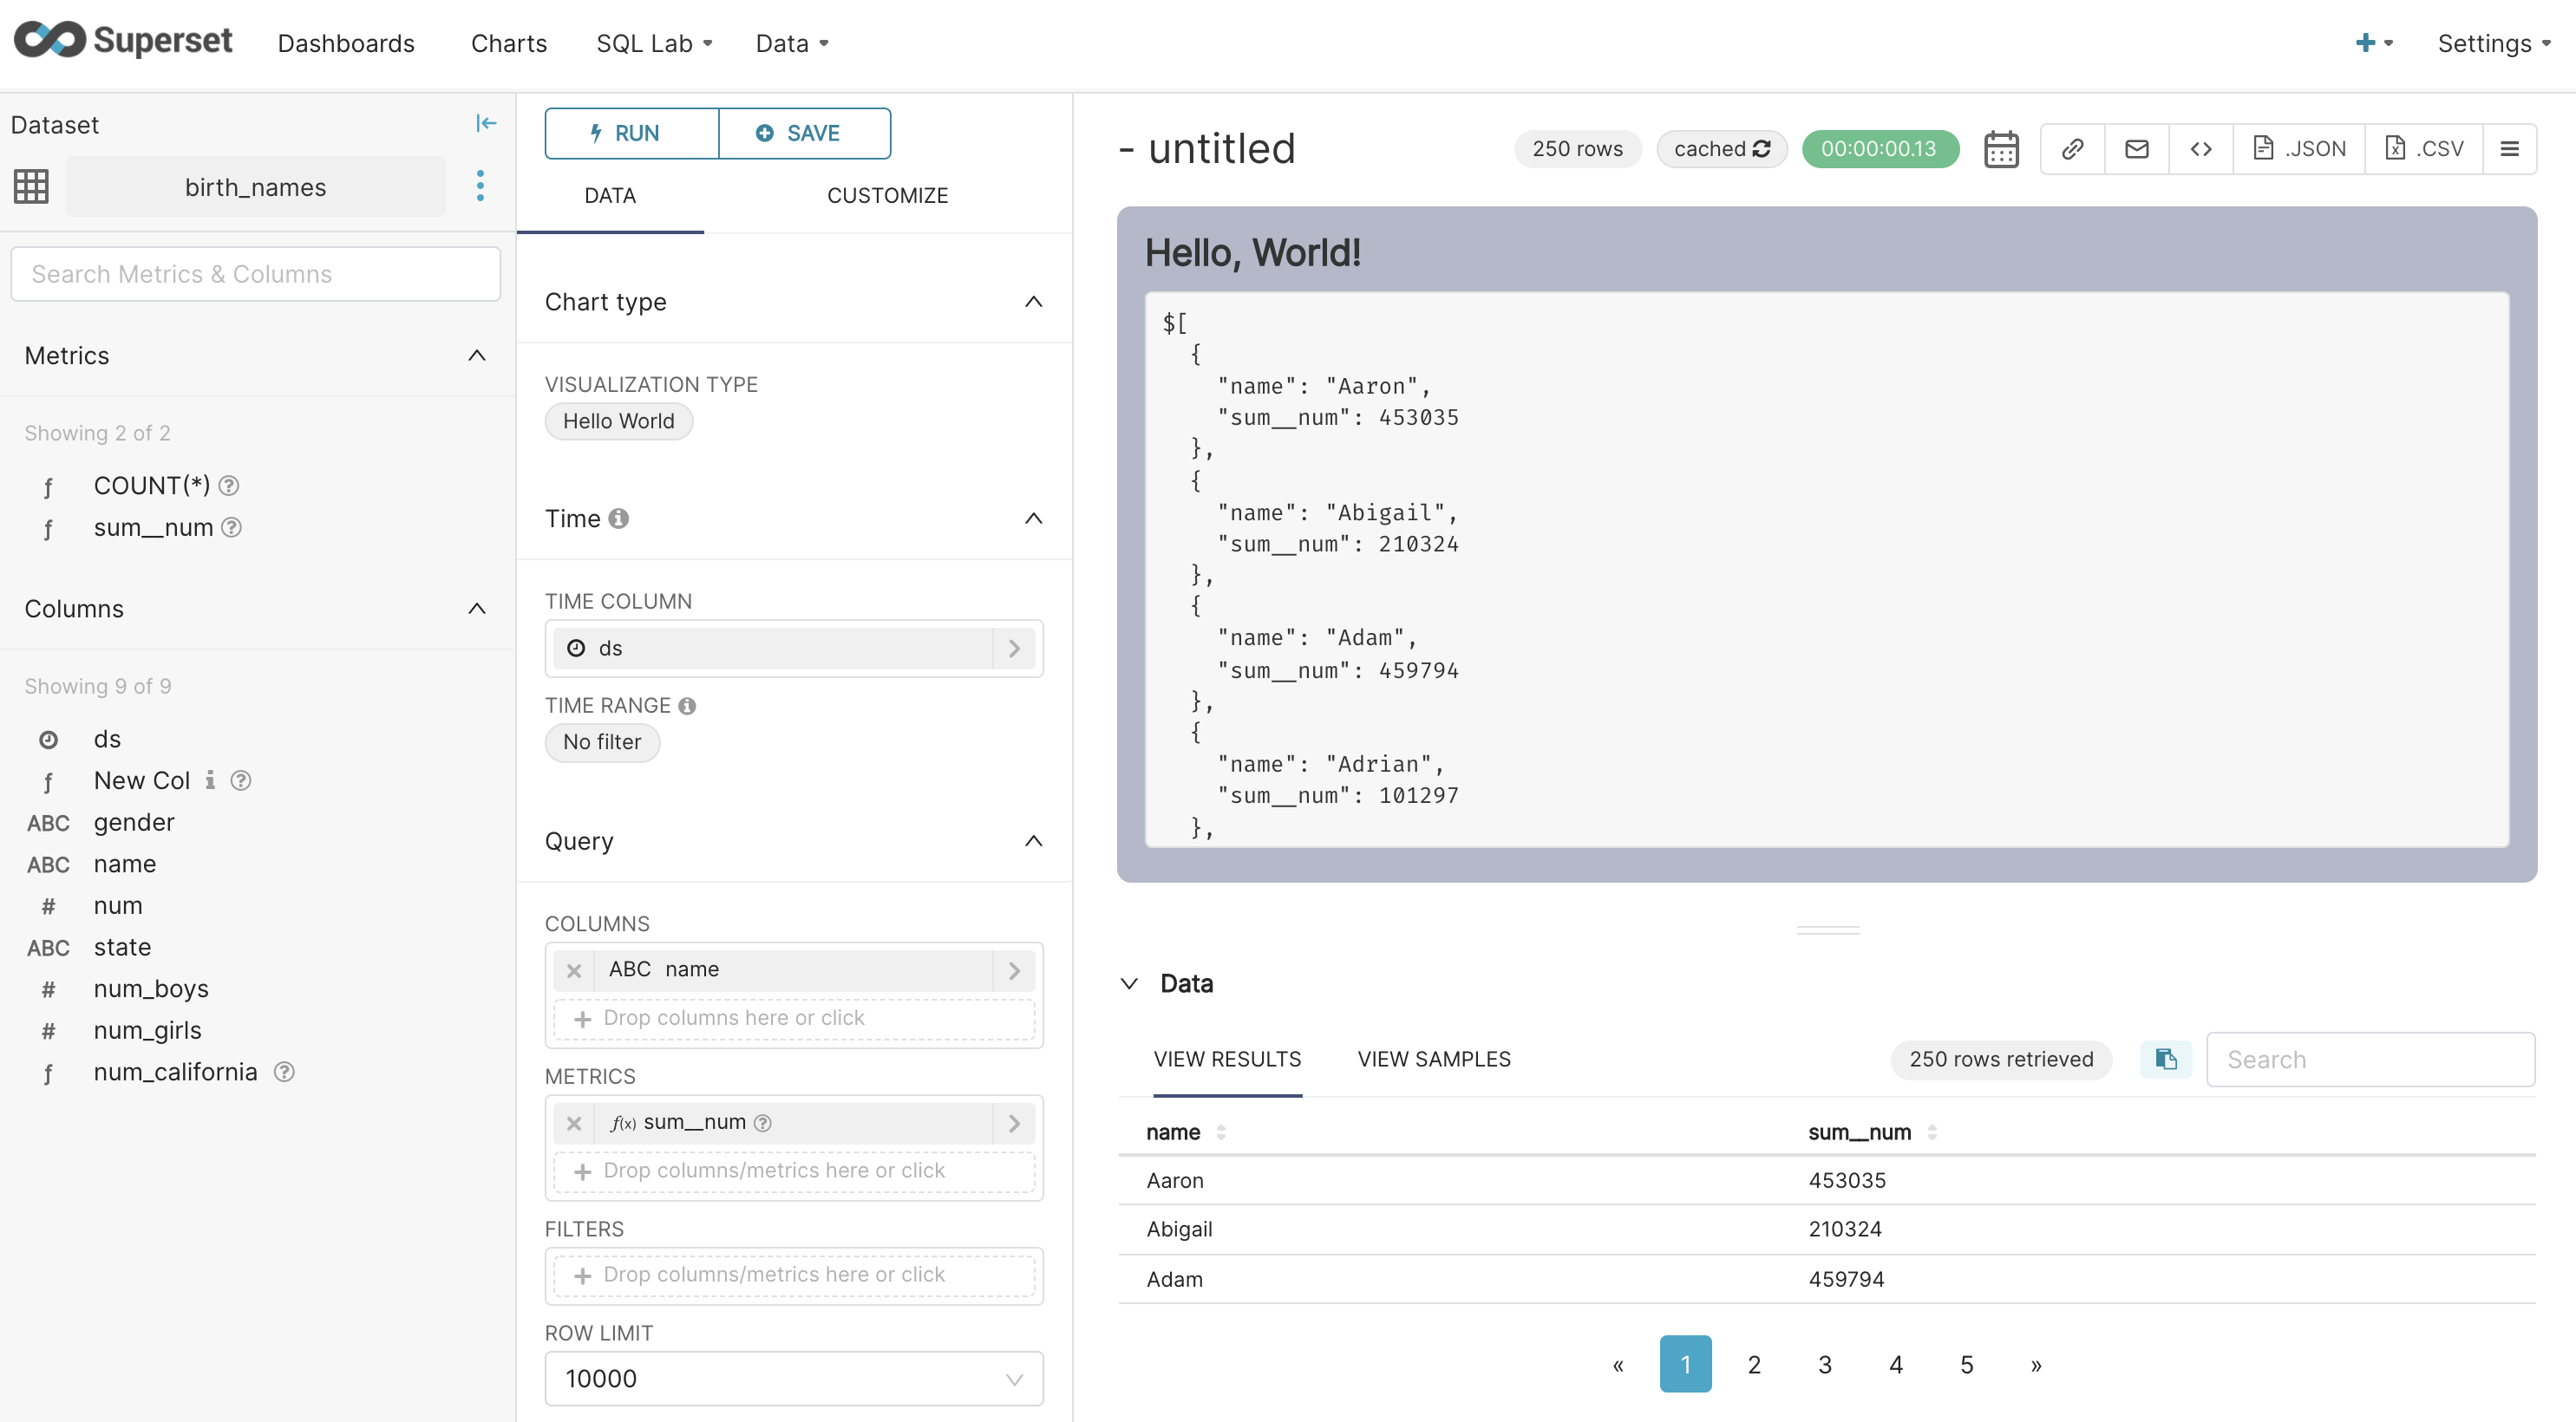
new SupersetPluginChartHelloWorld().configure({ key: 'ext-hello-world' }),After that the viz plugin should show up when you run Superset, e.g. the development server:
npm run dev-serverWhen you enter the Explore view and open the chart picker, a new chart type "Hello World" can be found:
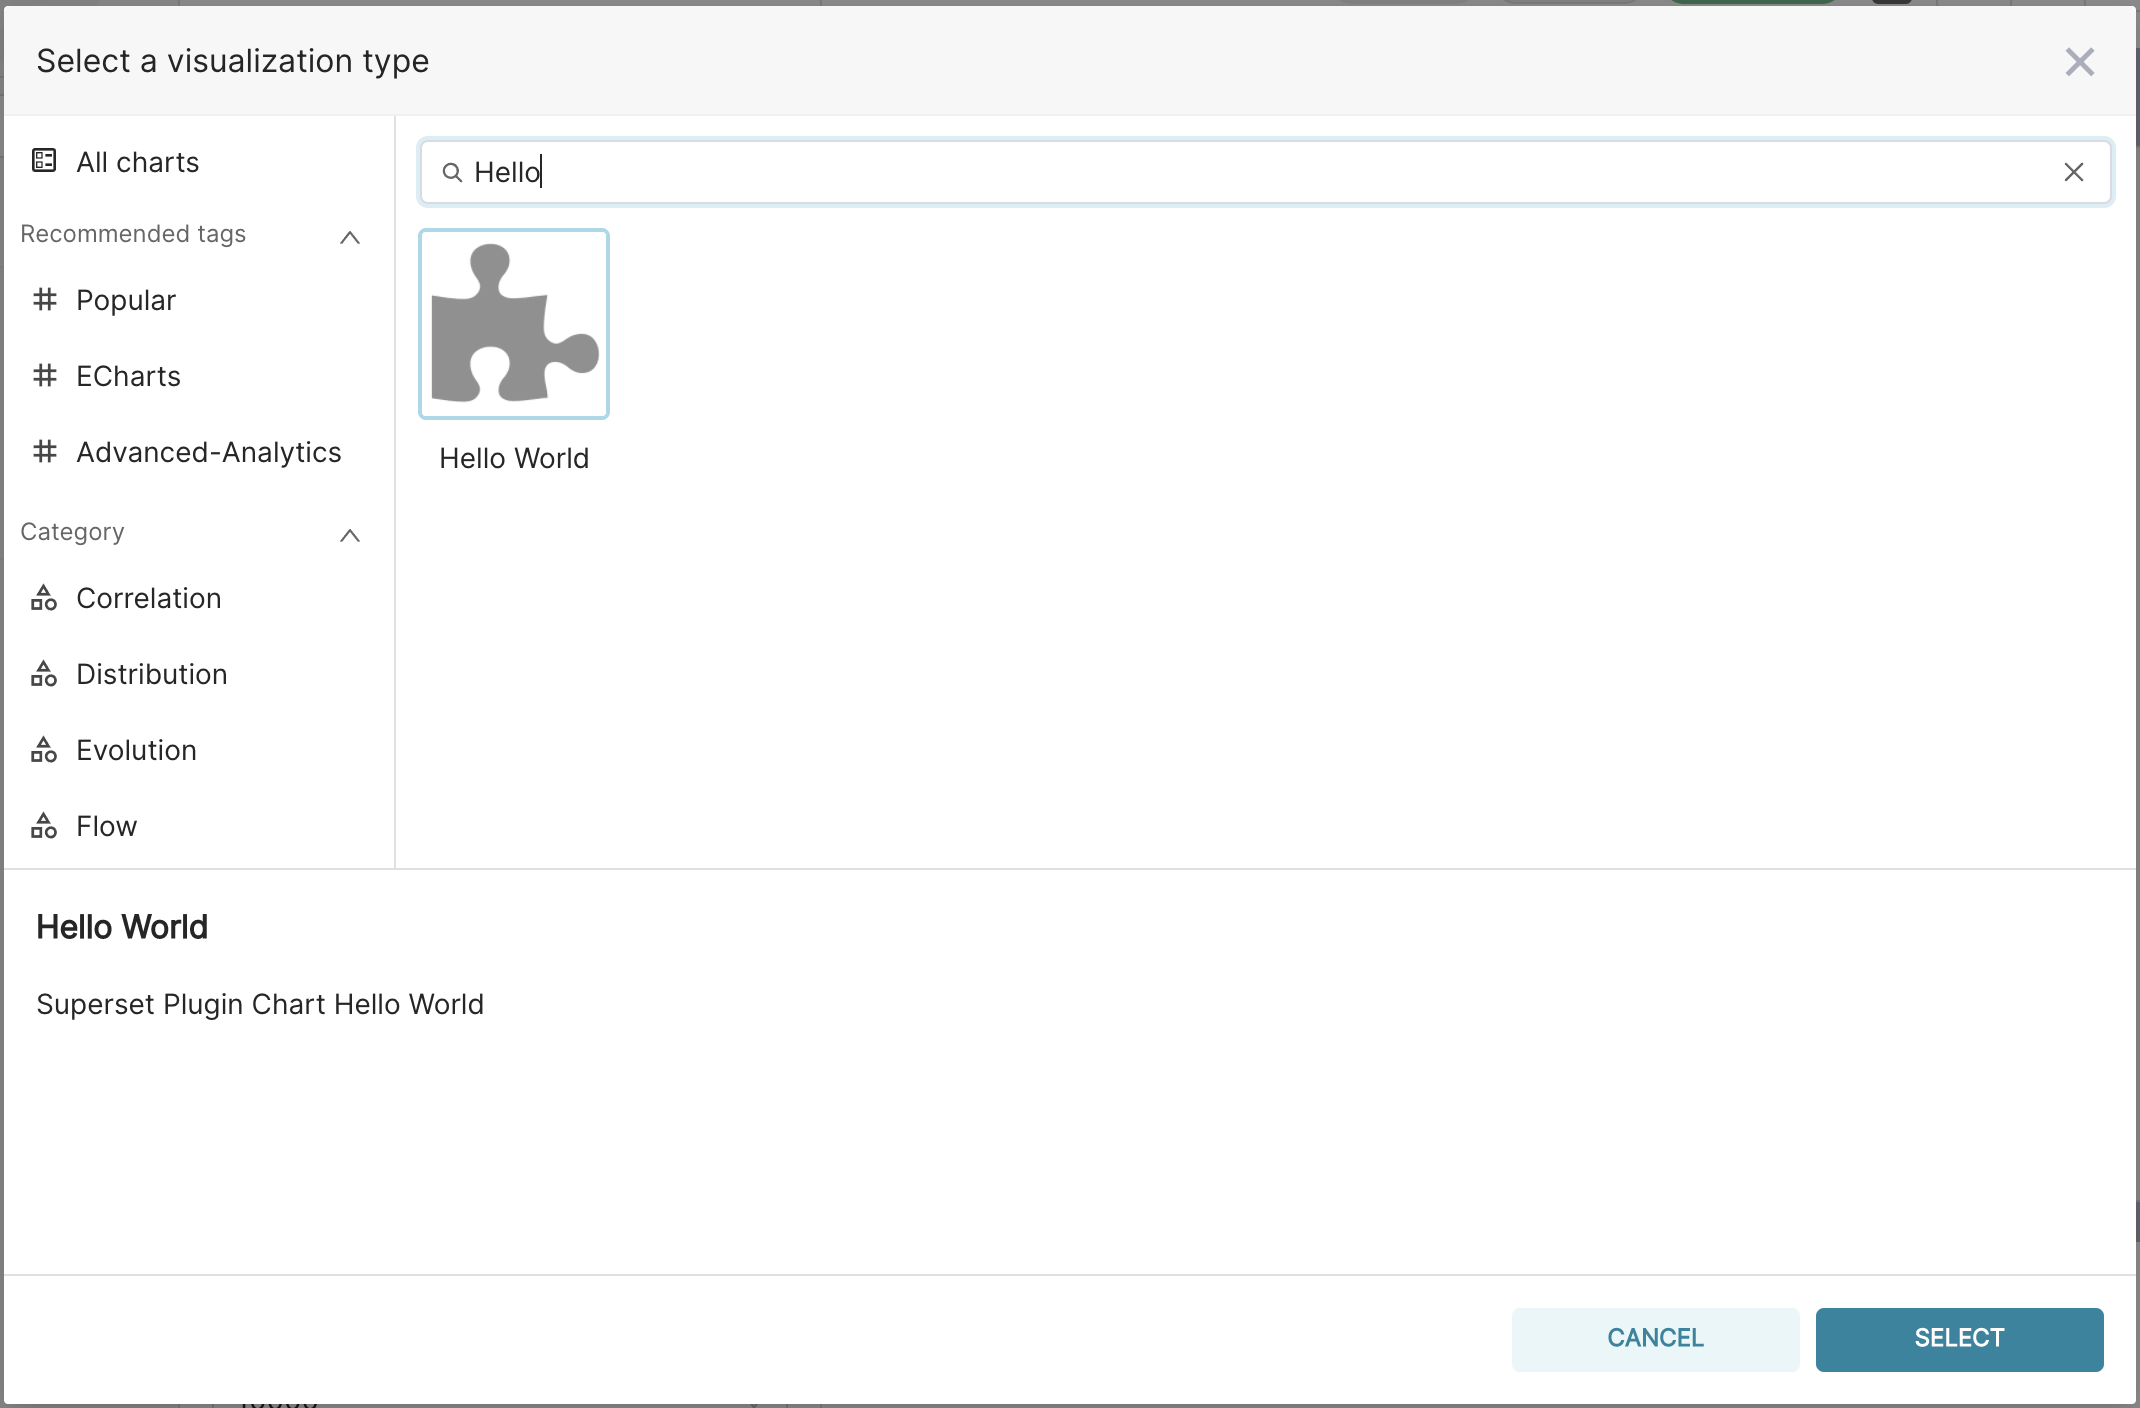
Sure enough, that's the same ol' boring Hello World from the original Blog Post, but with way fewer steps, and no npm linking!
And with that, you're just one npm publish away from sharing your plugin with the whole Superset community.
A less boring example
Now, to demonstrate how to create a real viz plugin, we decided to try out the Ant Design Charts visualization library to create a liquid chart that visualizes how full/ready something is. To get started, we followed the steps outlined above, but running the Yeoman generator in a directory called superset-chart-plugin-liquid.
After the default code was created, we added the package @ant-design/charts to the package dependencies by issuing the following command:
npm i -S @ant-design/chartsUsually, when creating a new chart type, the following files need to be updated:
-
src/types.ts: the types that your plugin uses -
src/Liquid.tsxthe actual plugin code -
src/plugin/buildQuery.ts: the hook that creates the chart data request payload. Usually you can leave this unchanged and start customizing it later as your plugin becomes more complex. -
src/plugin/transformProps.ts: the hook that receives data from the backend and returns that final data that's passed to the plugin (in this exampleLiquid.tsx)
In addition, you'll usually want to provide a thumbnail and some example screenshots, but that can wait for now.
First we updated the control panel by adding a "Customize"-section, to make it possible to customize the shape of the chart, removing the example code and comments along the way. The new Customize section looks as follows (a dropdown where the user can choose the shape):
{
  label: t('Customize'),
  expanded: true,
  controlSetRows: [
    [
      {
        name: 'shape',
        config: {
          type: 'SelectControl',
          label: t('Shape'),
          default: 'rect',
          choices: [
            // [value, label]
            ['circle', t('Circle')],
            ['diamond', t('Diamond')],
            ['triangle', t('Triangle')],
            ['pin', t('Pin')],
            ['rect', t('Rectangle')],
          ],
          renderTrigger: true,
          description: t('What shape does the chart have'),
        },
      },
    ],
  ],
}
After that, we clean up the transformProps.ts file, which mostly just passes the relevant data back to the plugin.
Finally, we implement the plugin itself in Liquid.tsx. To avoid unnecessary rerenders, we memoize the config object based on the relevant props and pass the object to the Liquid component that we've imported from @ant-design/charts:
const config = useMemo(() => ({
    percent: percentage,
    outline: {
      border: 2,
      distance: 4,
    },
    shape,
    wave: {
      length: 128,
    },
    width,
    height,
    autoFit: false,
  }),
  [height, width, percentage, shape],
);
Finally, we return the component that's rendered based on our config above:
return (
  <Styles
    ref={rootElem}
    height={height}
    width={width}
  >
    <AntvLiquid {...config} />
  </Styles>
);
That's it! After starting the plugin development server by running npm run dev and adding the plugin to Superset, the following chart appears:
To see the code for this plugin check out the following GitHub repo. This plugin is also available as an npm package for you to try!
Here are some additional helpful links:
