


Chart Documentation for Superset and Preset


Apache Superset and Preset ship with a large variety of visualization types. Paired with the powerful no-code chart builder, you can craft beautiful and useful charts powered by your own team's datasets. Here's an overview of some of the charts that are available:

Chart Walkthroughs
At Preset, we maintain world class documentation on all things Superset and Preset. Today, I'm excited to announce a big leap forward in our chart walkthroughs documentation!
We now have detailed documentation for the 20 most requested and used charts in both Superset and Preset.
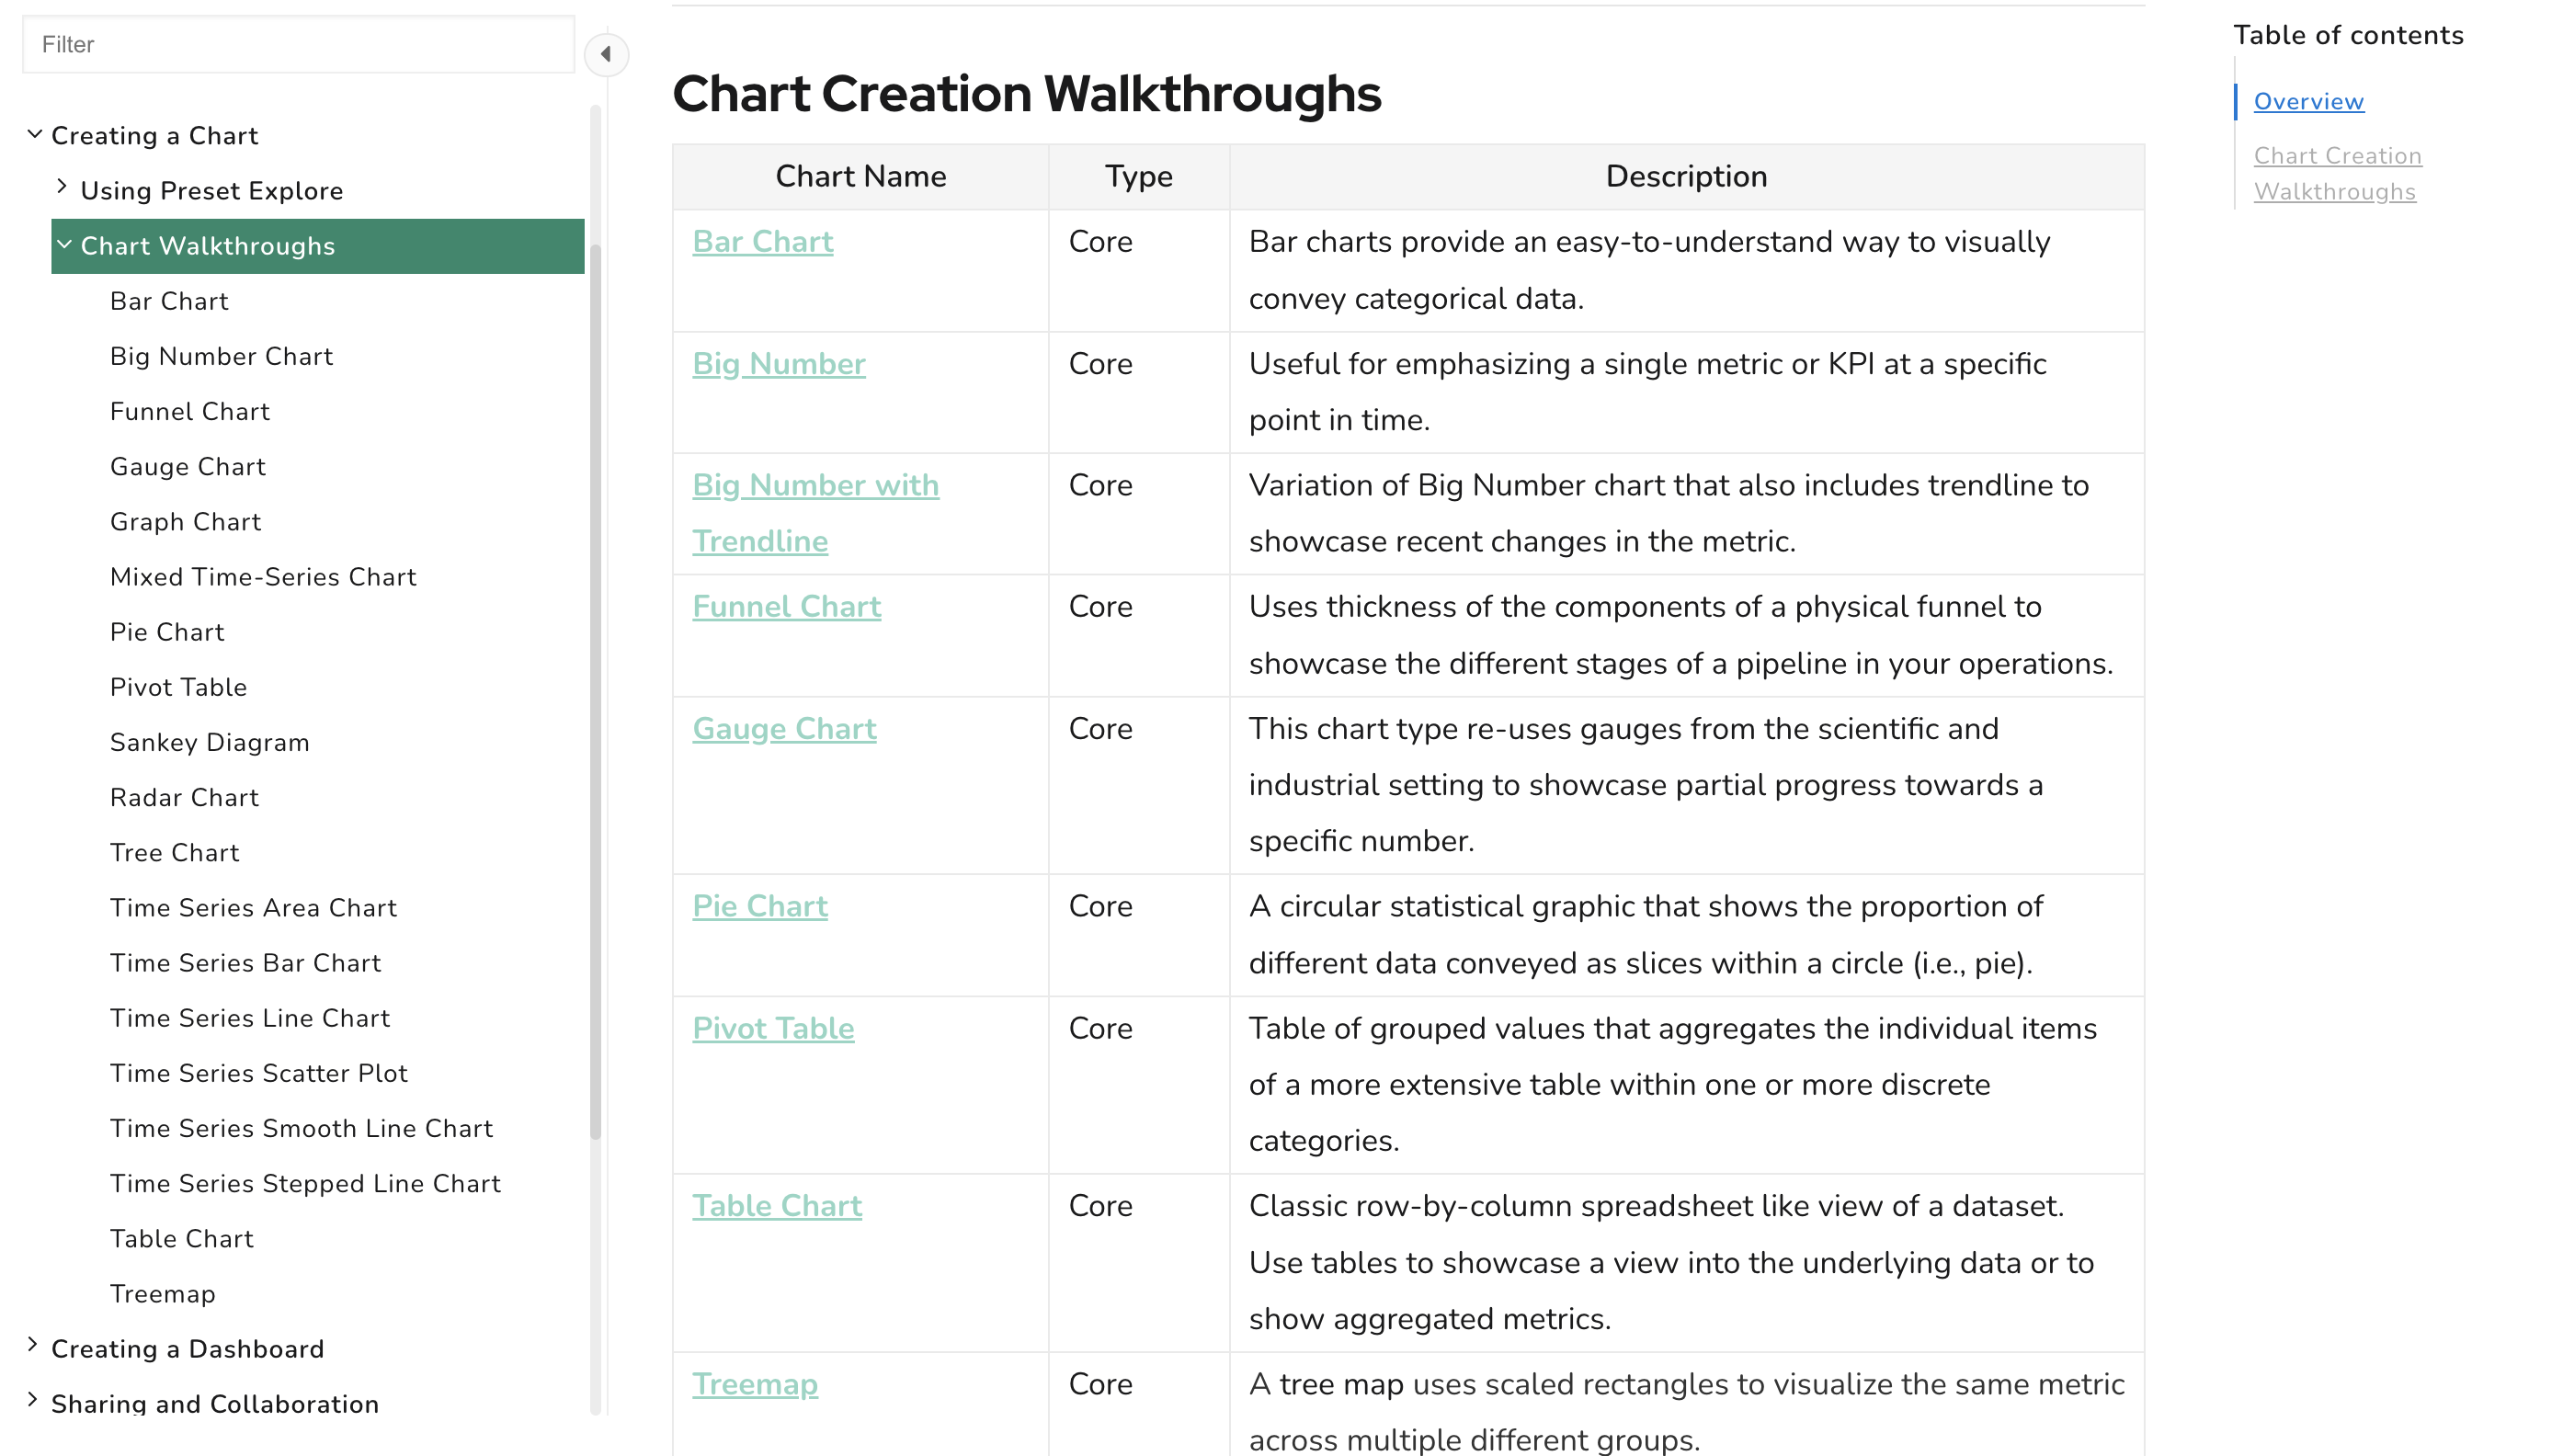
Here's a full list of the charts that have detailed documentation:
- Bar Chart
- Big Number
- Big Numer with Trendline
- Funnel Chart
- Gauge Chart
- Pie Chart
- Pivot Table
- Table
- Treemap
- Mixed Time-series Chart
- Time-series Area Chart
- Time-series Bar Chart
- Time-series Line Chart
- Time-series Scatter Plot
- Time-series Smooth Line Chart
- Time-series Stepped Line Chart
- Graph Chart
- Radar Chart
- Sankey Diagram
- Tree Chart
For each article, you will find:
- a few examples of the chart type in action
- the key settings in the no-code Explore experience and what they mean
- how to structure your data and / or the SQL that is generated for you
- options for Customizing your chart further
- and more!
To showcase the documentation improvements, let's focus on a specific example.
The graph chart is one of the 3 charts that helps you visualize links between groups or entities. In the chart documentation, we demonstrate how an individual row in your dataset maps to the visualization. We then go on to show how the shape of your data and the choices you made in Explore affect the generated SQL query:
.png)
Next Steps
While we started with the most frequently requested chart types, we're not stepping there! We will be expanding the chart walkthroughs to eventually cover all of the charts. Want to try these visualizations? Explore Preset Cloud for a fully managed experience.
Subscribe to our blog to get notified when we expand and document more charts (I'm looking at you, geospatial charts). Happy charting!
