
2021 Visual Recap of the Apache Superset Project
In 2021, the Apache Superset project and the community surrounding it continued to grow and mature.
Growth
Github Stars and PR's
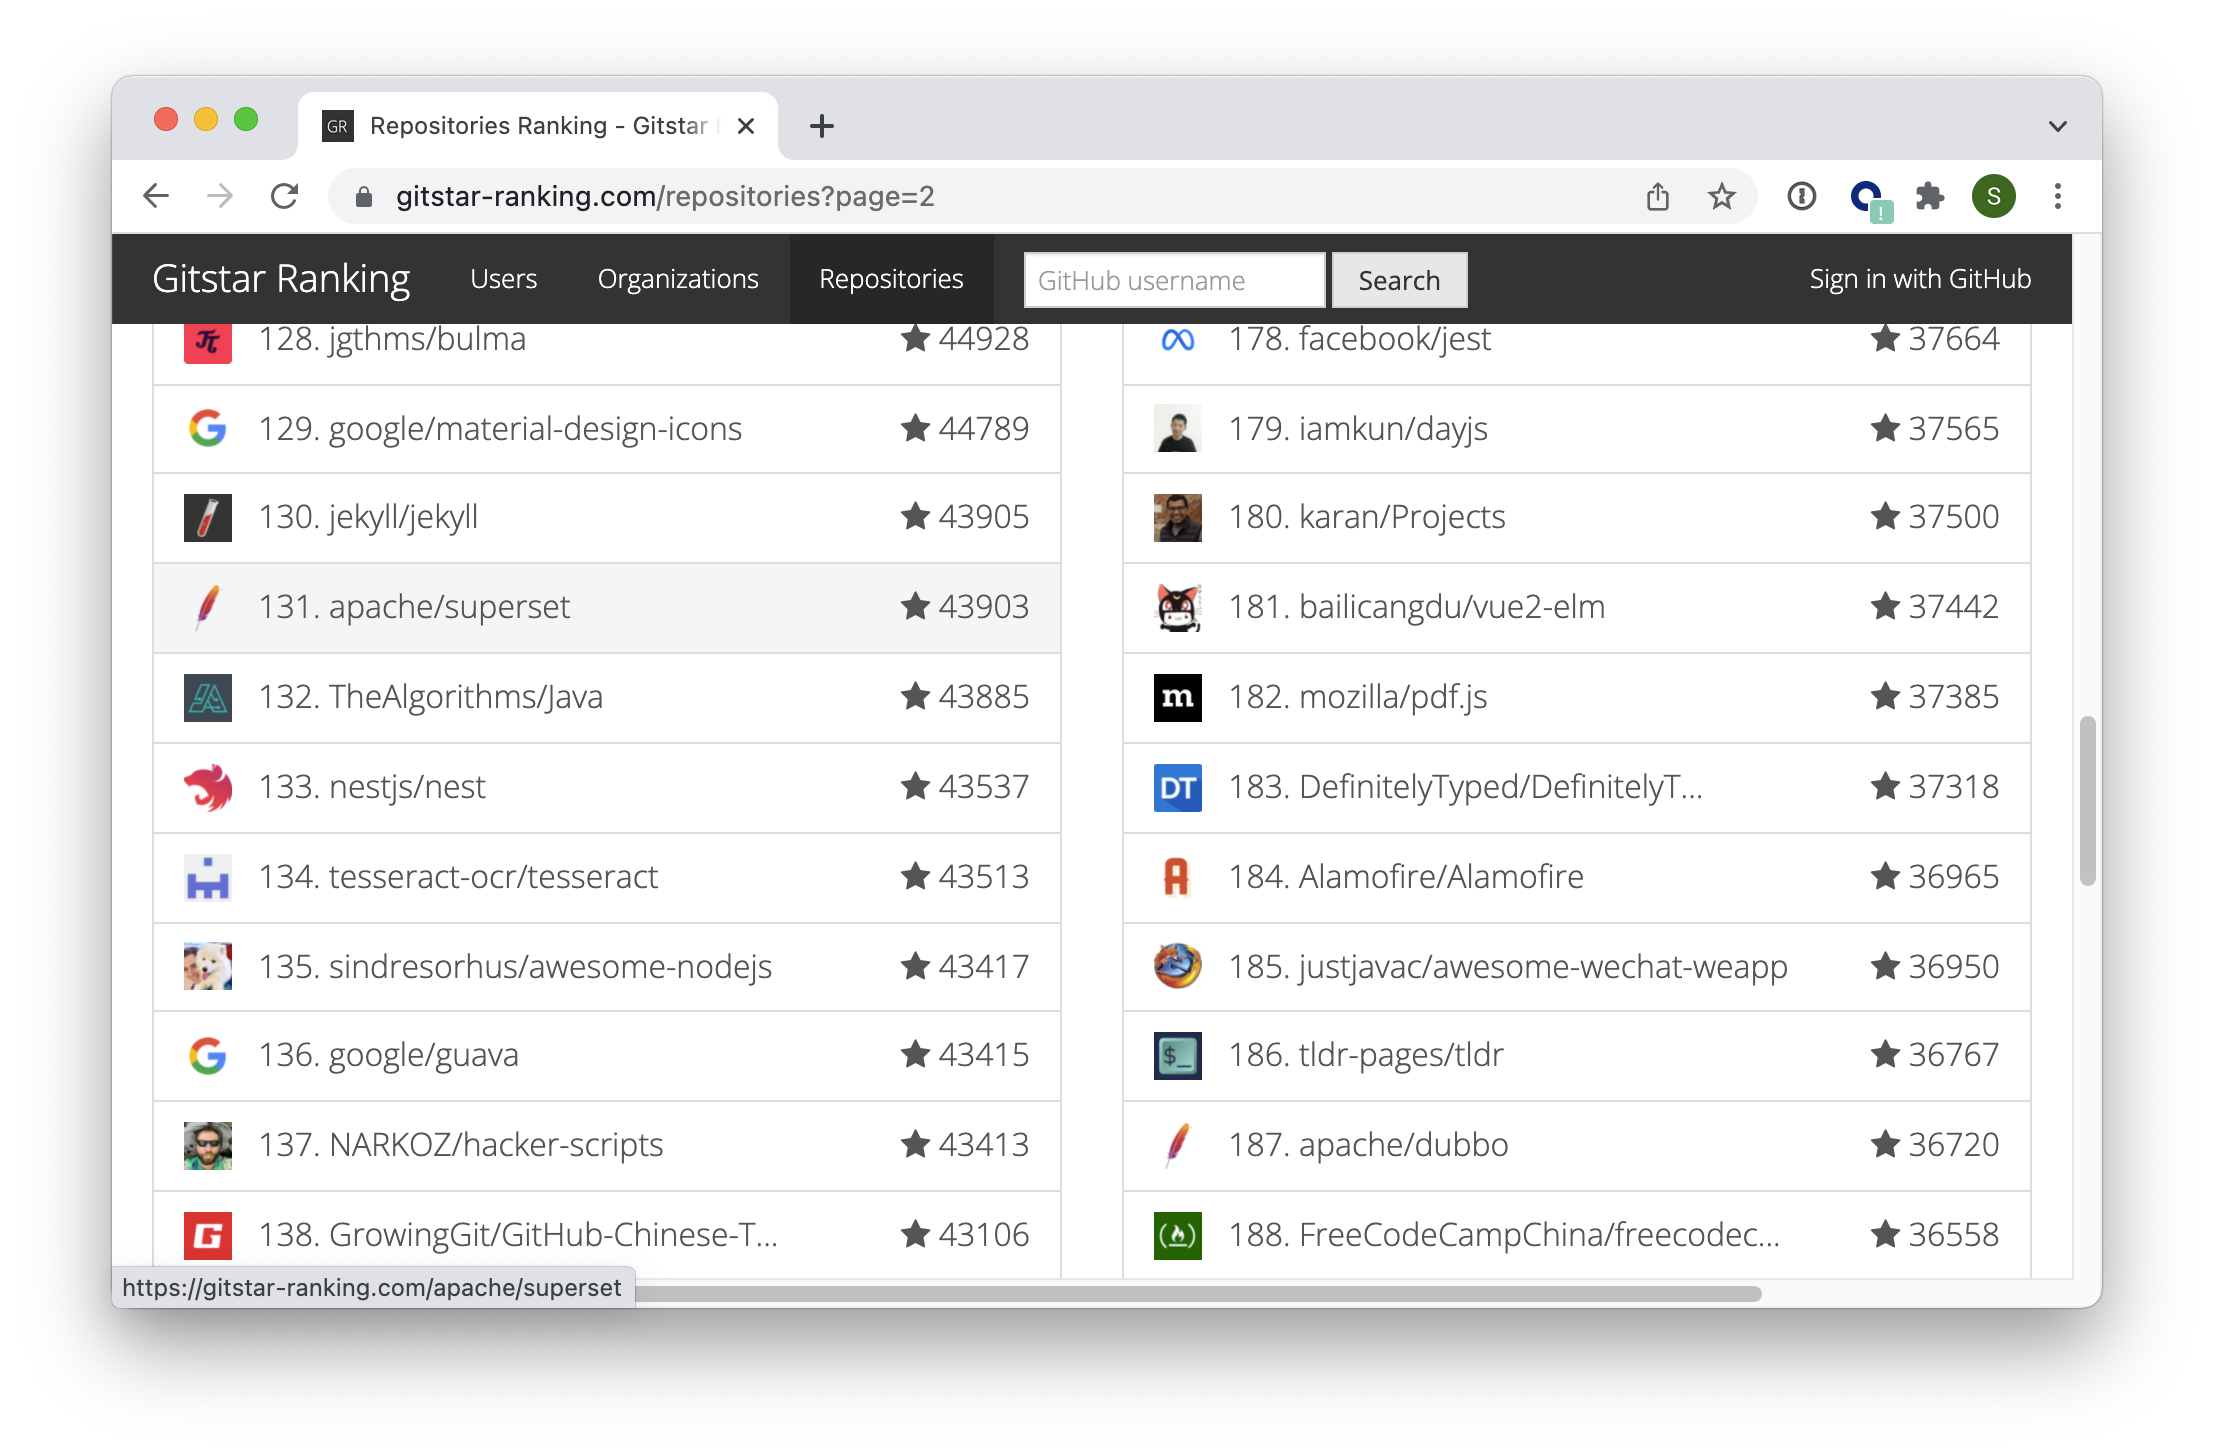
In 2021, the Superset project experienced a continued acceleration of growth in vanity metrics like stars. At the end of 2020, Superset was rank 176 among the top 200 most popular projects on Github (by stars). In 2021, the popularity of Superset catapulted the project to rank 132.
Slack Growth

The Superset Slack community more than doubled, from ~2600 members to ~5500 members! As expected, the following metrics all doubled in lock step:
- Weekly Active Members
- Weekly Members Posting Messages
I've personally enjoyed observing and participating in the growth of the Slack community around the Superset project and I hope we are able to douoble again in 2022 (while keeping the community experienced high quality).
Maturity
Superset went through multiple major and minor versions in 2021. If you're new to semantic versioning, I recommend reading this post.
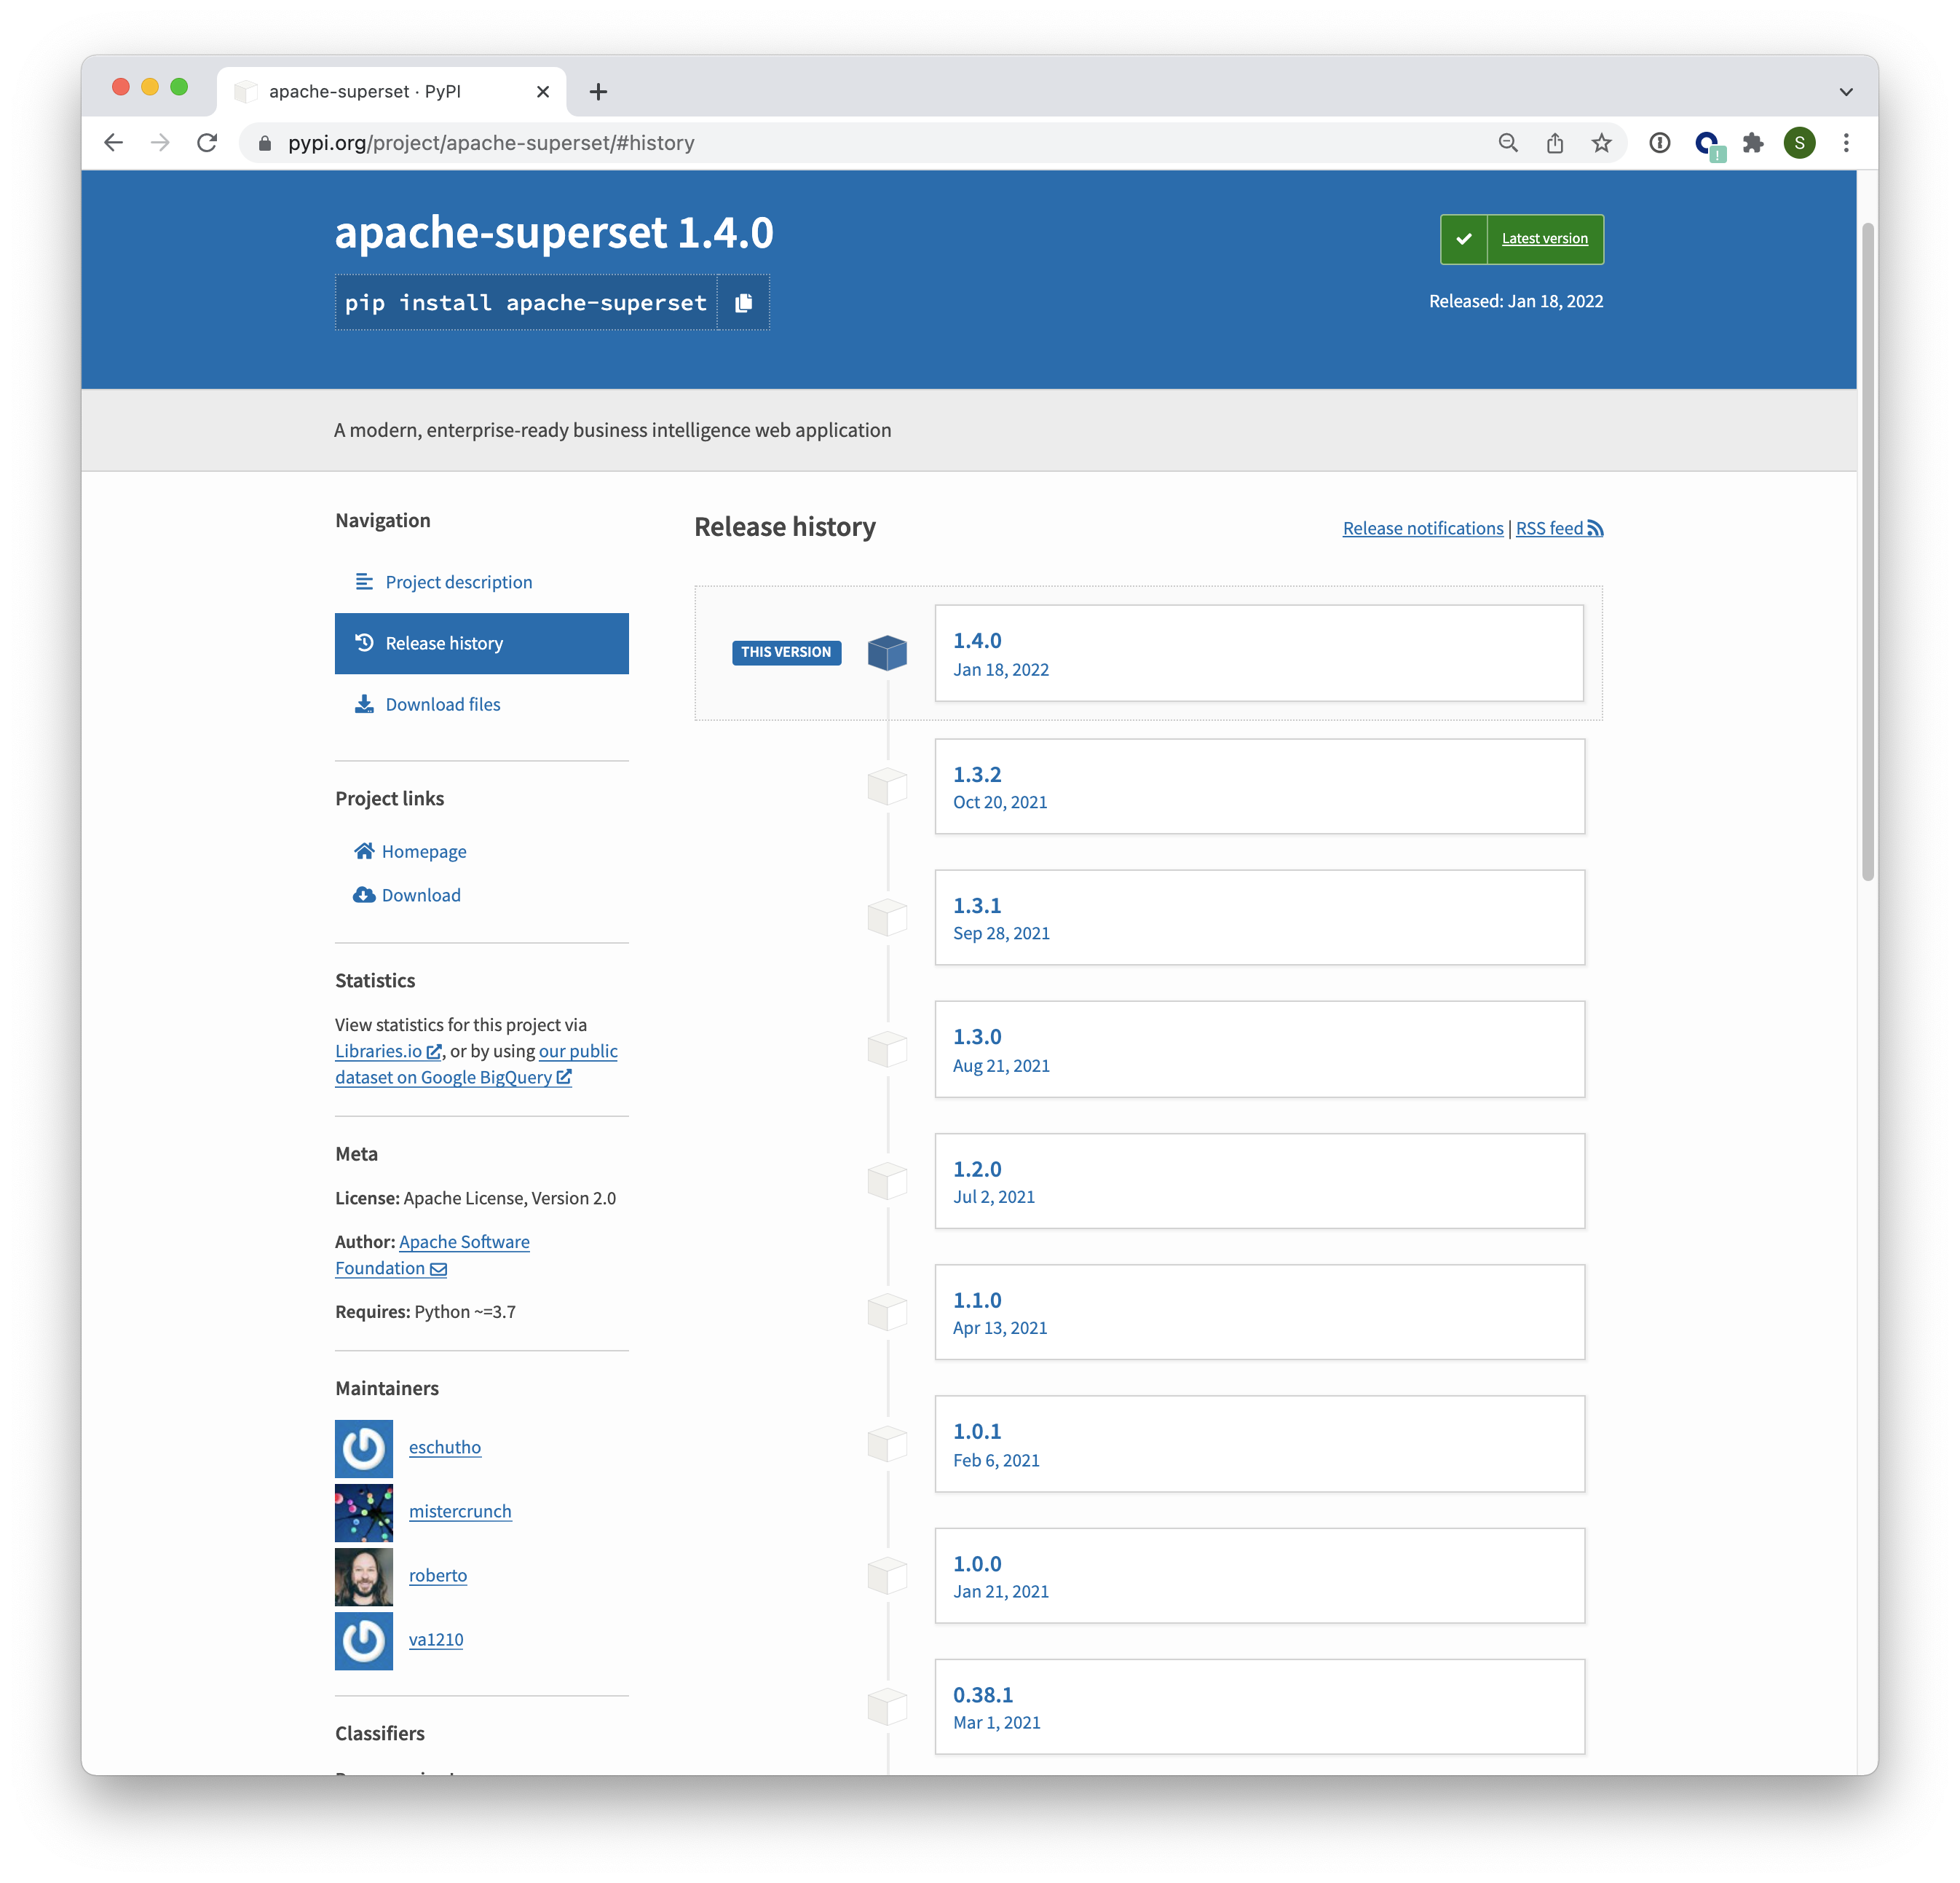
2021 started out with the major release of Superset 1.0 and ended with Superset 1.3.2. You can devour version-specific Release Notes below for the major releases:
Design & Usability
Alerts and Reports
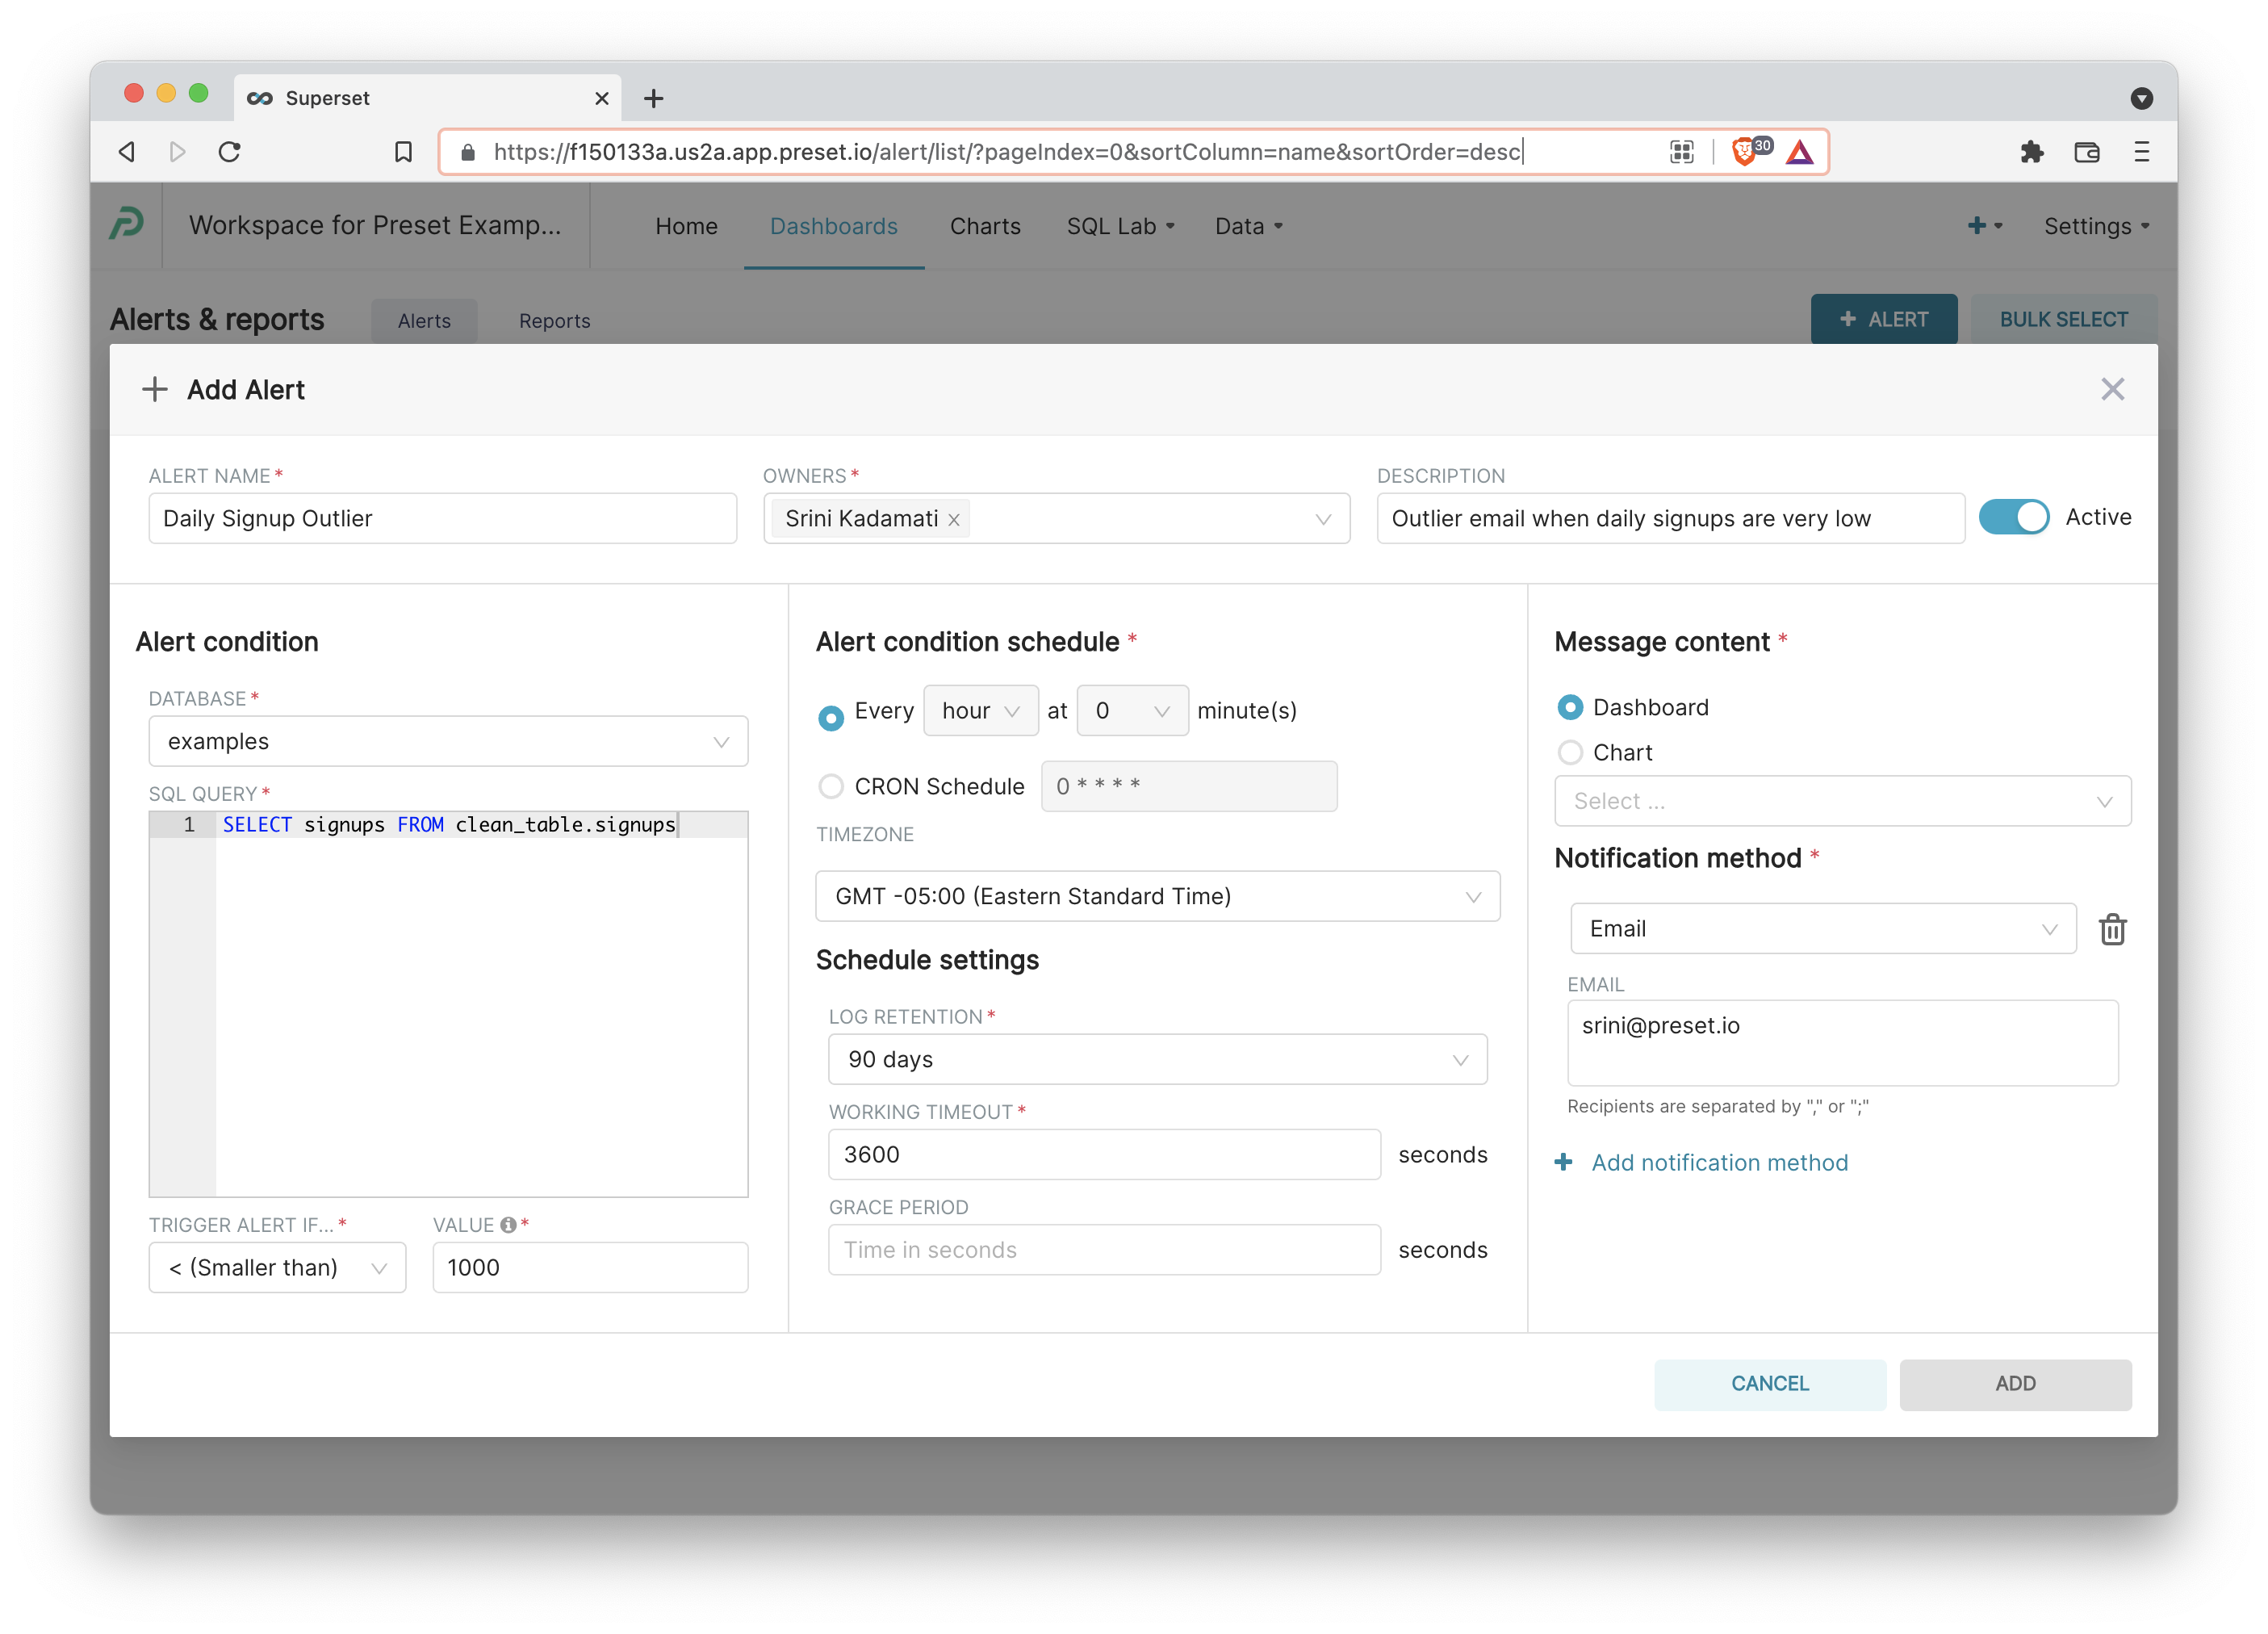
The UI for alerts and reports received a robust backend and UI overhaul.
Dashboard Native Filters
For the longest time, the Filter Box chart was the main technique for adding dynamic filters to a Superset dashboard. In parallel, the community was working on switching to filter components that lived in the dashboard layer itself. The work lived behind a feature flag and the usage of it was opt-in.
This new feature was called Dashboard Native Filters, and, after lots of testing, was made the default experience! Existing filter box "charts" will still work, but net new users willenjoy the new native filter experience.
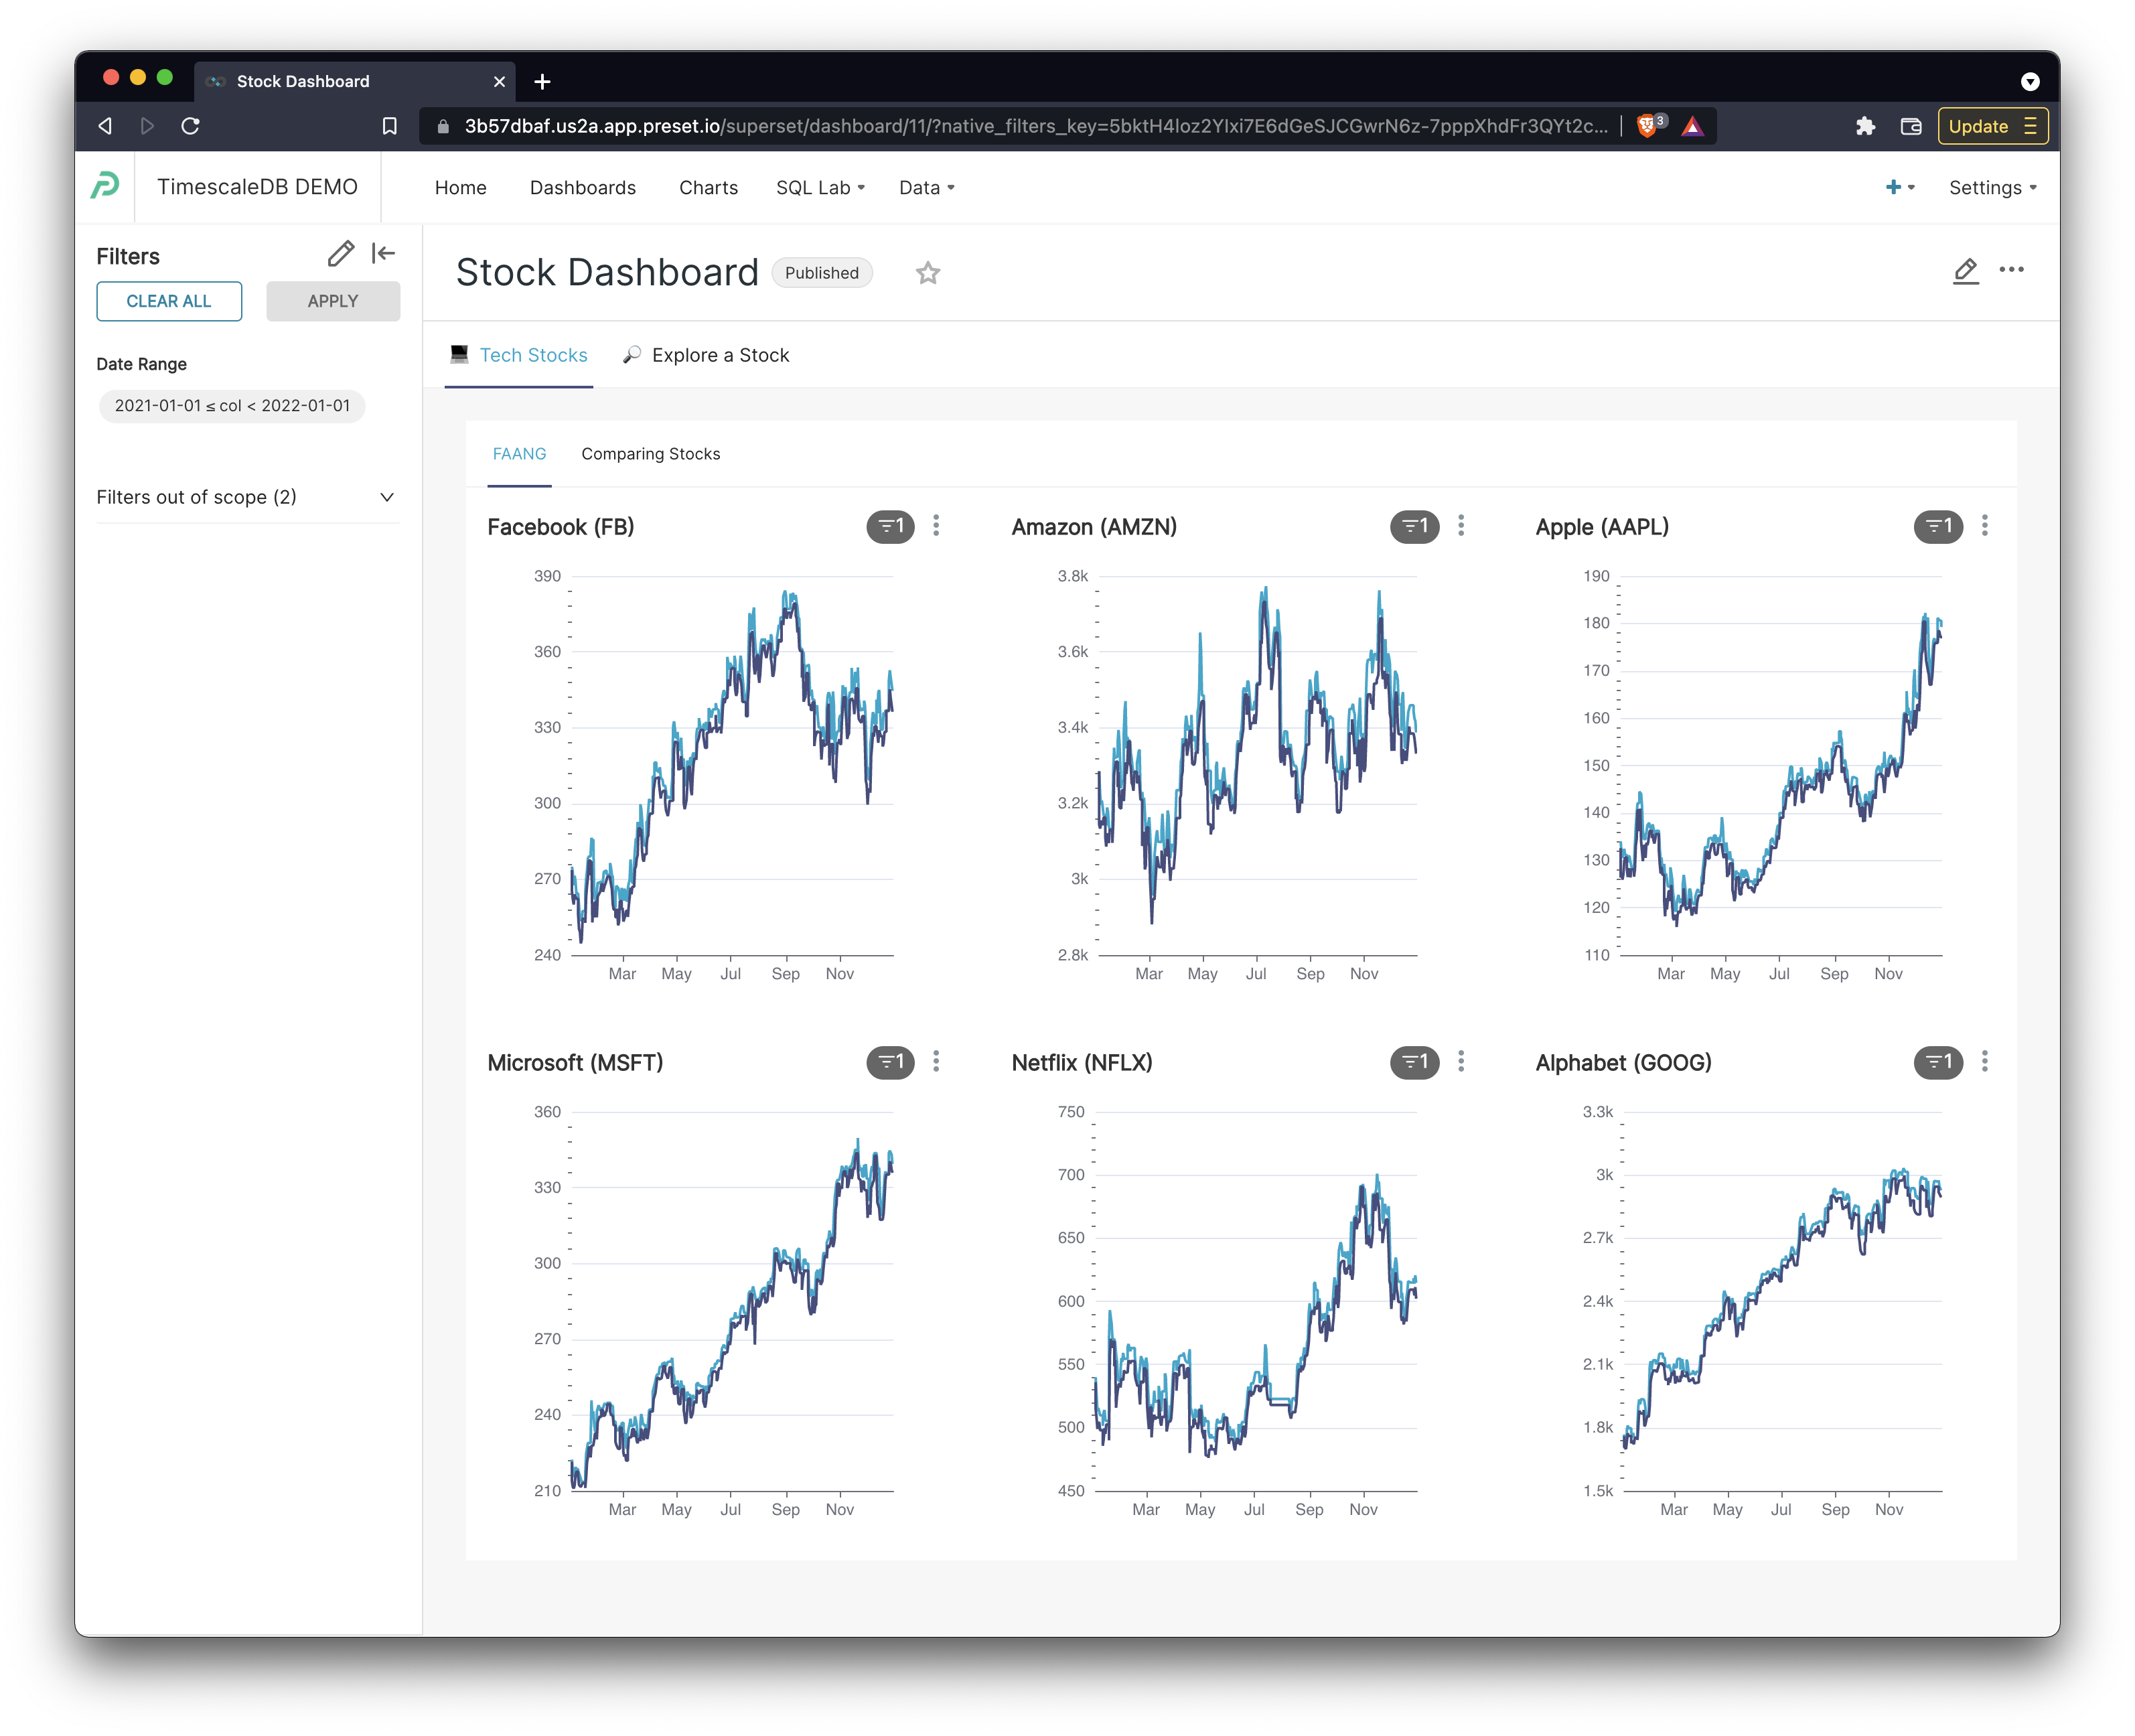
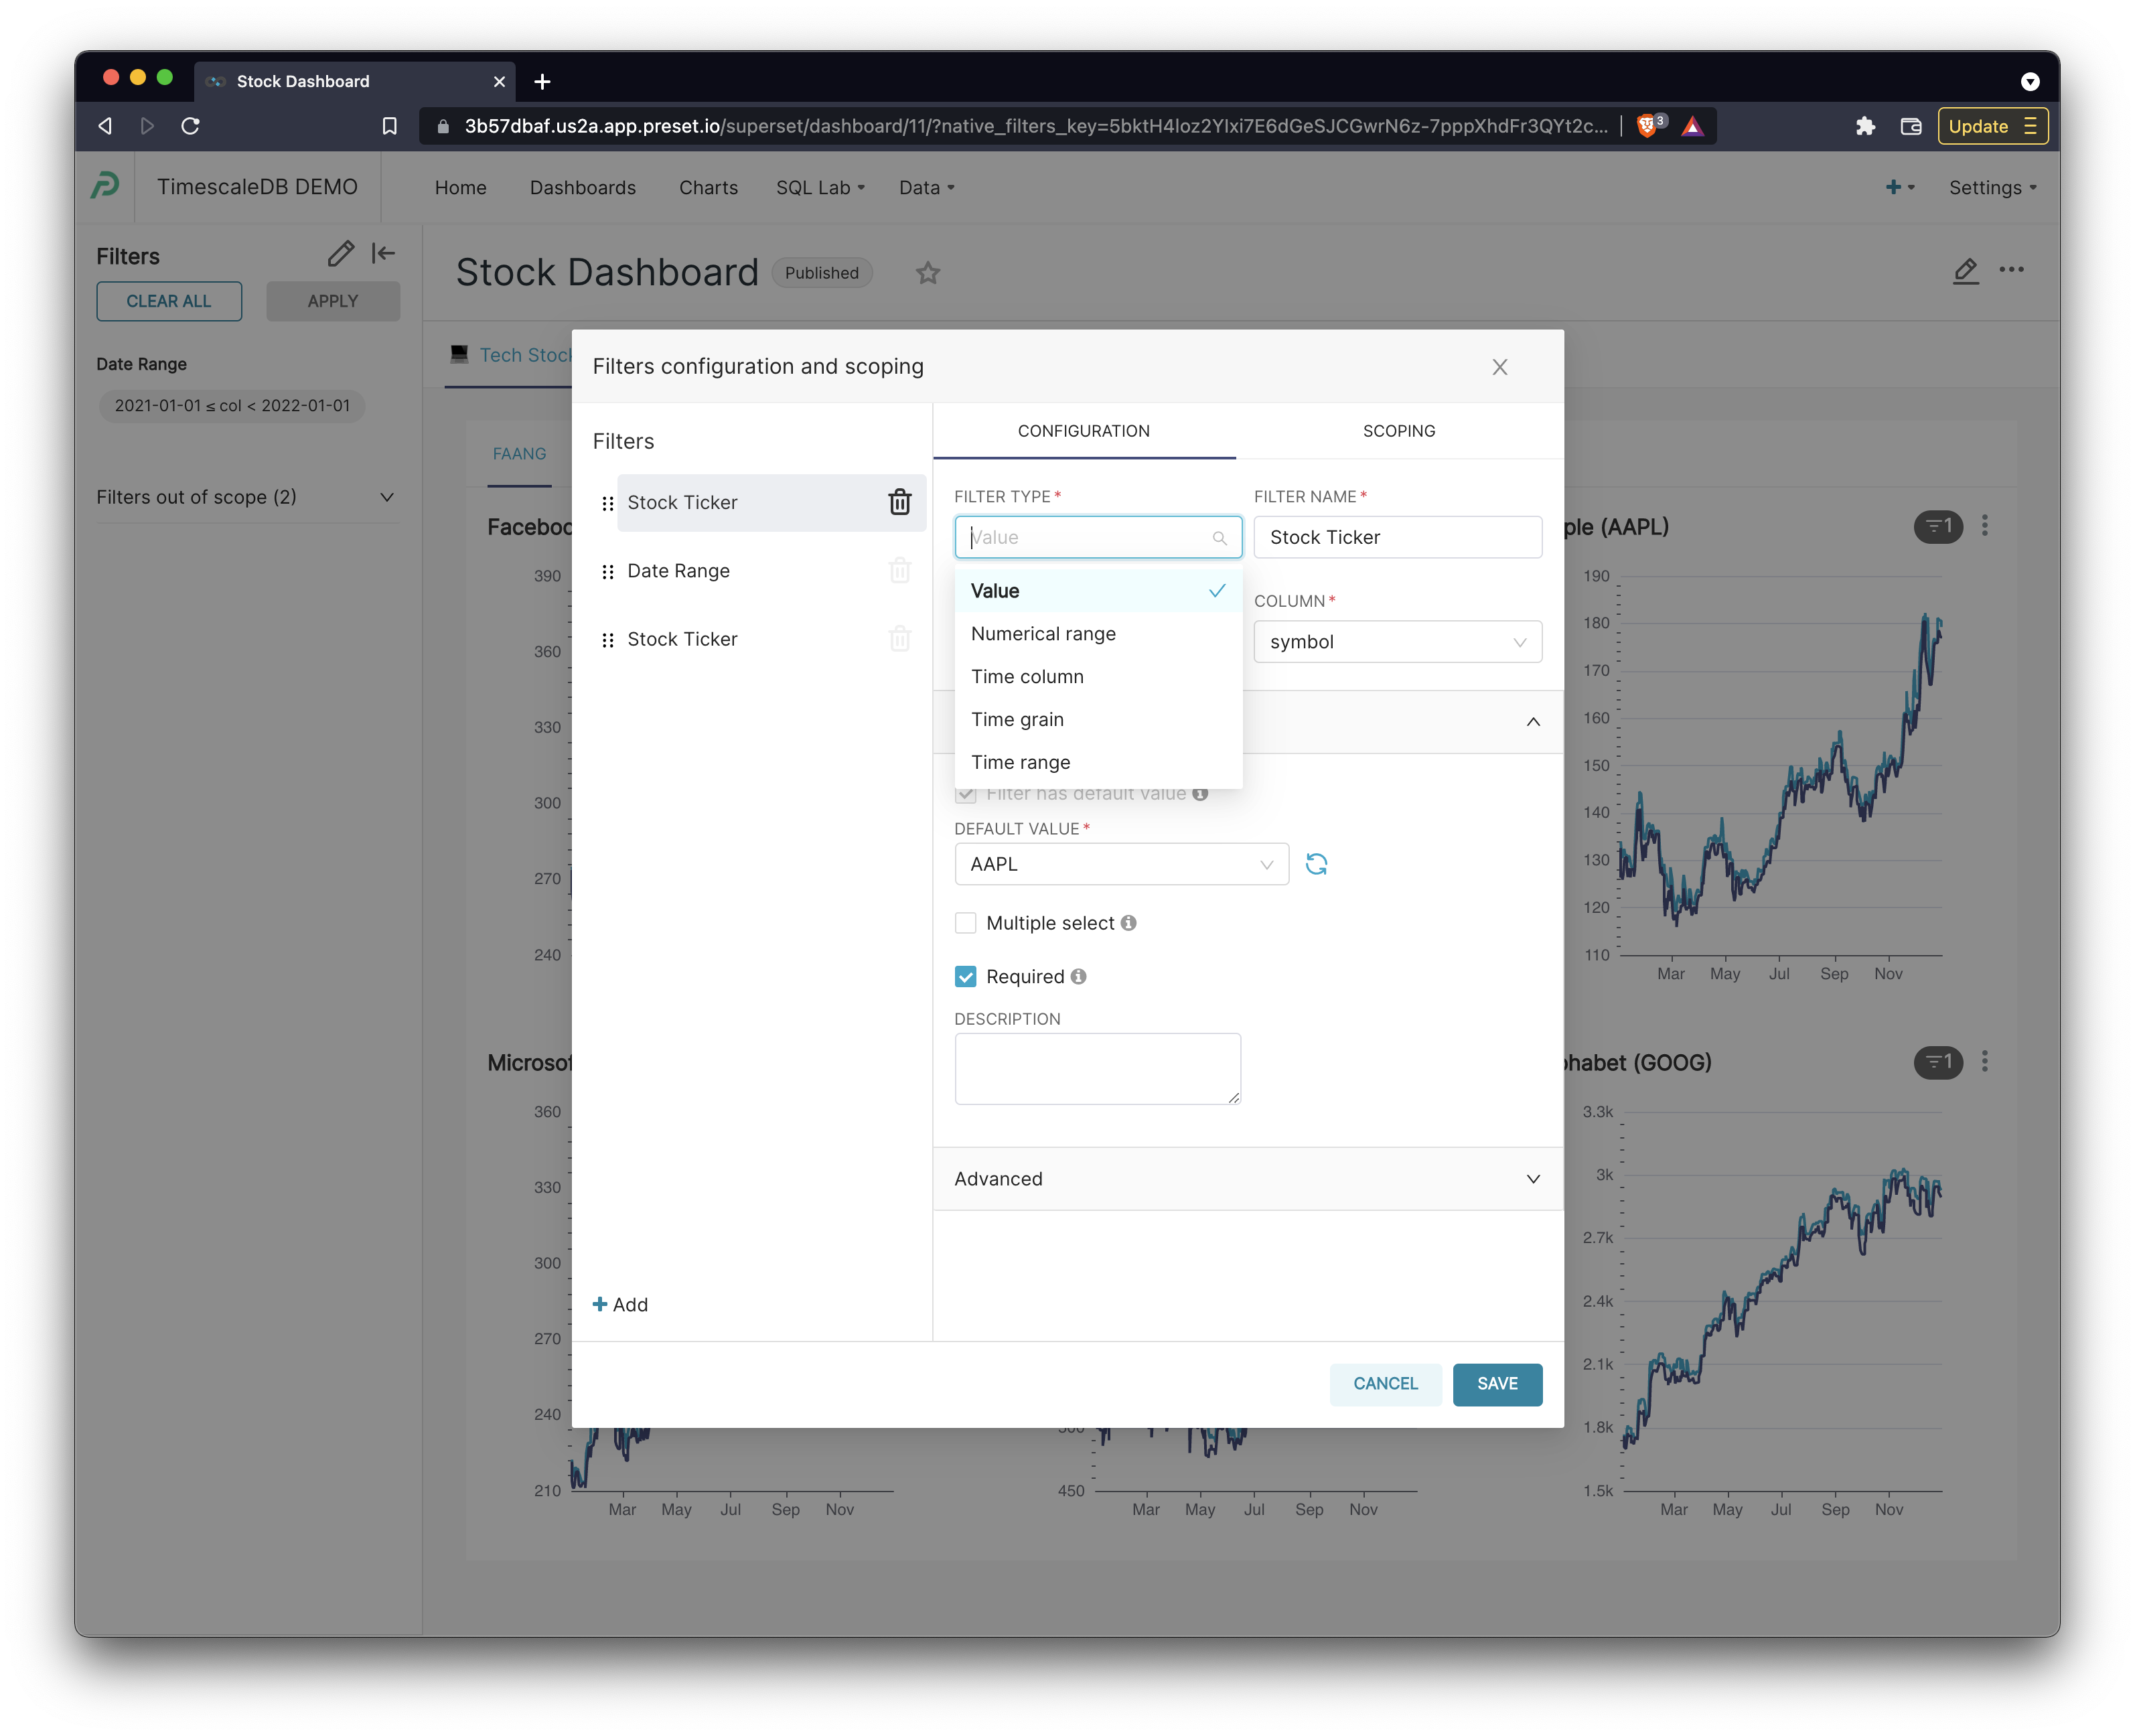
We've created an in-depth tutorial on how to use Dashboard Native Filters over at our Preset User Corner channel. Note that filter box will still work for now, but eventually will be deprecated.
Quality of Life Improvements
In 2021, hundreds of little quality-of-life improvements were added to the end-user experience. Here are a few examples!
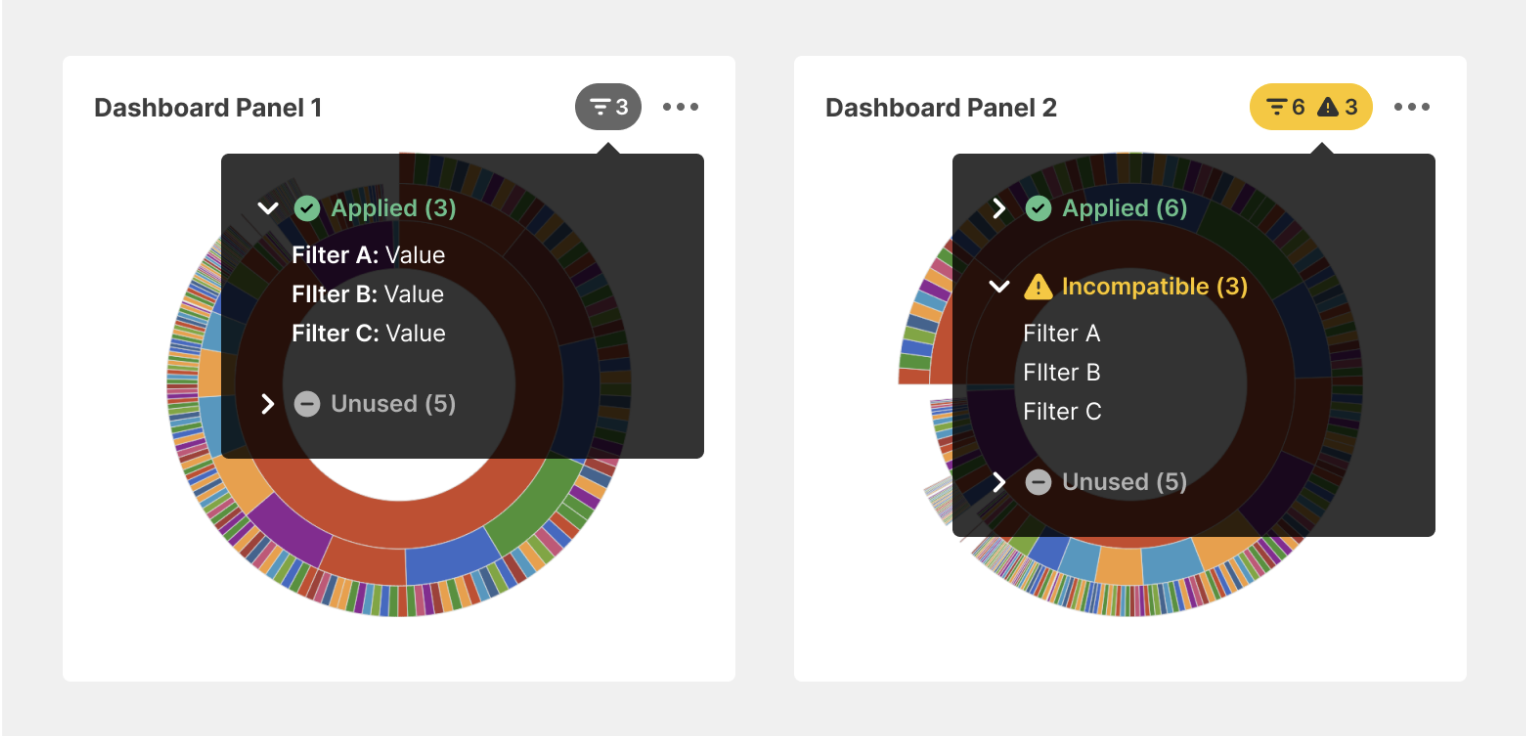
- Charts on dashboards have been updated to concisely show which filters are in scope, have been applied, or are in error.
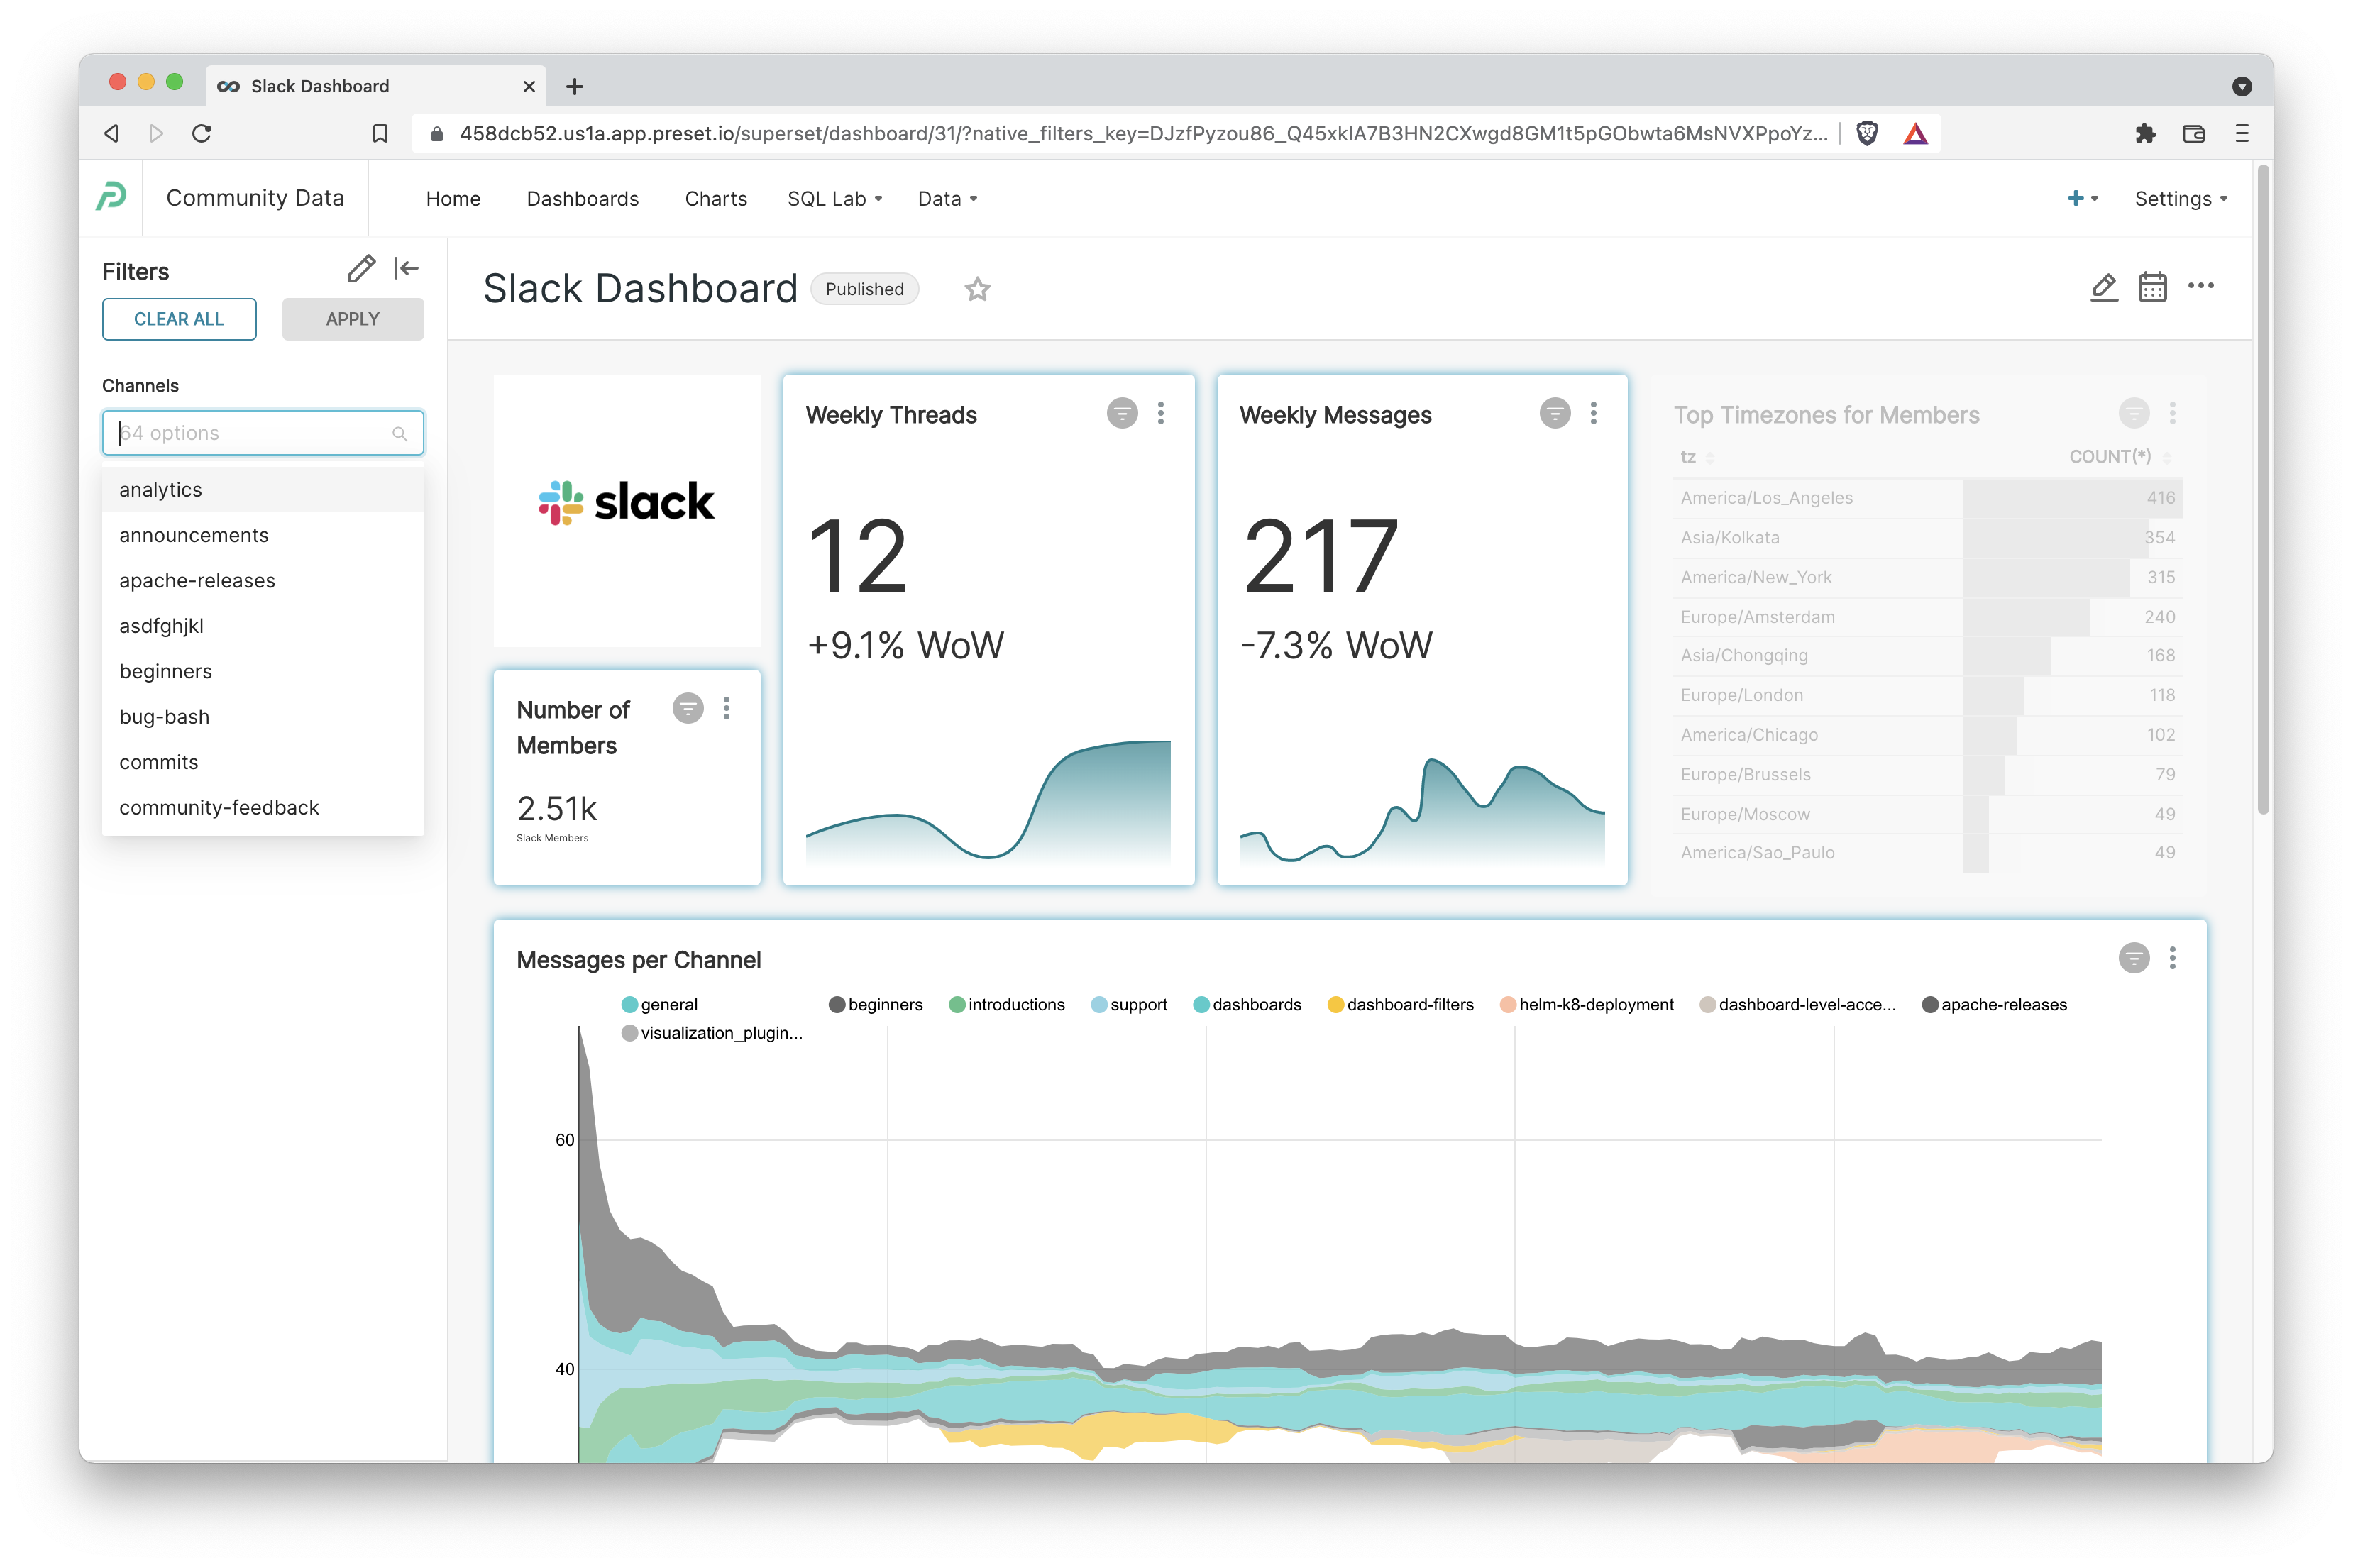
- When hovering over each dashboard filter, the charts impacted by each are highlighted.
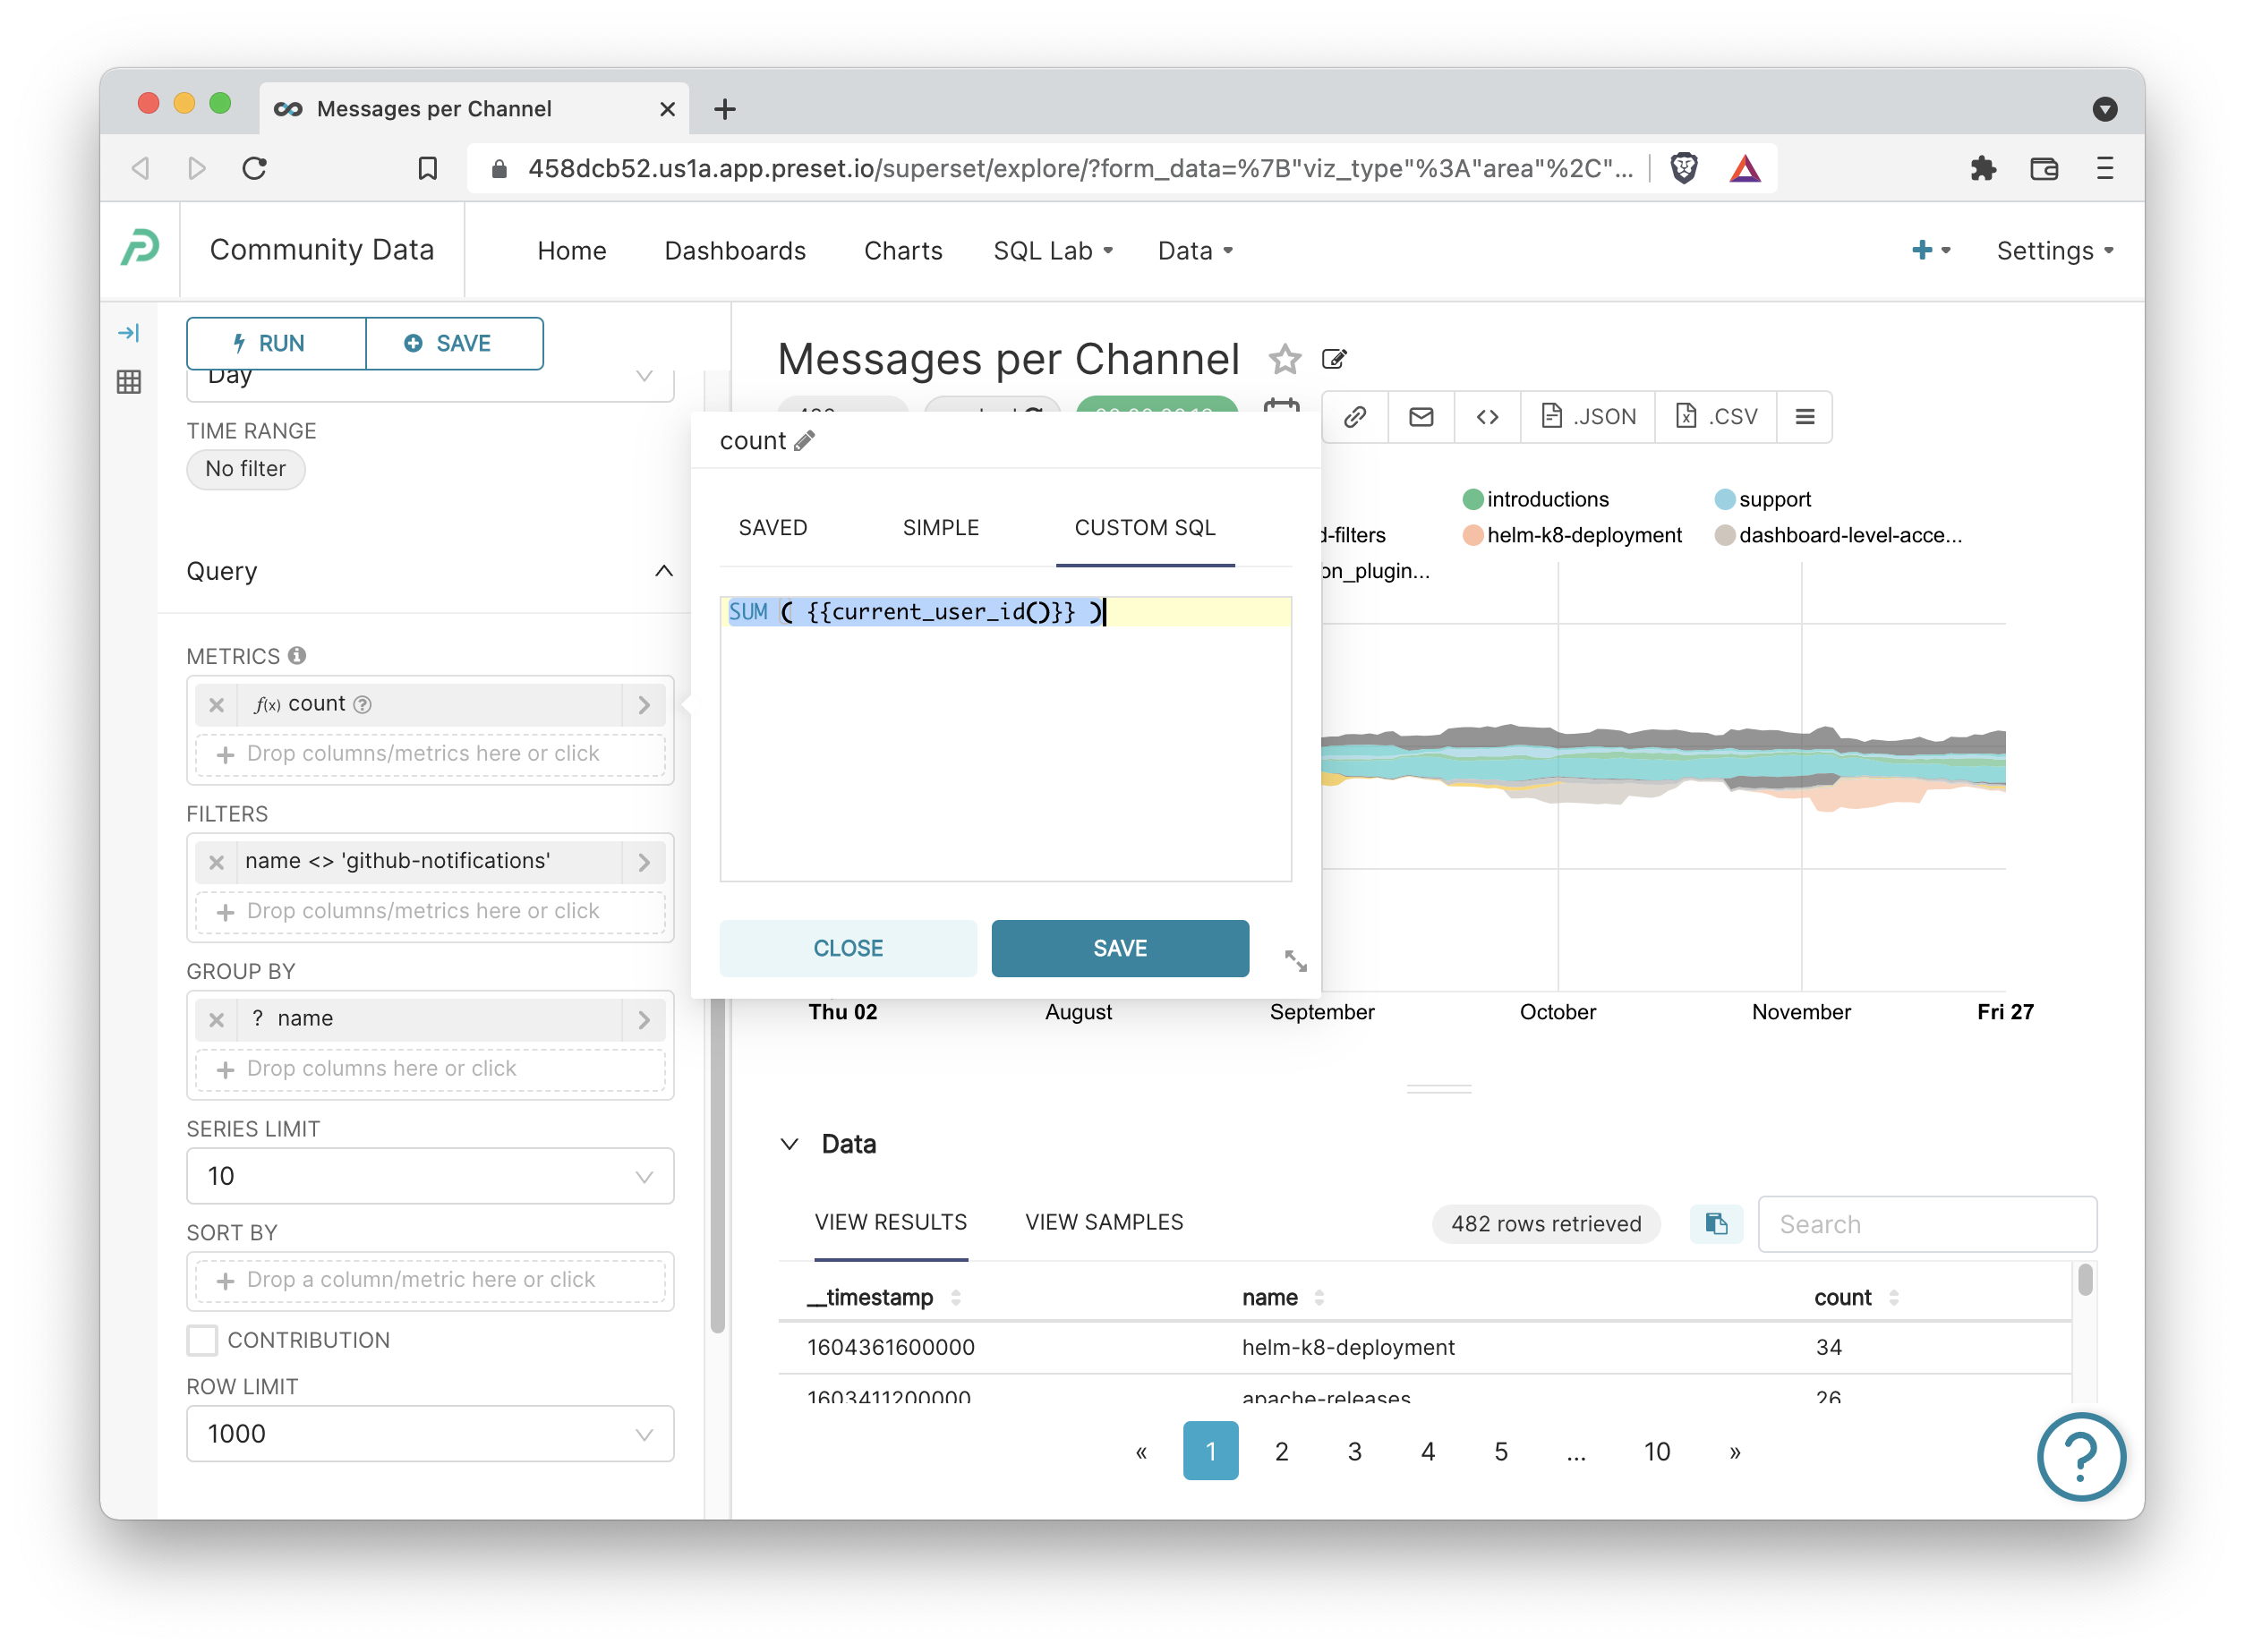
- You can now use Jinja templating in calculated columns and metrics.
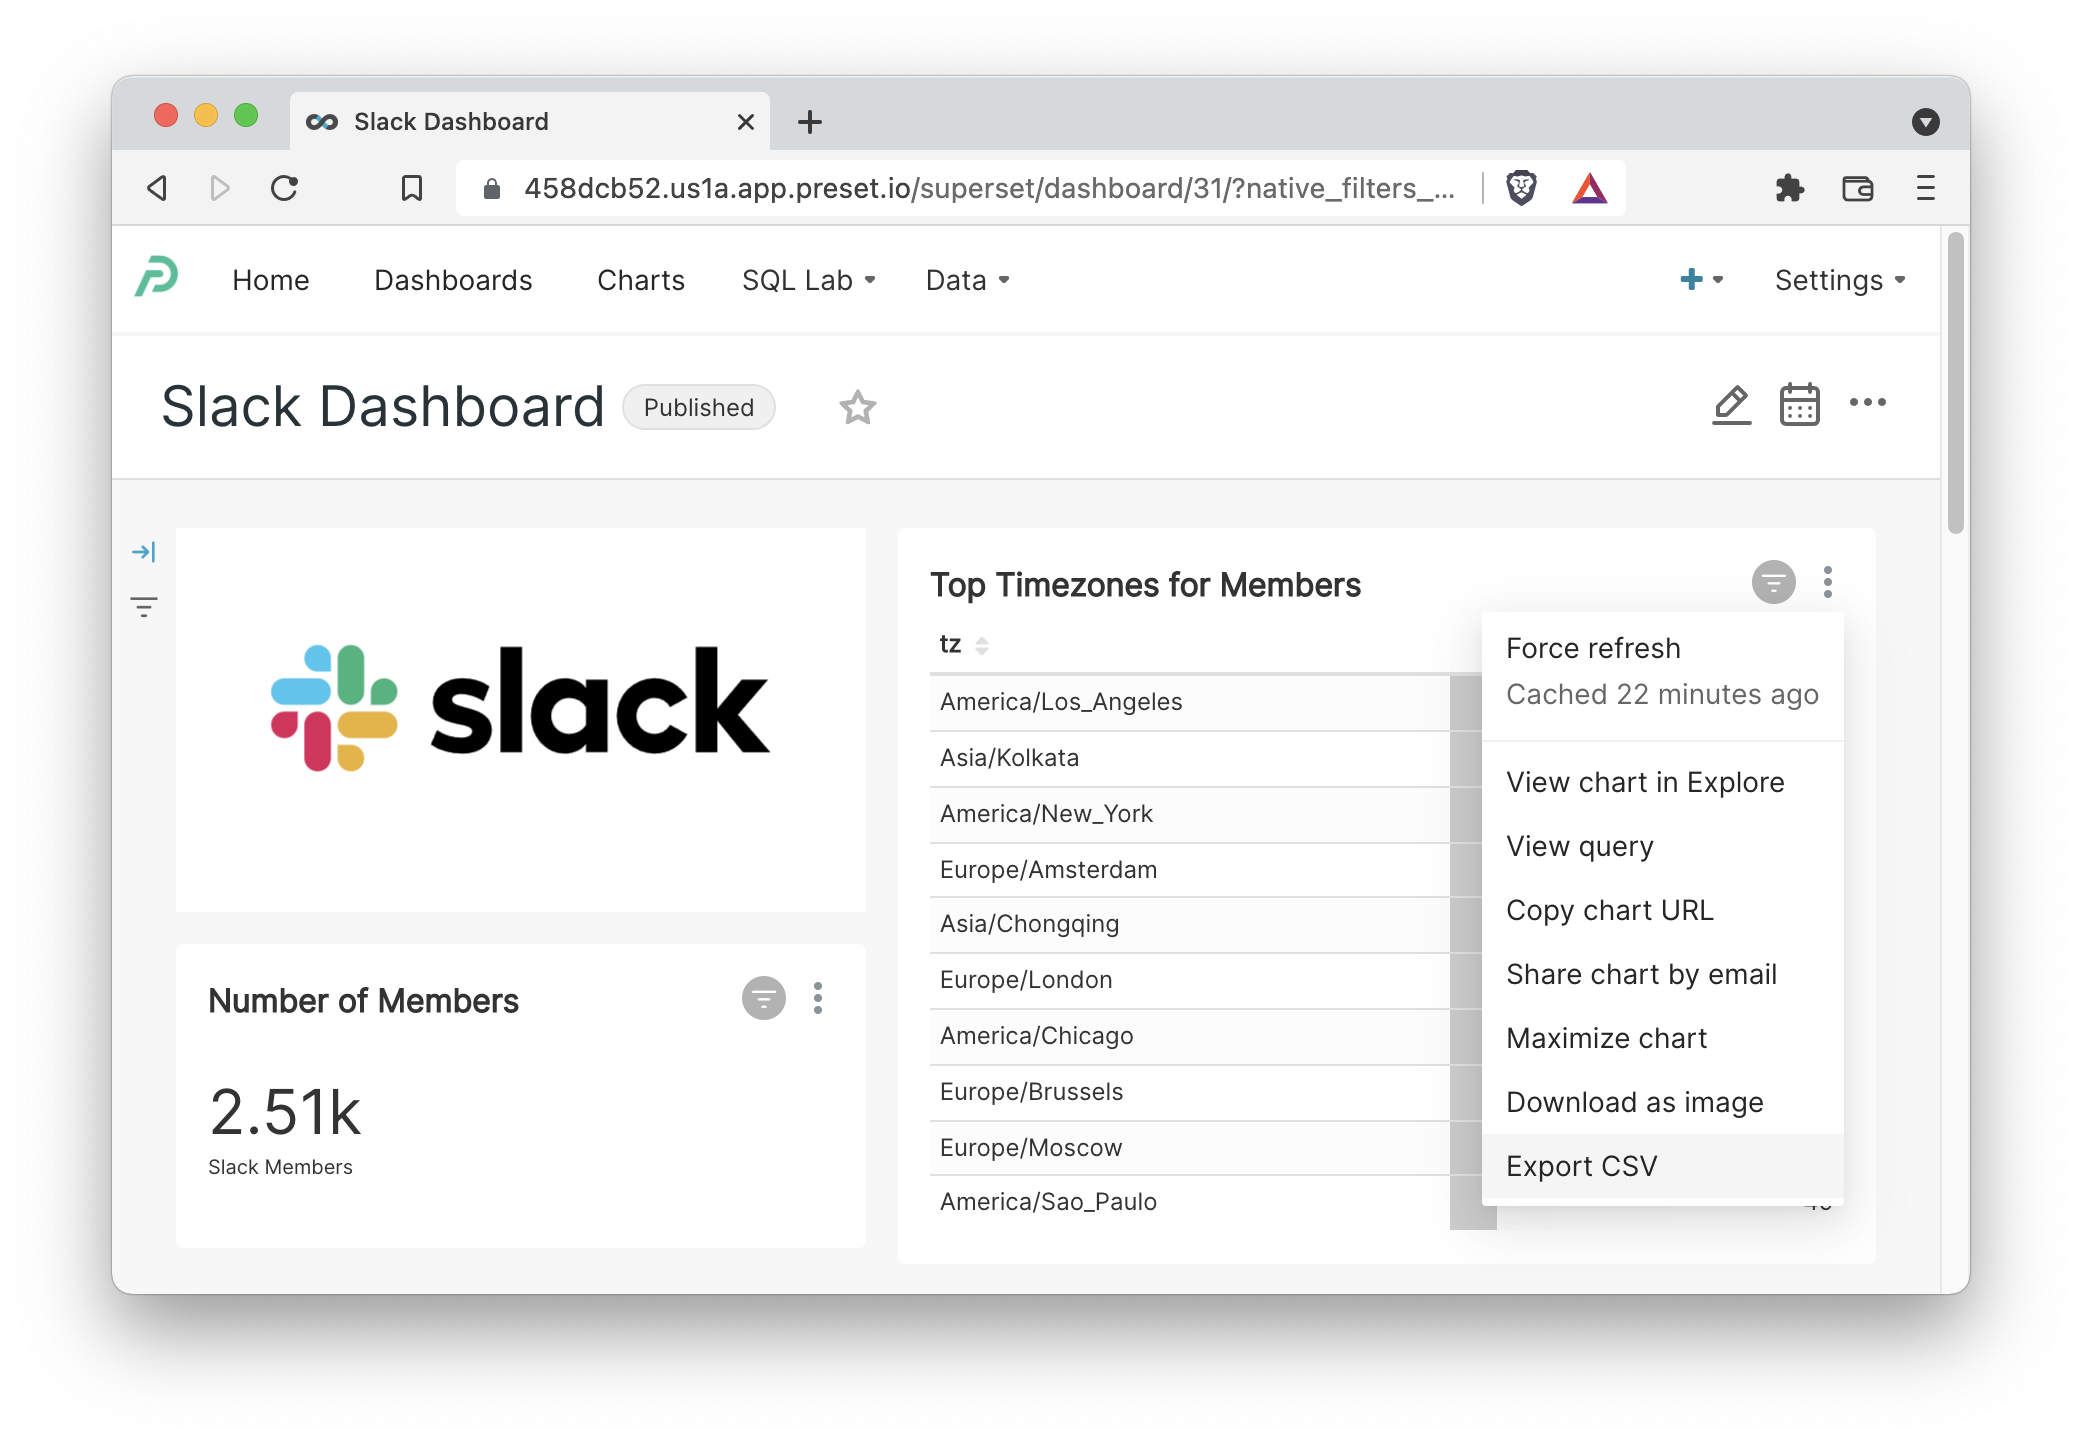
- Dashboard viewers can now download the CSV for the dataset behind a specific chart.
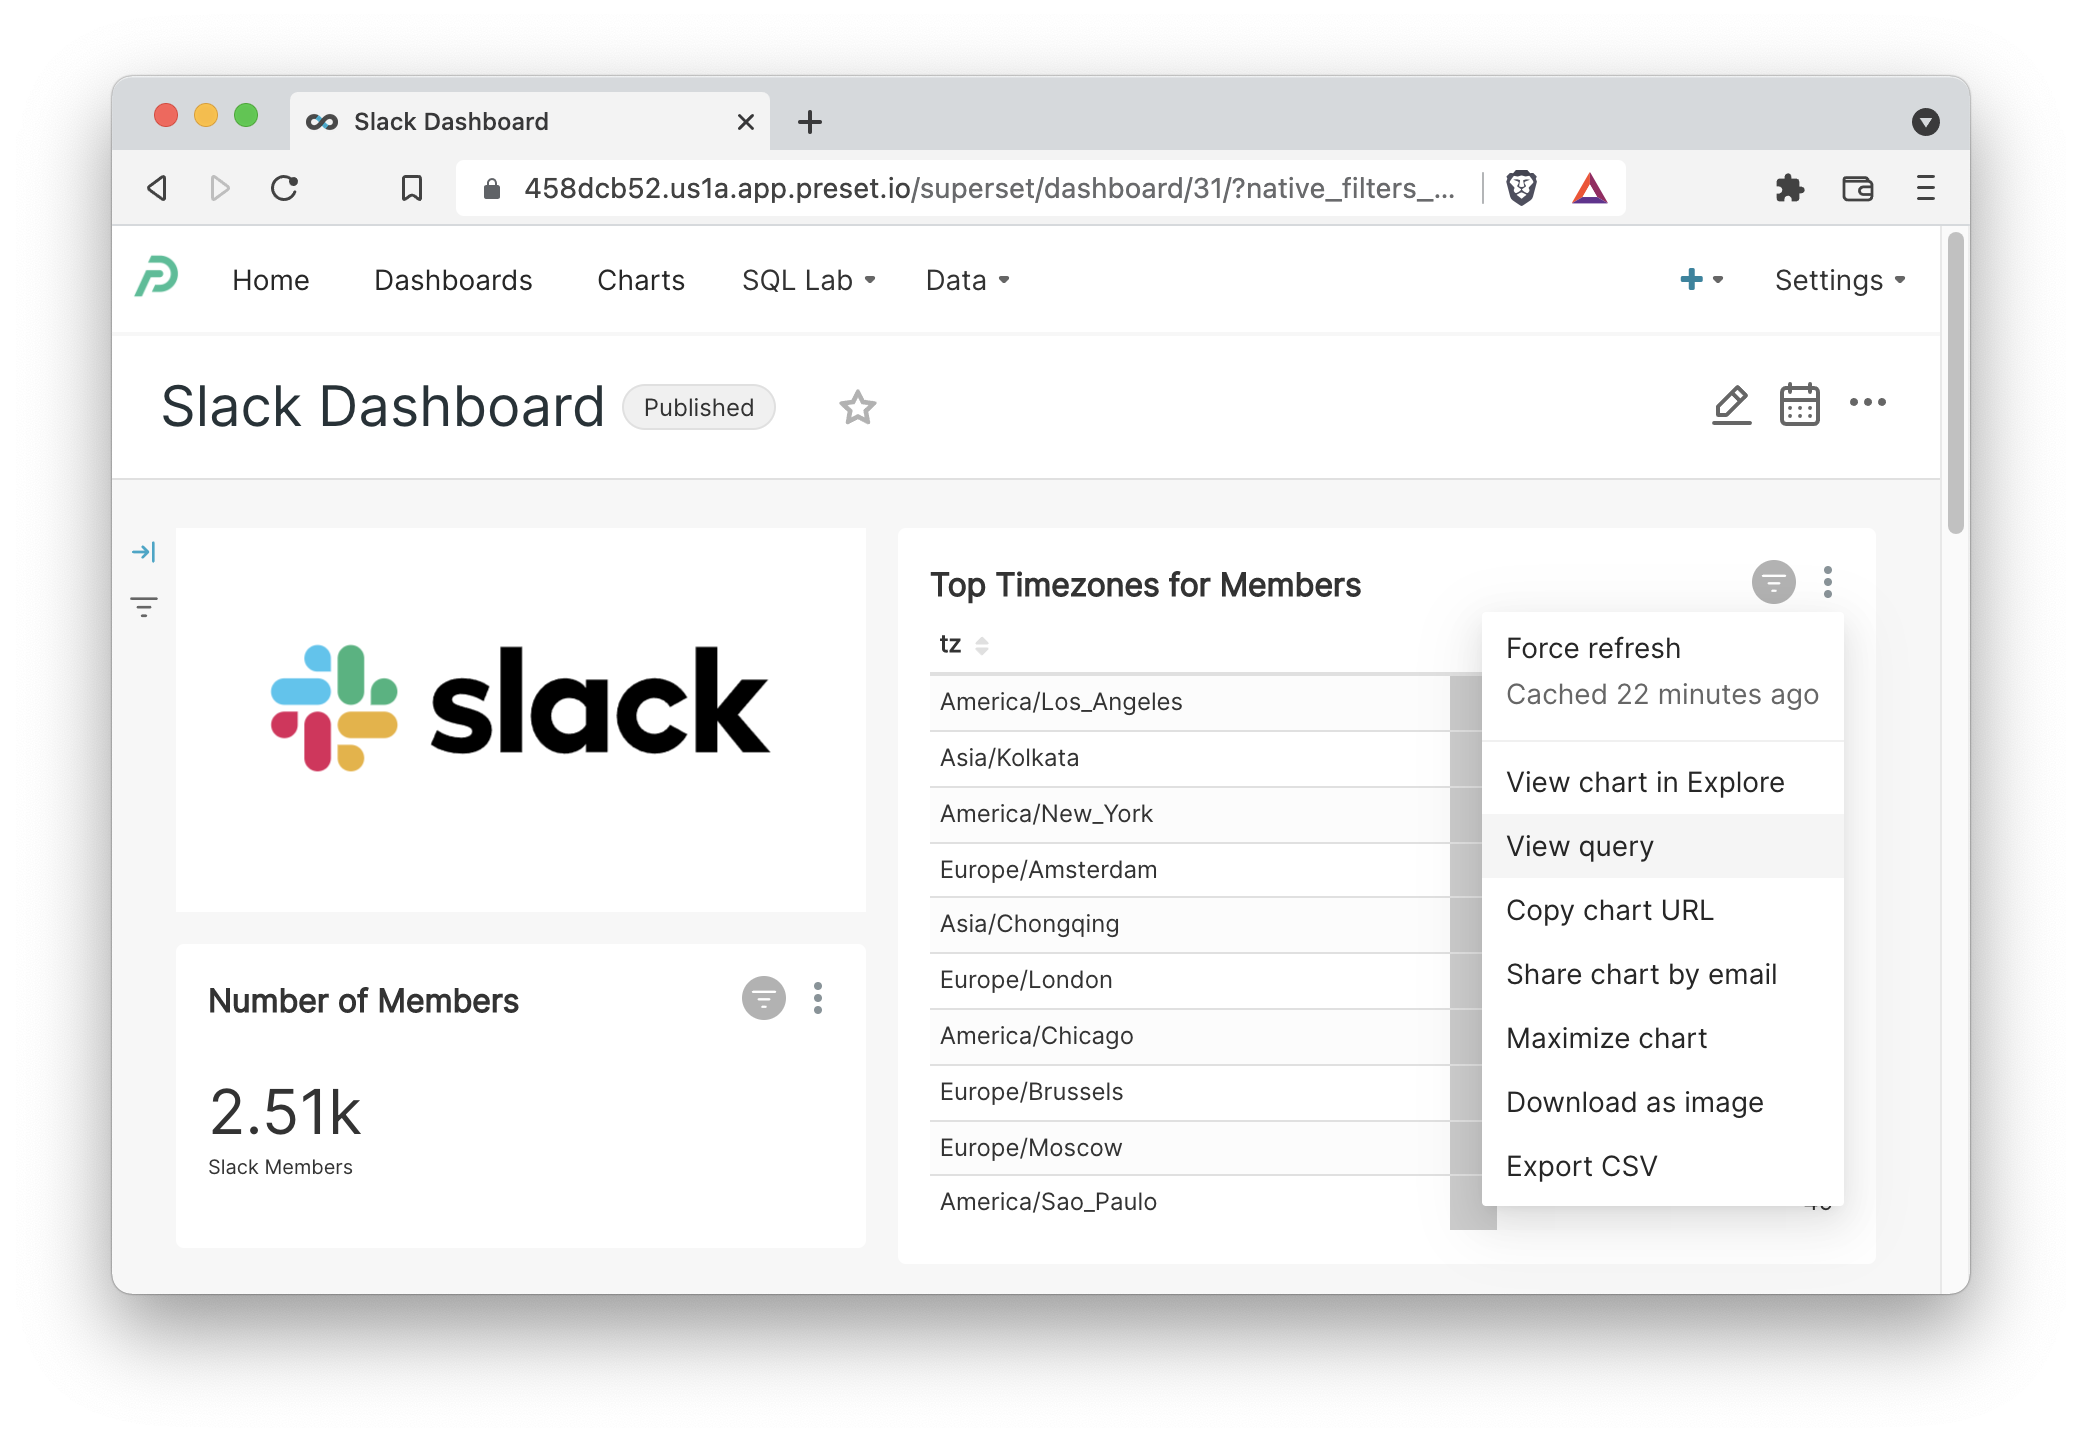
- Charts in a dashboard now contain a drop-down button to quickly view the SQL query that fetches the data for that chart.
Visualizations
Superset made a leap forward in the quality of visualizations that were available by default. In April 2021, I wrote about how Apache ECharts would be the future of visualizations in Superset. Throughout 2021, over nine ECharts visualizations were added to core Superset:

We've also recently made it easier to develop your own custom visualizations in Superset.
Databases
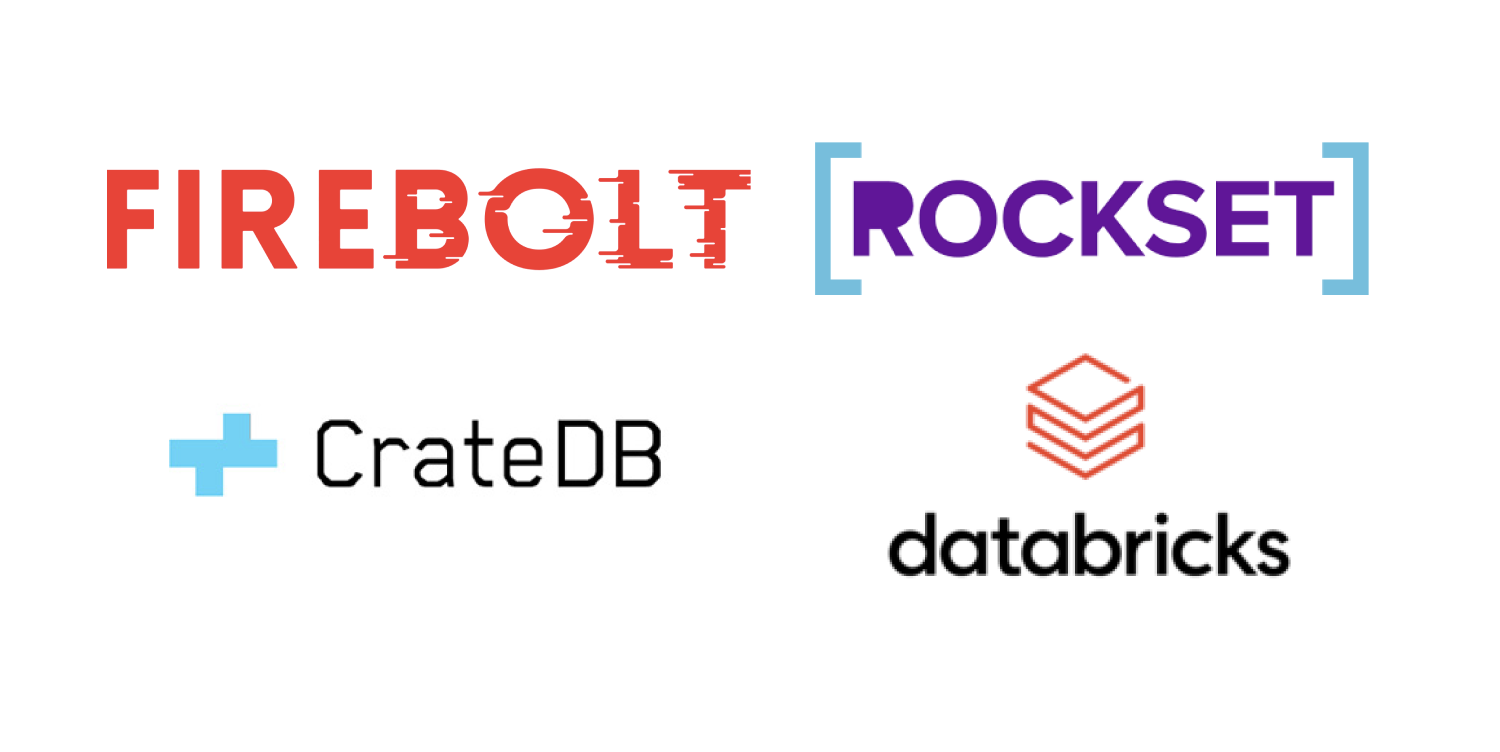
The following databases are now supported in Superset:
While the following databases were already supported, the quality of integration improved even further:
2022 and beyond
2021 was a key year for Superset growth and maturity and I'm incredibly excited for 2022. If you're not already a part of the Superset community, join us!