


Why Apache ECharts is the Future of Apache Superset™


Earlier this year, the visualization library Apache ECharts graduated from the Apache incubator.
A few months before the graduation announcement, Max put forth SIP-50 -- which proposed that the Superset community consider ECharts as the replacement for NVD3 for its primary charting library.
Superset has a history of supporting the creation of custom viz plugins using any charting library people wanted. But the real goal of SIP-50 was to bet on a foundational platform for the core charts that Superset shipped with. Learn more about Apache Superset and its visualization capabilities.
Here's some history from Max:
"When Superset was started back in 2015, the D3 library was the clear choice for building data visualizations, and NVD3 offered a nice set of reusable charts built on top of D3 that allowed hooks and callbacks that integrated nicely with D3 primitives. Over the past few years, the library has not been maintained actively and we've had to fork the project recently to ensure we could fix some bugs and to put it on life support. We got a lot of mileage out of the library and we're grateful for that, but it's beyond time to move on."
Why Apache ECharts?
When deciding what charting library to bet on next, the following factors were considered by the Superset community:
- large library of visualization types, rooted in a consistent visual design and API
- an active and growing community
- strong governance model where anyone can contribute and influence the direction
- high performance, ideally supporting canvas rendering
- powerful declarative API for customizing and theming charts
- internationalization support
Let's drill a bit deeper into some of these.
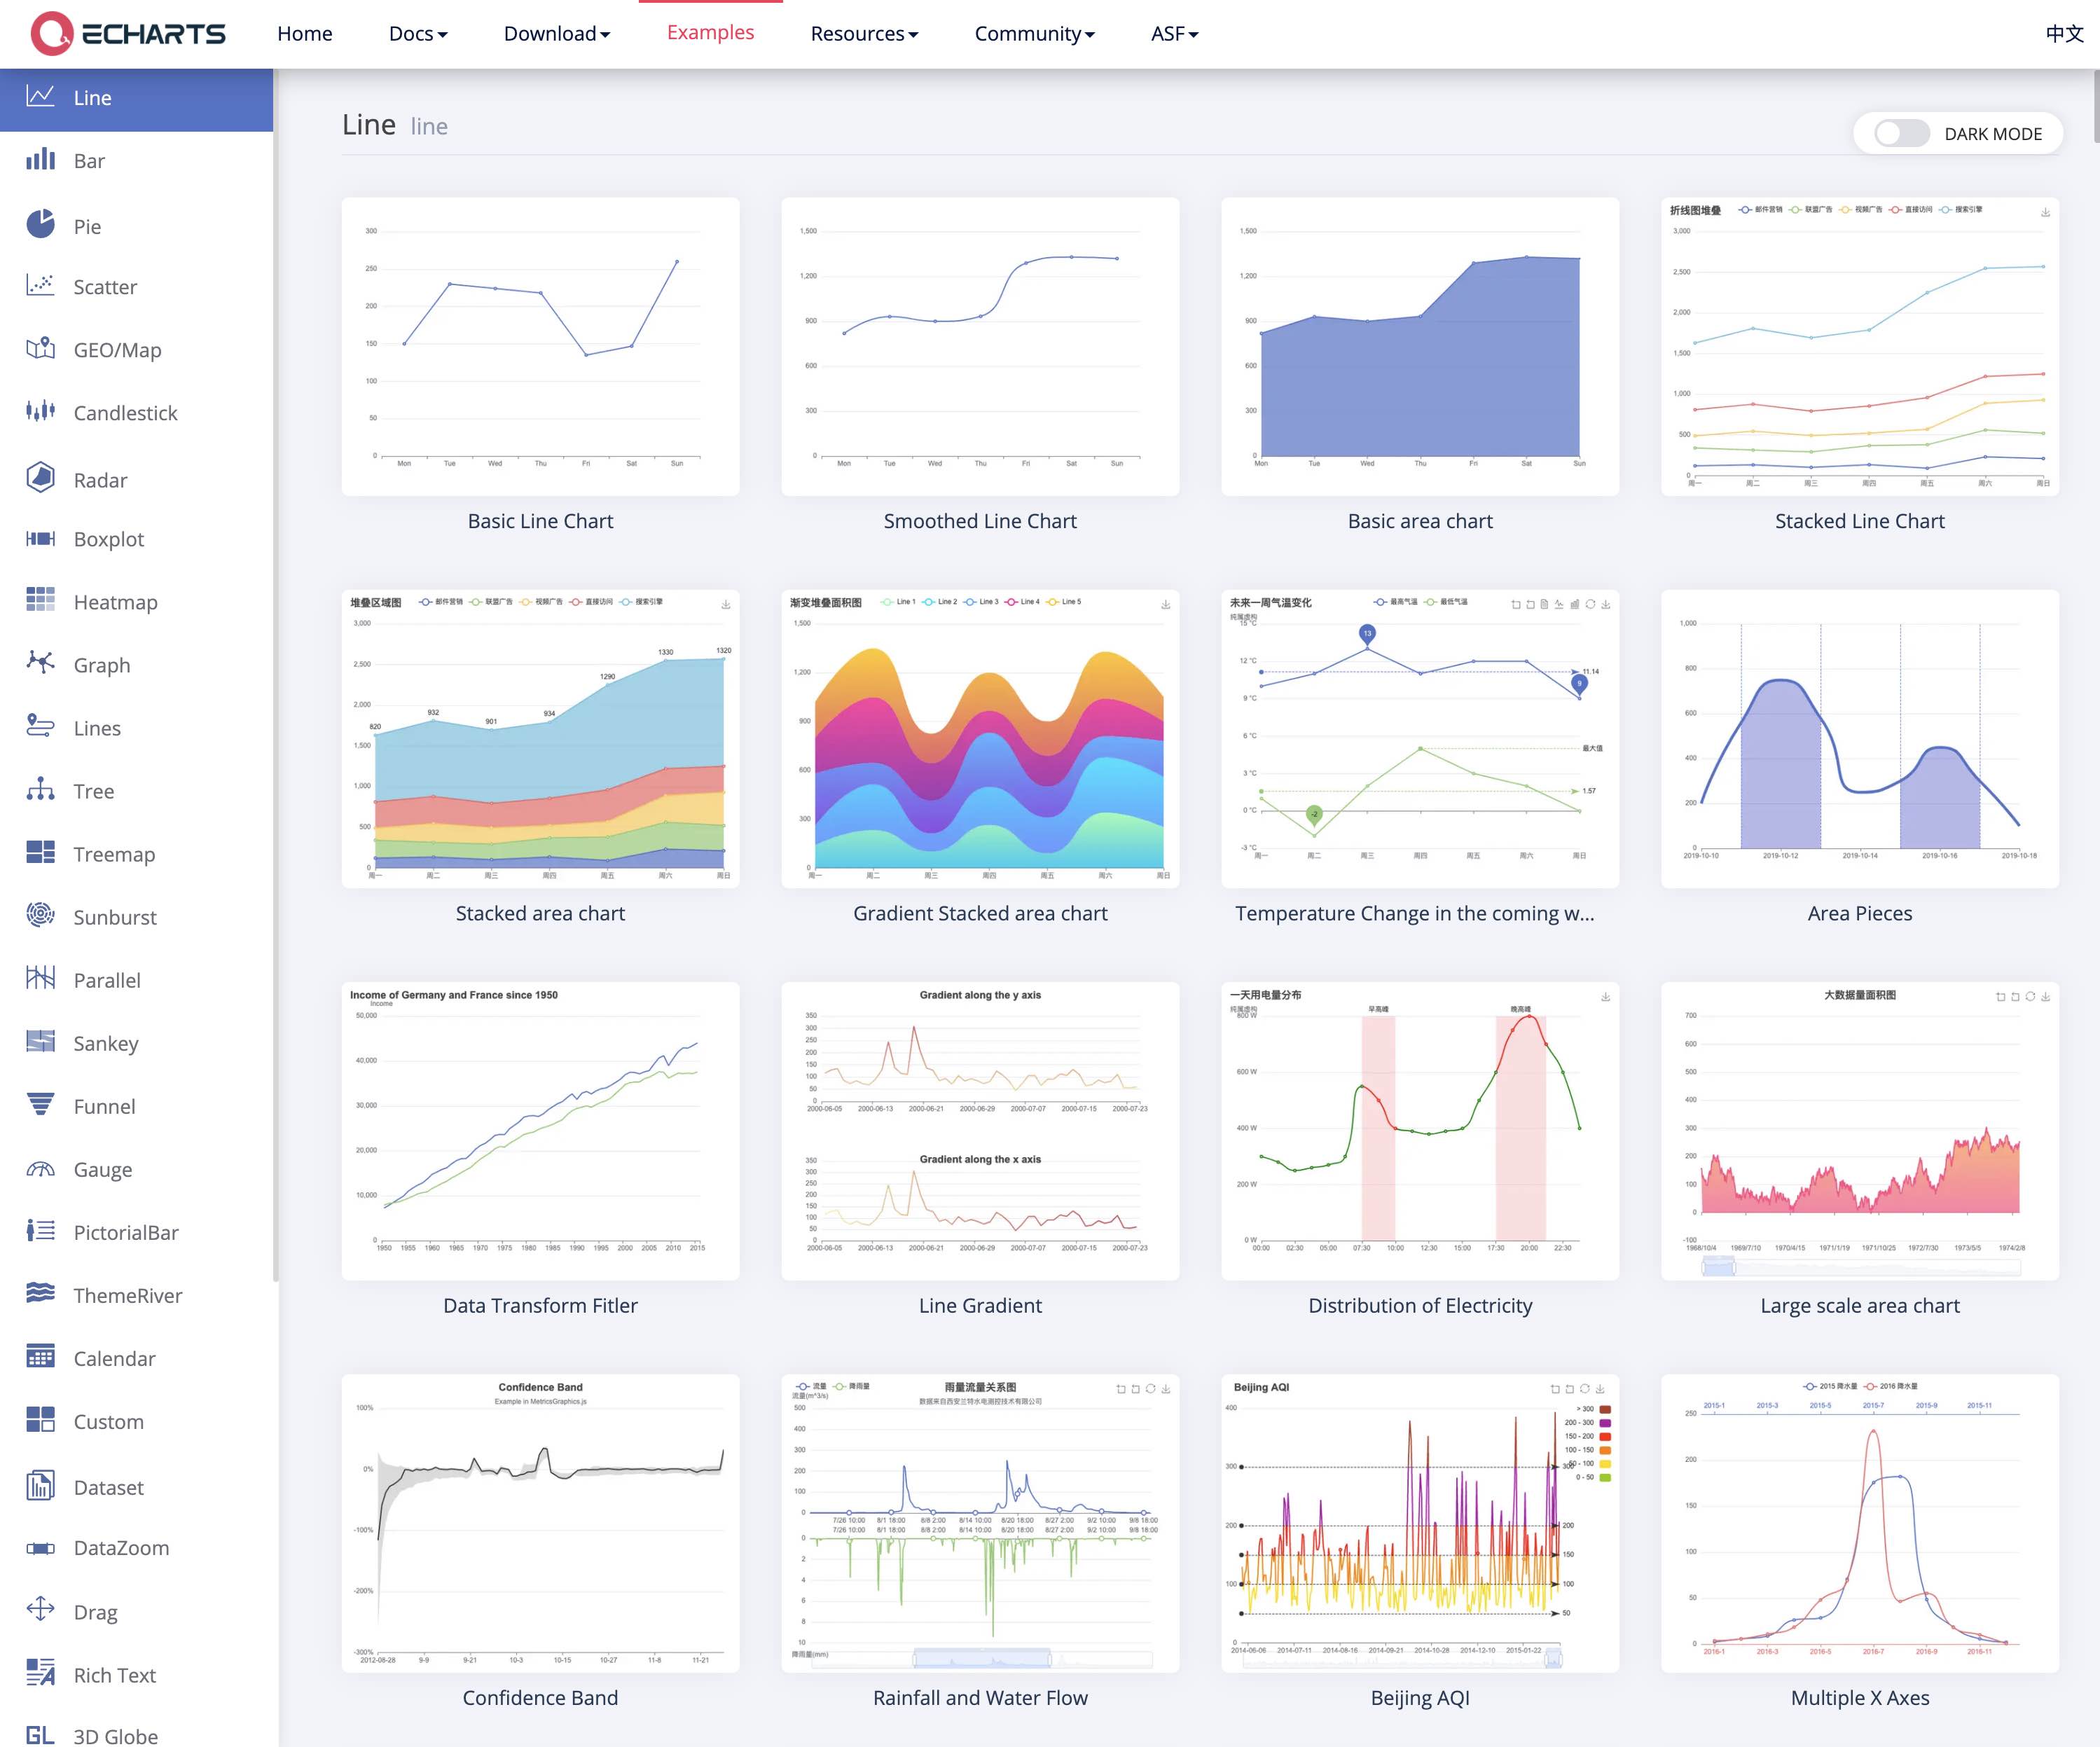
Large library of visualization types
At the time of writing, the ECharts examples gallery had 37 different categories of charts, each with many custom examples. All-in-all, a few hundred charts are provided purely as attractive examples. These examples provide an excellent foundation for further customization.
The Superset community has made excellent progress porting ECharts visualization types into Superset:
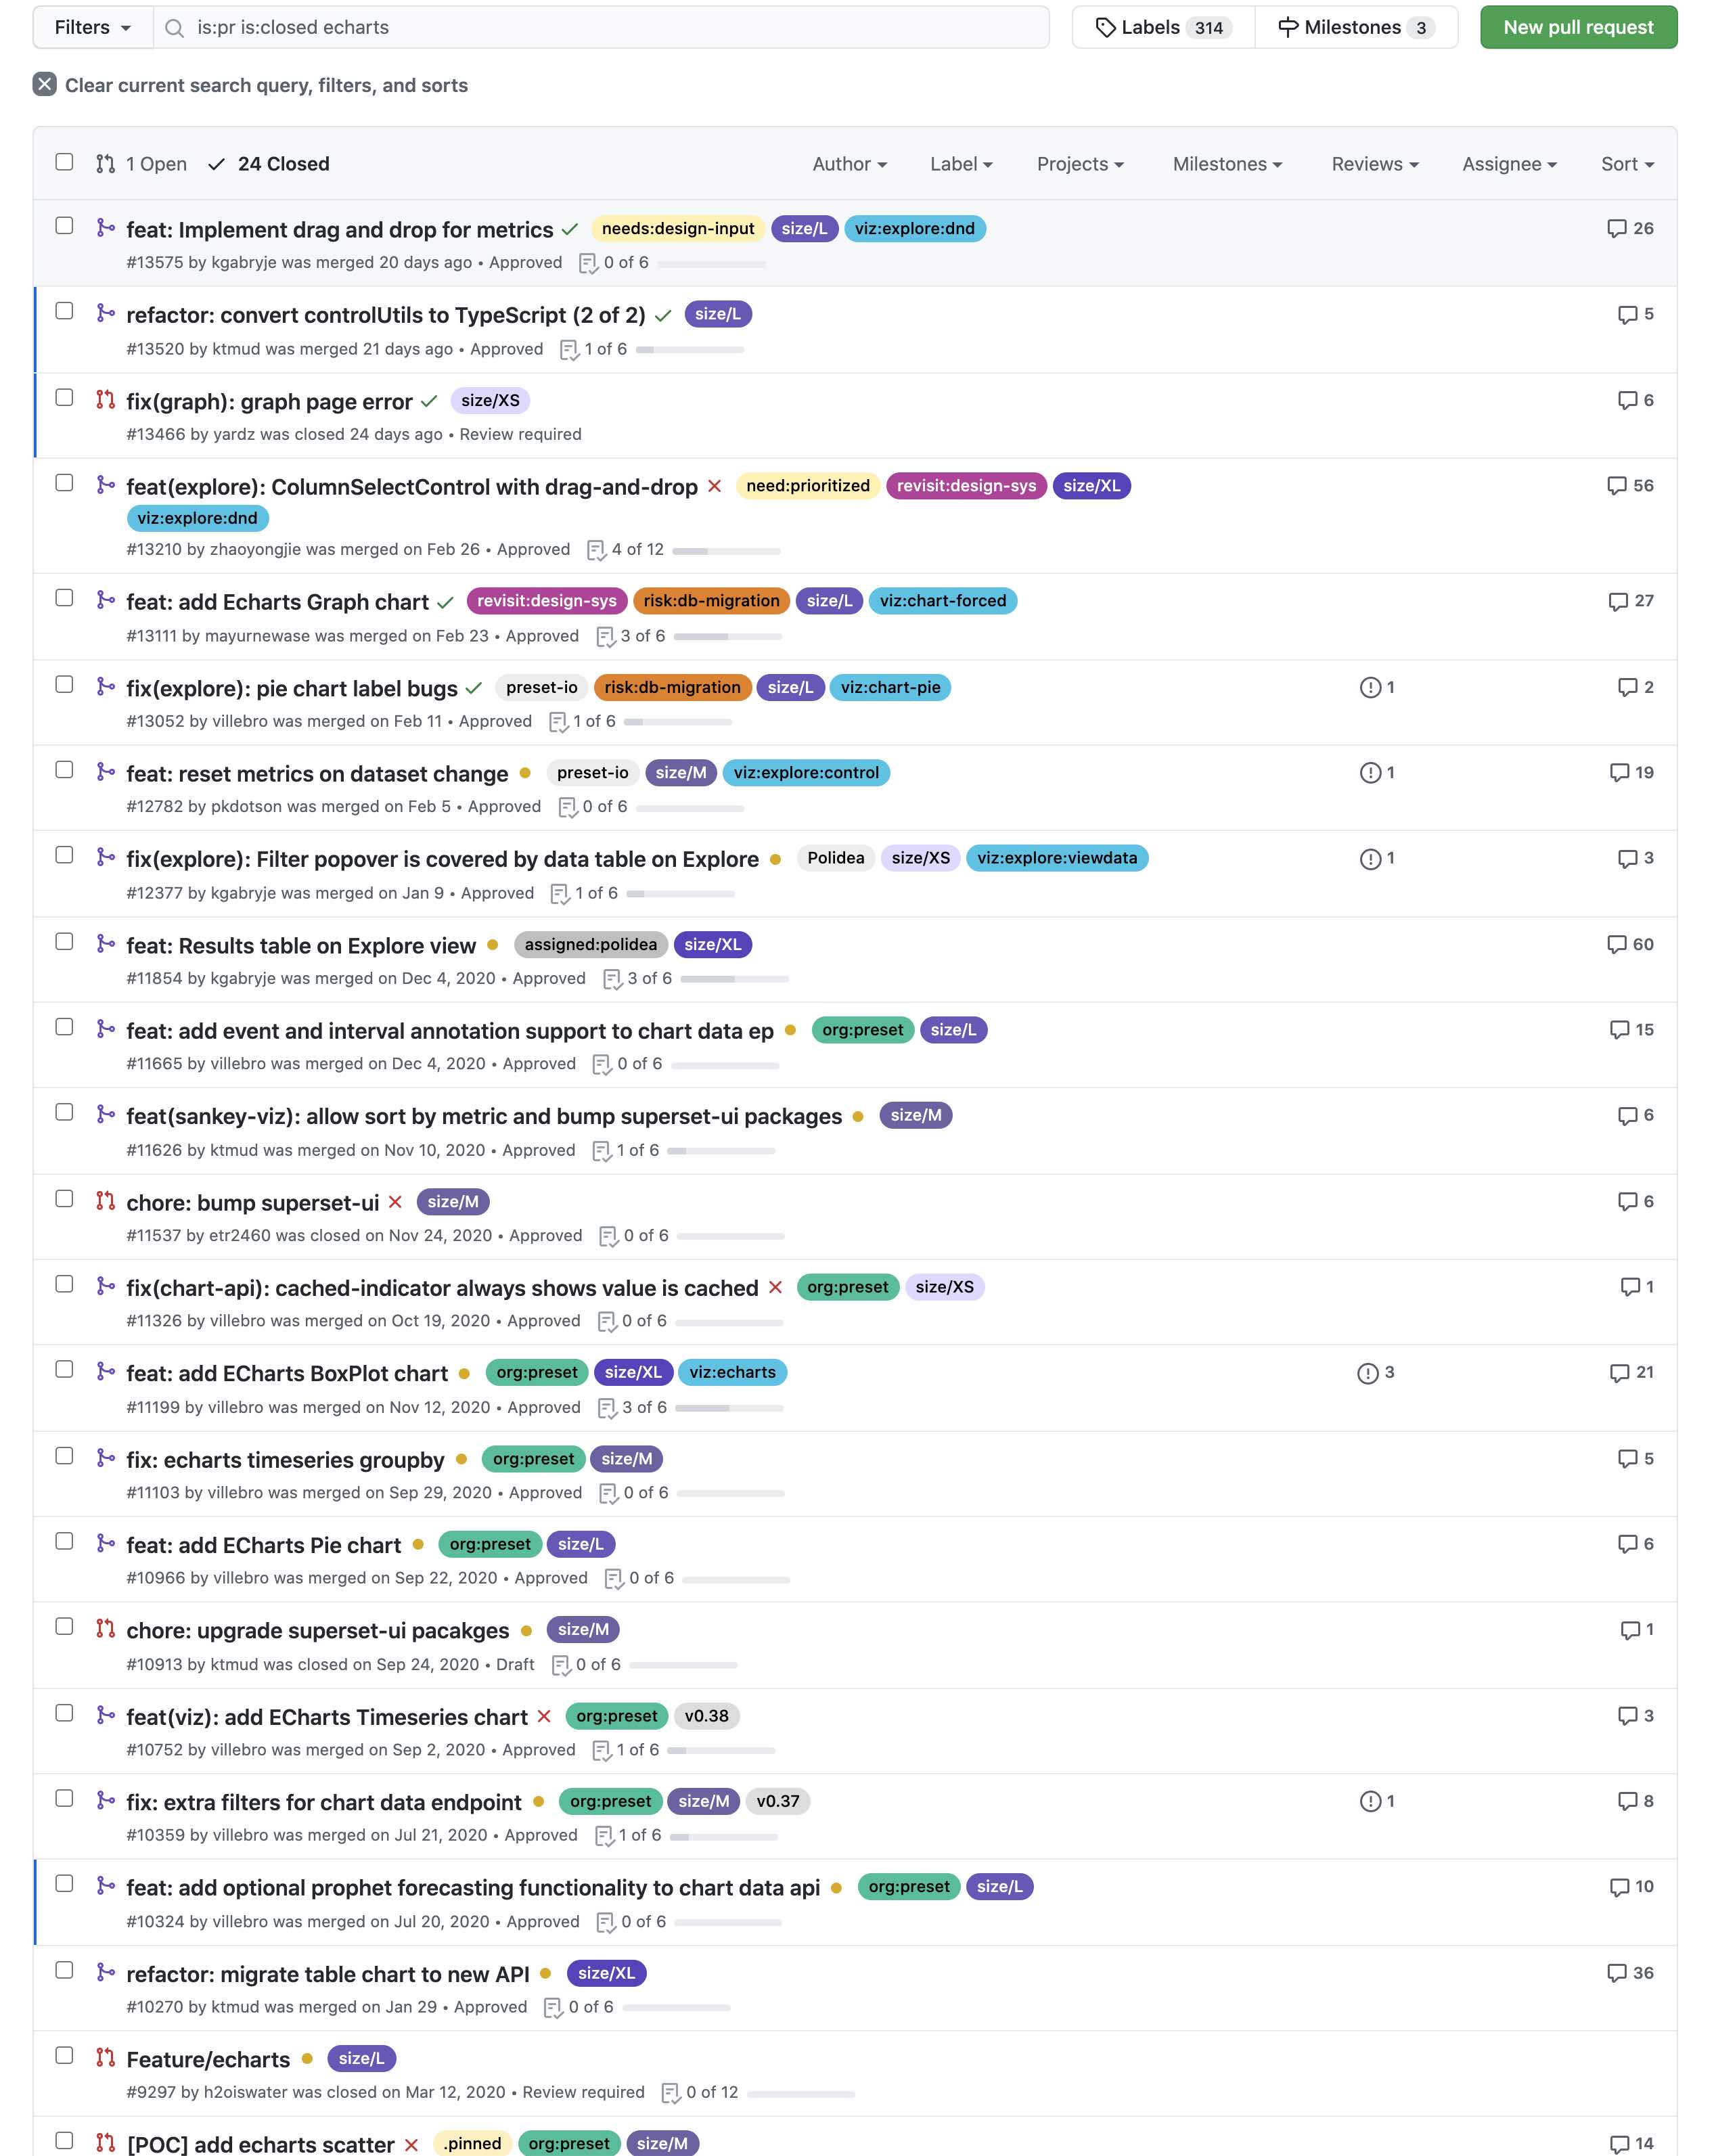
ECharts will enable Superset to ship with a beautiful set of powerful default charts and will also make it easy for people to add new charts with their declarative API.
Strong Governance Model
ECharts is an Apache project, just like Superset! All Apache projects share a set of common values and principles, loosely encapsulated in the Apache way:
- Earned Authority
- Community of Peers
- Open Communications
- Consensus Decision Making
- Responsible Oversight
- Independence
- Community Over Code
In my previous post, How to Contribute to Apache Superset, I explored how Apache projects are especially well suited to encourage folks of all backgrounds (including non-technical ones) to contribute.
This common Apache flavor of open source provided a synergy between both projects, which has resulted in a delightful collaboration between members of both communities.
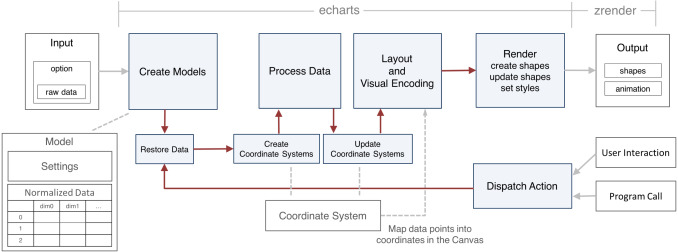
High performance
At the heart of ECharts is the ZRender engine, which supports the popular rendering engines Canvas and SVG. The following is a visual overview for the architecture of ECharts:
Since 4.0, ECharts introduced a streaming architecture which enables two important properties:
- chart data is split into chunks and pushed to the browser
- charts can be rendered incrementally
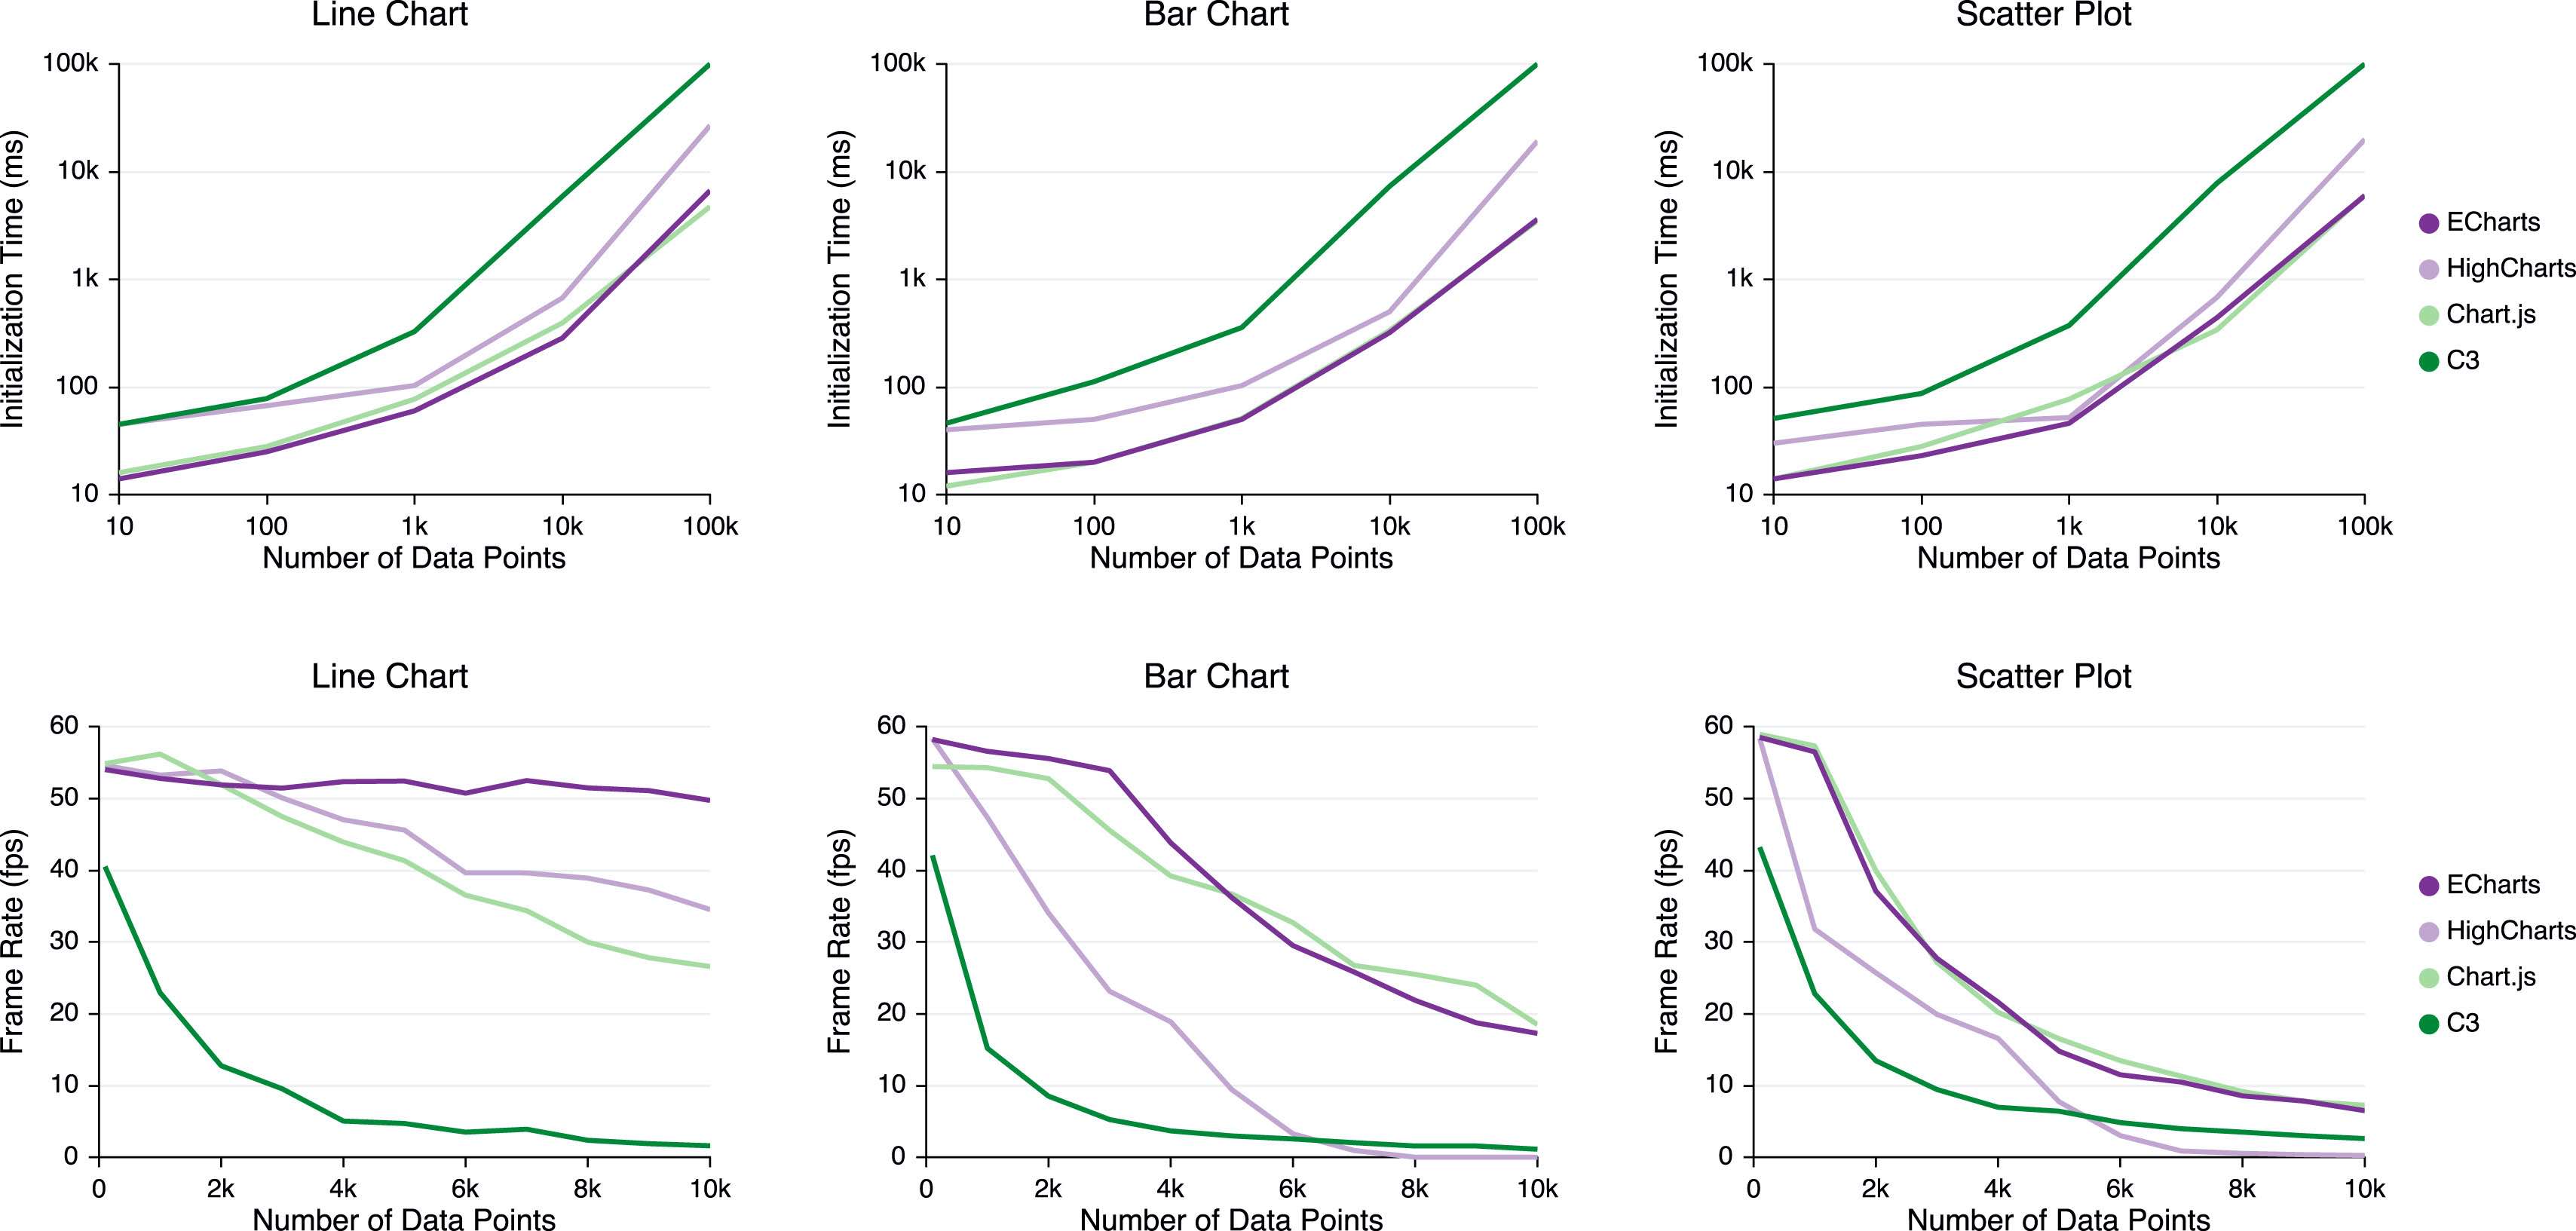
This enables a smoother end-user experience, especially in the face of unreliable packet delivery and low bandwidth connections. When benchmarked against NVD3.js, Highcharts, and C3, ECharts demonstrated a big improvement in performance for the most common chart types.
In addition, ECharts adopted responsive design principles to better enable cross-platform compatibility. Charts render and behave similarly across vastly diferent screen sizes and viewports.
Powerful declarative API
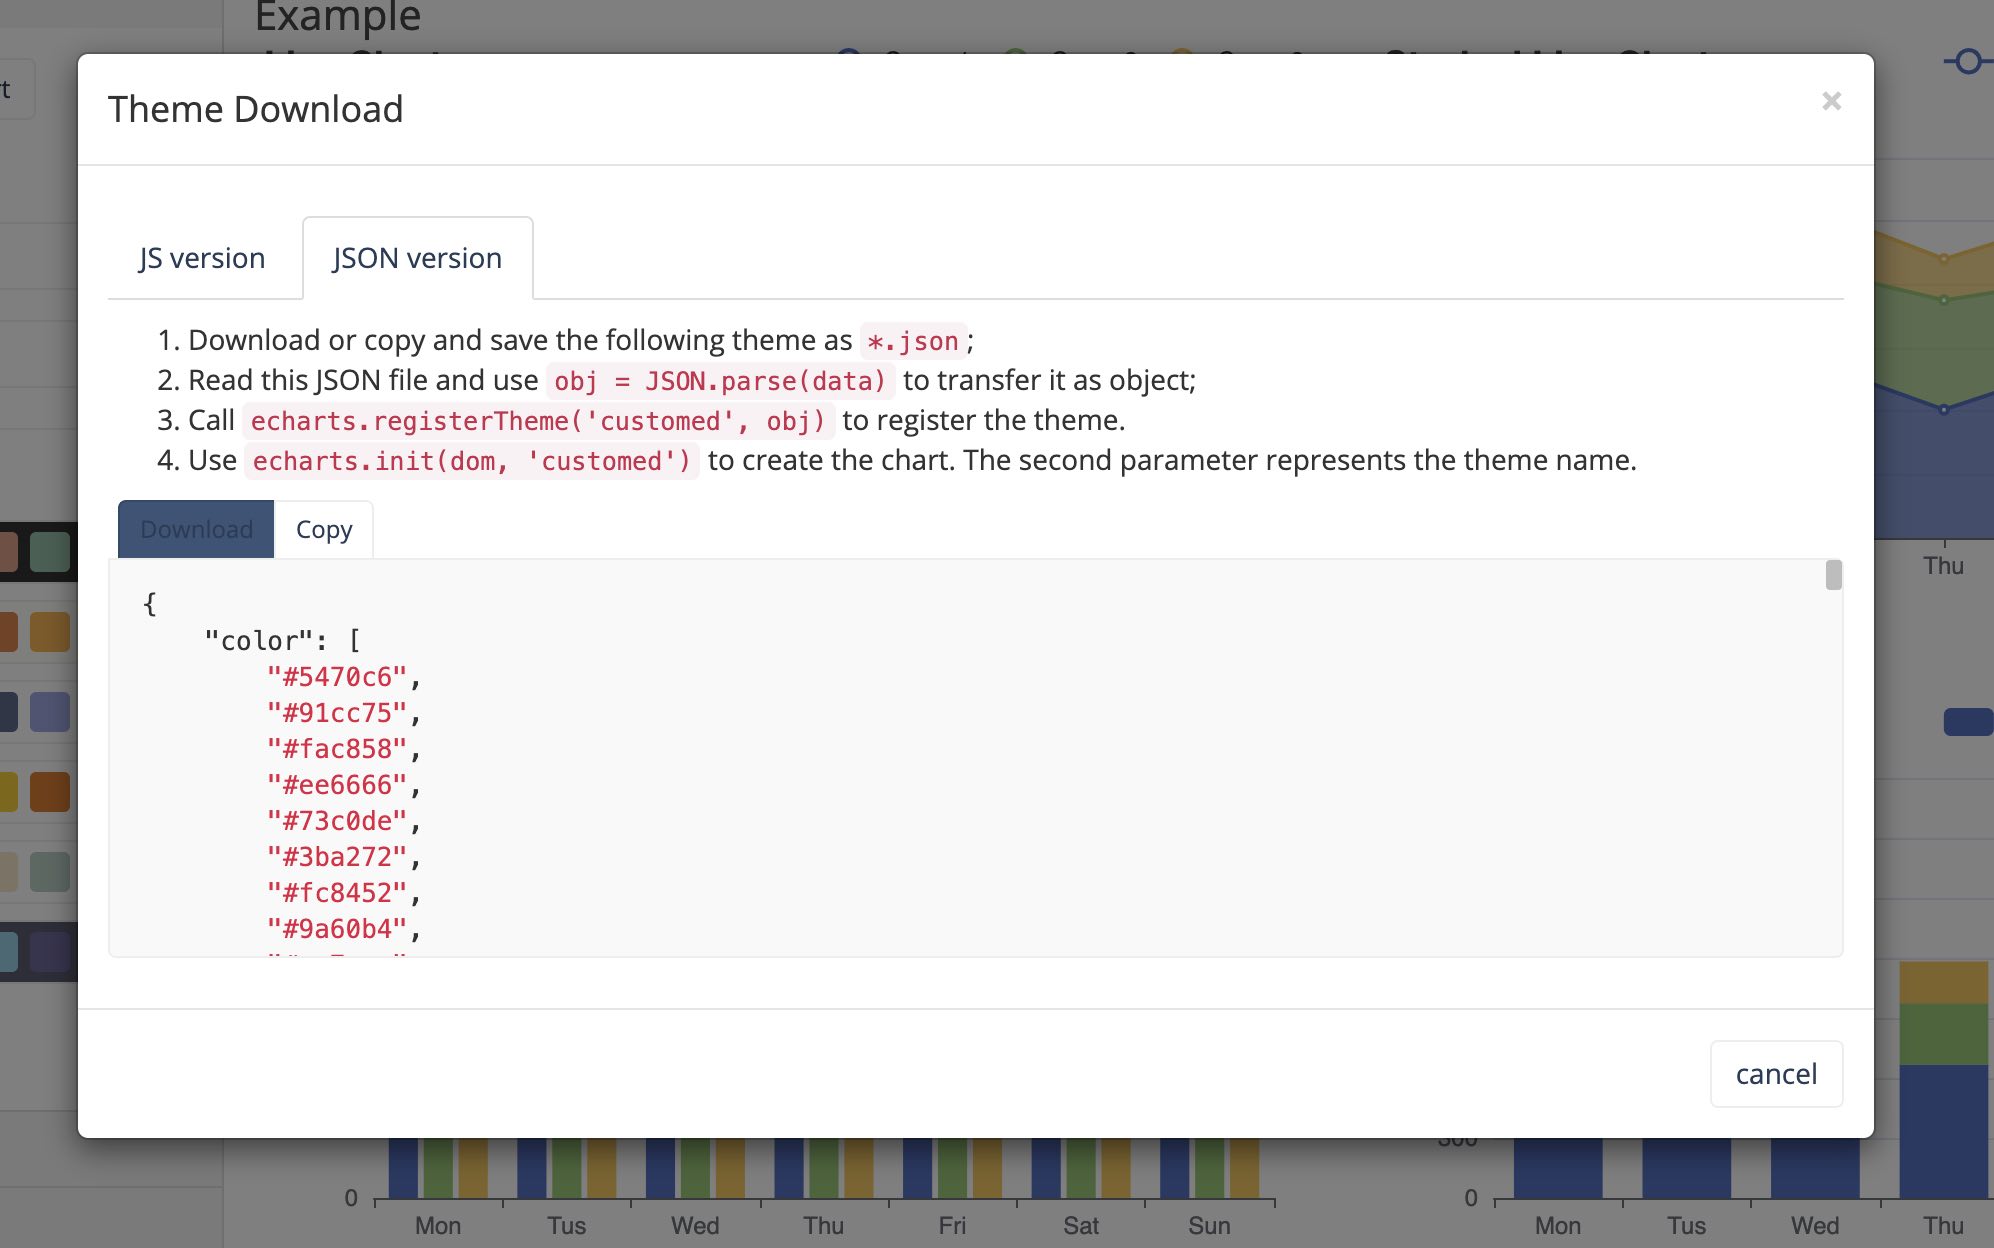
Themes can be specified as JSON files and you can even build and download your own themes using the theme builder on the ECharts website.
The goal of the Explore view in Superset is to provide a no-code interface for people to quickly build charts. ECharts follows the declarative approach to data visualization.
Currently in Superset, you can theme dashboards by manually tweaking the CSS. Superset will eventually move to a theming system that's more declarative. Preset Cloud already offers enhanced theming capabilities for enterprise users.
Because of these attributes, the goal of Explore and the design choices of ECharts are fundamentally highly compatible.
Conclusion
The Superset and ECharts communities have built an excellent relationship and the overlap in design goals is very strong. Stay tuned as the core contributors to Superset finish replacing existing NVD3 charts with ECharts ones and bringing over brand new chart types entirely.
If you're interested in helping out with this effort, please post in the #contributing channel in the Superset Community Slack. If you have feedback, please open a Github issue.
