


How Nielsen Scaled Access To Data Analytics Using Apache Superset


The Nielsen Corporation is a global measurement and data company for fast-moving consumer goods, consumer behavior, and media. They provide clients like Coca-Cola, Walmart, and Unilever with deep insights into what consumers are consuming and buying. Founded in 1923, Nielsen was a pioneering data company which now operates in over 100 countries and employees approximately 44,000 people worldwide.
Amit Miran is the Software Team Lead for the Media Application Framework group at Nielsen. He's based in Tel Aviv, Israel and is an active member of the Superset community. We interviewed Amit to learn more about their transition to Apache Superset.
What were the driving forces behind adopting Superset internally at Nielsen?
Nielsen is a global company with many different R&D sites and a variety of product lines. We are uniting all of the R&D teams to work under a single apps platform. Part of this process is consolidating all of the different dashboarding / reporting solutions to a single solution that will address all of the common needs across the different groups.
In the past, our group has tried to provide a unified dashboarding solution that will answer all of the common needs. However, we kept running into problems when we worked with blackbox, paid offerings. We wanted to customize parts of the dashboarding solution.
Because Superset is open source, we can propose new features or develop them ourselves. We can also embed Superset in our apps platform.
What was the business intelligence stack like before the unification on Superset?
Before Superset, we were paying for a patchwork of proprietary and paid solutions.
How did Superset spread internally once it was up and running?
After we integrated Superset in our apps platform and created a few client facing dashboards, we started exploring the needs of different groups within Nielsen.
One of the most common requests was to add missing chart types and missing features from existing charts.
Around this time, I started getting involved in the Superset community and learning about how others handled these issues. Eventually, I found out that there was going to be an easy way to create new chart types entirely.
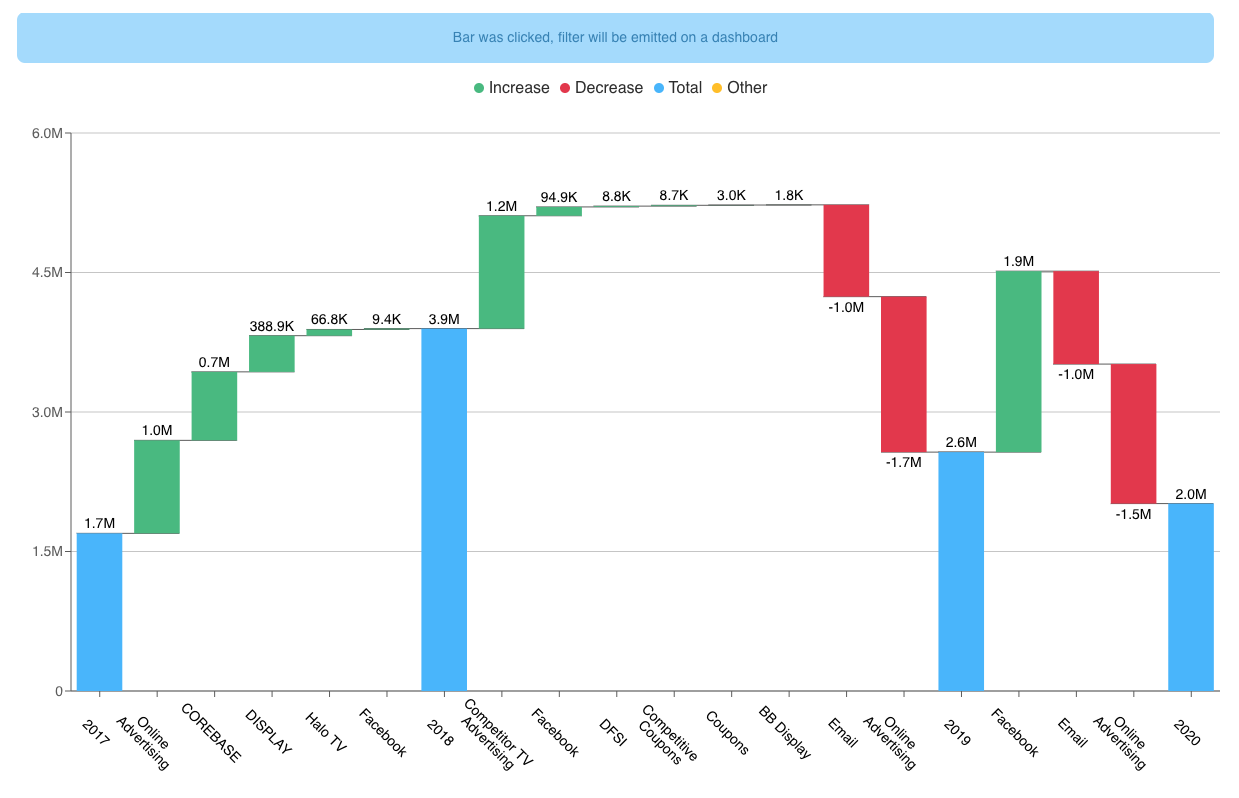
Once the ability to add new viz plugins was released, we used the amazing Hello World! blog post to create a waterfall chart.
What does Superset do well that other tools don't?
Superset has good support for Druid, which most BI tools lack. Integration with Druid is a key requirement for us.
Superset also has a clear vision for what business intelligence should look like.
- open-source core to foster customization (currently incubating at Apache Software Foundation)
- easy-to-use for all personas (ranging from data engineer to business analyst)
- cloud-native and scalable (Superset currently is running at scale at very large companies with thousands of weekly active users)
How complex was it to create a custom viz plugin for Superset?
It was really easy to create one. The key is to get the hang of the different files in the plugin directory and their part in the lifecycle of data requests. Then, you can easily setup new elements in the control panel, transform the data & control panel parameters into props that are passed to the React component. The React component then renders the visualizing using these props.
What are your goals with Superset moving forward?
We intend to develop our own pack of viz plugins, continue being active members in the Apache Superset community, and help with product growth and project maturity.
