


Enhancing Superset Visualization Plugins, Part 1


Perhaps one of Superset’s most-asked-about features is the ability to extend it with custom data visualization plugins, and how that all works. In a prior post, we laid out the scaffolding of how to build a basic plugin, including a code generator to spin up the essential parts, and a general overview of the primary “moving parts” of a Superset viz plugin. While the post and the corresponding video continue to be the best starting place if you haven’t built one before (and are frequently referenced on Slack), it’s merely the tip of the iceberg.
This post is the first of a series picking up where we left off, and starts us on the journey of demonstrating how you can extend your plugins to incorporate some more advanced features that will take your plugin(s) to the next level! Consider this post the “hub” of our series. We’ll dive into each of the key features, and link to additional posts here.
Why extend my plugin?
Obviously, these features will extend your plugin’s capabilities and undoubtedly make your users happier, but adding these features will also exponentially increase the chances of getting your plugin merged into Superset’s codebase. Typically, when someone opens up a PR on the repo to add a plugin (which we encourage you to do), we don’t merge it until it has at least the essential features for the community to adopt and maintain it. Even then, we strive to make sure core plugins have all the features needed to be a “Tier 1” plugin before making it official.
What features can I enable?
There are several features we’ll dive into in this series. Let’s start off with some definitions, and group the features into a few buckets: “Must Have,” “Should Have,” and… “As Needed”.
Note that whether you want to contribute a plugin to Superset, or use it privately on your own deployment or fork, you can build your plugin using any library/toolkit/platform you want. It really just has to be JavaScript (preferably TypeScript). If you want to contribute it to Superset, we usually prefer plugins built on Apache ECharts — while exceptions may apply, it’s our preferred library. Therefore, when we go into examples in this blog series, we’ll be illustrating implementations using ECharts-based code examples.
Caveat emptor: Plugins will differ in their approaches - a chart built with ECharts will be different from a D3 plugin or anything else you might use. This series will illustrate the concepts of these features with sample code, but your plugin might need to vary drastically in its implementation details.
“Must Have” Features
- Chart metadata: When packaging a plugin, you can add thumbnails, tags to mark various supported features, and other metadata attributes to your plugin. We’ll cover this in today’s post below.
- Dashboard Color Palette Support: Dashboard properties in Superset may contain a JSON object of series/color mappings, (e.g. “sportsCar” is red, “taxiCab” is yellow). We’ll show you how your chart can support these color mappings.
- Dynamic controls: In certain plugins, control panels might be confusing if all controls are shown all the time. We’ll show you how to show/hide/modify a control based on the state of another control
- Additional Best Practices: Ok, fine, these aren’t plugin features if you’re building on your own fork, but we consider them essential ingredients if you want your plugin to be part of Superset.
- Shared Controls: There are several control panel inputs that are used by many Superset plugins. We’ll show you where they are and how to use them
- React Storybook: All of Superset’s viz plugins have examples in React Storybook, which allows people to not only see working examples of charts but also lets us test and document their controls and configuration.
- Tests: Whether it’s unit tests, end-to-end tests, or anything in between, we generally only allow code that has been tested, to lower maintenance risk and ensure stability.
“Should Have” Features
- Generic Chart Axis: This term refers to the ability to plot a non-temporal axis for a given chart, typically using a categorical value (dimension), e.g. for car data, you could plot make, model, or color along the X-axis. While Superset once catered strongly toward timeseries-driven data visualizations (it was originally a Druid client), this has been shifting to let charts (e.g. bar/line/area/scatter) support a categorical (dimension-driven) x-axis. This was done behind the
GENERIC_CHART_AXESfeature flag at first, but that flag is now enabled by default and headed toward deprecation. All charts plotted on axes (cartesian, polar, etc.) are expected to support this feature. It’s only under “Should Have” because not all charts even have an axis to speak of. - Normalizing and denormalizing form data: This is a means of effectively standardizing the data your chart’s control panel represents, and storing it in a “normalized” manner. This allows your users to switch between charts smoothly (maintaining input values across plugins) and safely (so that when switching back to a plugin, values are restored).
- Contextual Menu Support:
- Drilling: There are actually two forms of drilling in Superset that plugins can support, and we plan to cover both.
- “Drill to detail” lets you display a tabular representation of the data powering the chart
- “Drill By” lets you choose from additional columns in your dataset to effectively drill into a chart element (e.g. a slice of a pie chart) by adding a “group by” clause on the selected dimension and a filter (our pie slice).
- Cross-Filtering: This is a bi-directional binding of charts and dashboards for instant filtration. A chart is able to emit a cross filter to the dashboard, which relays it to other appropriately scoped dashboards. Charts are also able to receive cross-filters to limit the data displayed
- Drilling: There are actually two forms of drilling in Superset that plugins can support, and we plan to cover both.
- Currency/number formatting: Superset has recently been improving its support for global currencies (and number formatters). Your plugin can also provide controls to more deeply support the specific needs of currency display.
- Legend interaction: Many charts in Superset let you use the chart’s legend for additional features (highlighting or hiding a displayed series, for example).
As Needed: Features You Might Want to Use
- Advanced Analytics: If your chart needs to plot rolling windows, cumulative sums, historical comparisons, or various other comparative calculations, you can add this suite of tools to your plugin.
- Conditional Coloring: If you want to assign colors to values on your chart (across a gradient, solid colors with set thresholds, or various other options). We’ll dig into approaches you might take.
- Custom post-processing operations: Certain charts require you to take the results of your query and do some transformation on them server-side. For instance, the Pivot Table needs to pivot! It’s possible to use existing post-processing operations, or (if needed) contribute your own.
- Predictive analytics: Superset’s time-series charts include an option to apply Prophet for predictive analytics, and this is available for other plugins to use as well!
- Annotation layers: Some charts in Superset allow you to add an annotation layer using a secondary chart as the source of the annotations/data. This feature can be added to enrich and provide additional context for your chart.
“Must-Have” Feature #1: Chart Metadata!
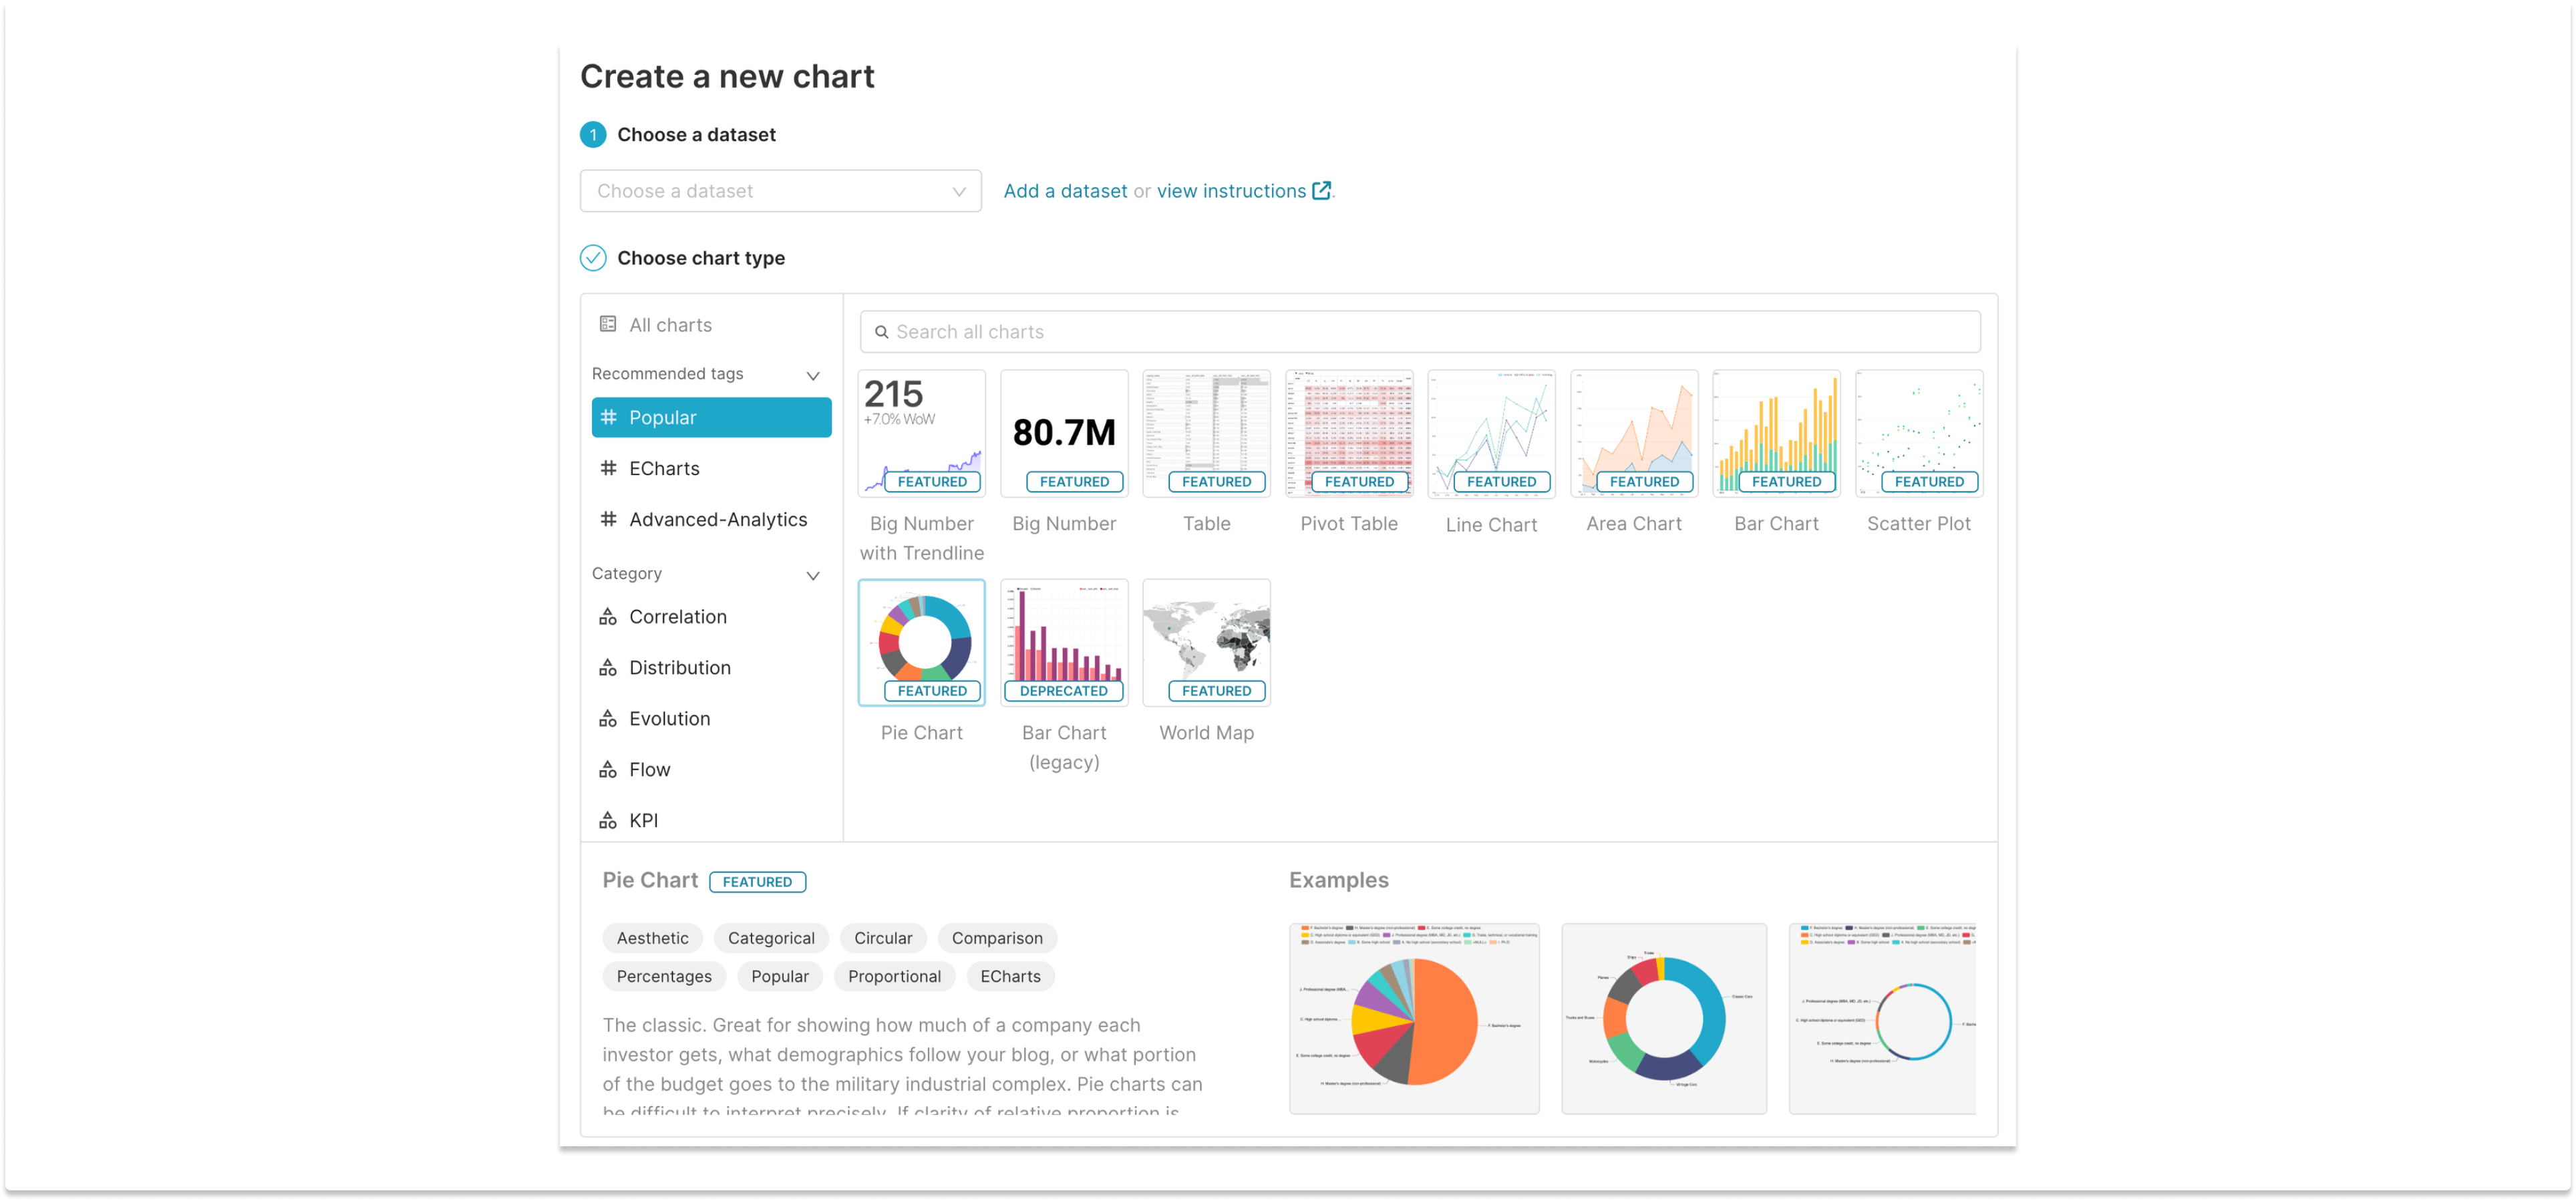
You didn’t think we were going to drop a glossary and walk away, did you? In this first post of the series, we’ll cover the most essential of the “must-have” list for any plugin: metadata! All plugins have a bunch of metadata that can be added. Among other things, this populates the visualization picker/gallery seen here:
Let’s look at Superset’s “Generic Chart” plugin (formerly “Time-Series Chart”, but no longer constrained to temporal applications). This all-purpose line/bar/area/scatter chart provides a good example of a real-world metadata object, with many common fields populated. You can even see that there are a few parts of the code (description and even the chart name/title) that change depending on the GENERIC_CHART_AXES flag. We’ll talk about that feature flag in a subsequent post, but it illustrates that you can use custom logic in your config, too. Side note: this feature flag will be deprecated soon and examples like this will be simplified. Hooray!
metadata: {
  behaviors: [
    Behavior.INTERACTIVE_CHART,
    Behavior.DRILL_TO_DETAIL,
    Behavior.DRILL_BY,
  ],
  category: t('Evolution'),
  credits: ['https://echarts.apache.org'],
  description: hasGenericChartAxes
    ? t(
        'Swiss army knife for visualizing data. Choose between step, line, scatter, and bar charts. This viz type has many customization options as well.',
      )
    : t(
        'Swiss army knife for visualizing time series data. Choose between step, line, scatter, and bar charts. This viz type has many customization options as well.',
      ),
  exampleGallery: [{ url: example }],
  supportedAnnotationTypes: [
    AnnotationType.Event,
    AnnotationType.Formula,
    AnnotationType.Interval,
    AnnotationType.Timeseries,
  ],
  name: hasGenericChartAxes ? t('Generic Chart') : t('Time-series Chart'),
  tags: [
    t('Advanced-Analytics'),
    t('Aesthetic'),
    t('Line'),
    t('Predictive'),
    t('Time'),
    t('Transformable'),
  ],
  thumbnail,
},
For a truly detailed view of all the options on the table, we can look at the type definition from ChartMetadata.ts:
export interface ChartMetadataConfig {
  name: string;
  canBeAnnotationTypes?: string[];
  credits?: string[];
  description?: string;
  datasourceCount?: number;
  enableNoResults?: boolean;
  supportedAnnotationTypes?: string[];
  thumbnail: string;
  useLegacyApi?: boolean;
  behaviors?: Behavior[];
  exampleGallery?: ExampleImage[];
  tags?: string[];
  category?: string | null;
  // deprecated: true hides a chart from all viz picker interactions.
  deprecated?: boolean;
  // label: ChartLabel.DEPRECATED which will display a "deprecated" label on the chart.
  label?: ChartLabel | null;
  labelExplanation?: string | null;
  queryObjectCount?: number;
  parseMethod?: ParseMethod;
}
Let’s break this down a bit and highlight some of these, shall we?
- Frequently used:
name: Quite simply, the name of the chart! Try to use something distinct from other charts here, to reduce potential confusion.description: This is a text string that displays in the viz picker gallery when the chart is highlighted/selected.credits: This is simply a place to add attribution. For example, we add attribution for the ECharts library here.thumbnail: This is the small/square chart icon that each plugin shows in the gallery. The yeoman generator does include a default one, but you’ll surely want to customize this to stand out.behaviors: These are features that are supported by your chart. For example, if you implement either/both of the drilling features in your plugin, the correctBehaviorshould be added as well. For example, if you don’t addINTERACTIVE_CHARTto a chart that supports cross filters, you won’t get the appropriate tooltips in the UI.exampleGalleryHere you can add paths to one or more images showing examples of your chart in action. For many charts, there are various customizable options that change the display layout, which would warrant adding multiple thumbnail specimens to show off your chart’s flexibility.tagsAs you can see in the chart gallery, there are several tags available to help users find your plugin based on features and capabilities. You can add more tags if you wish, but it’d be wise to stick with established tags that include multiple plugins rather than proliferating one-off tags. Also, note that a few tags are “recommended” and float to the top of the sidebar. If you fit these categories, it would be helpful to use them.categoryUnlike tags, this is a single entry field that lets users pick a family/category of visualization type that fits best.
- Less frequently used:
canBeAnnotationTypes: This denotes that the chart can be used as the source for creating different types of annotations in charts that support annotation layerssupportedAnnotationTypes: The different types of annotation layers supported by the chart (which correlates withcanBeAnnotaionTypes)deprecated: this flag simply hides a chart type from the viz picker gallery, so that existing instances of the chart can continue while making it difficult (but not impossible) to create new instances of a deprecated chart.queryObjectCount: a few charts (e.g. “Mixed Timeseries”) will actually fire off two (or, theoretically more) queries. This makes sure Superset behaves accordingly with things like the right number of Sample/Results tabs in the chart builder.label: this lets you (optionally) add either a “Featured” or “Deprecated” label on top of the chart’s thumbnail.
- “Here be dragons”
useLegacyApi: this represents the legacy API endpoint to get chart data, which we’re on a long path toward depracating. Just… don’t use it!parseMethod: - all Superset plugins currently parse JSON data (usingjson-bigint), but if your chart is an exception, then this is where you’d make adjustments.labelExplanation: this allows you to override the default tooltip explanations for thelabel. That’s fine, but it’s seldom used and might be deprecated before long.datasourceCount: This sets how many datasets are associated with a plugin. All plugins have a value of 1 except for the Time Filter plugin (yep… dashboard filters are also based onChartPlugin, but that’s another story). Long story short, you probably won’t need this.enableNoResults: This enables a “no results” component that query data is empty or null. You probably just want to leave this enabled (which it is, by default).
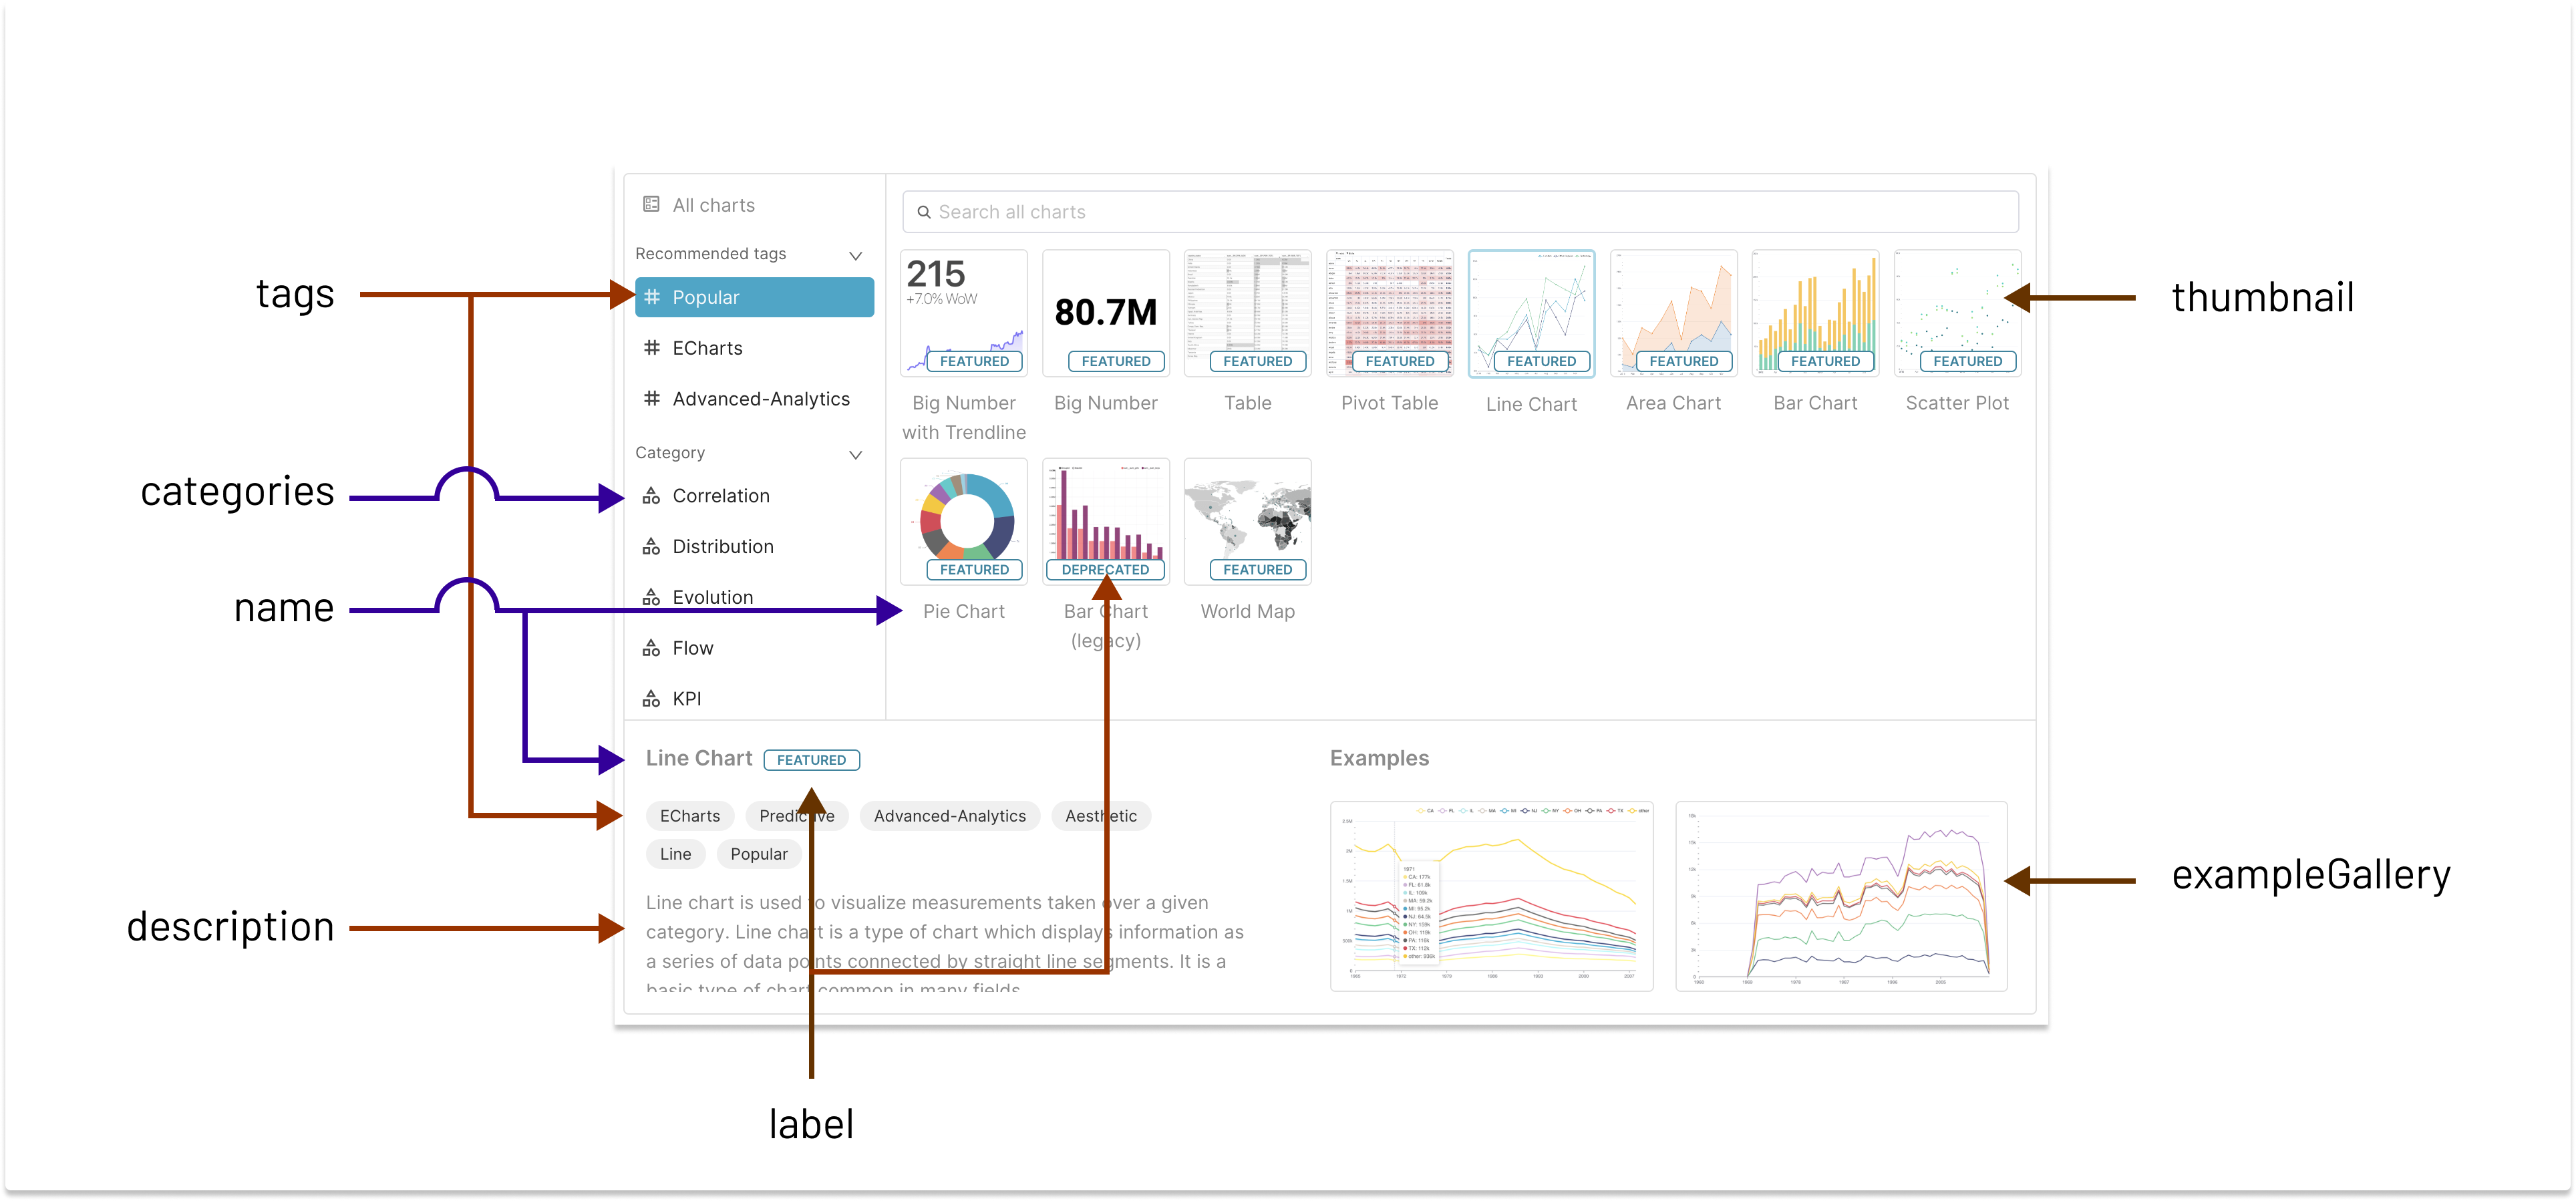
To sum up the more visible aspects of this, here’s a guide to where several of those flags end up in the chart gallery layout:
Up Next: Getting Fancy With Controls
The control panel is central to any plugin, and there are a lot of things you can do to make yours easier to use and easier to maintain. In our next post, we’ll get into the specifics of how to build Conditional Controls, Dynamic Controls, Shared Controls, and Instant Controls. Stay tuned!
Meanwhile, don't forget to register for the imminent meetup, where we'll discuss all of the above, walk through some code, and start answering some of your questions on the subject!
